AIER’s Thanksgiving Cost Index Climbs Over 5 Percent from 2022 to 2023

For the past few years, we have reported on the change in prices associated with various holiday seasons. The Thanksgiving Cost Index was the first, a product of our desire to track not just general price trends, but those of goods and services linked to specific events.
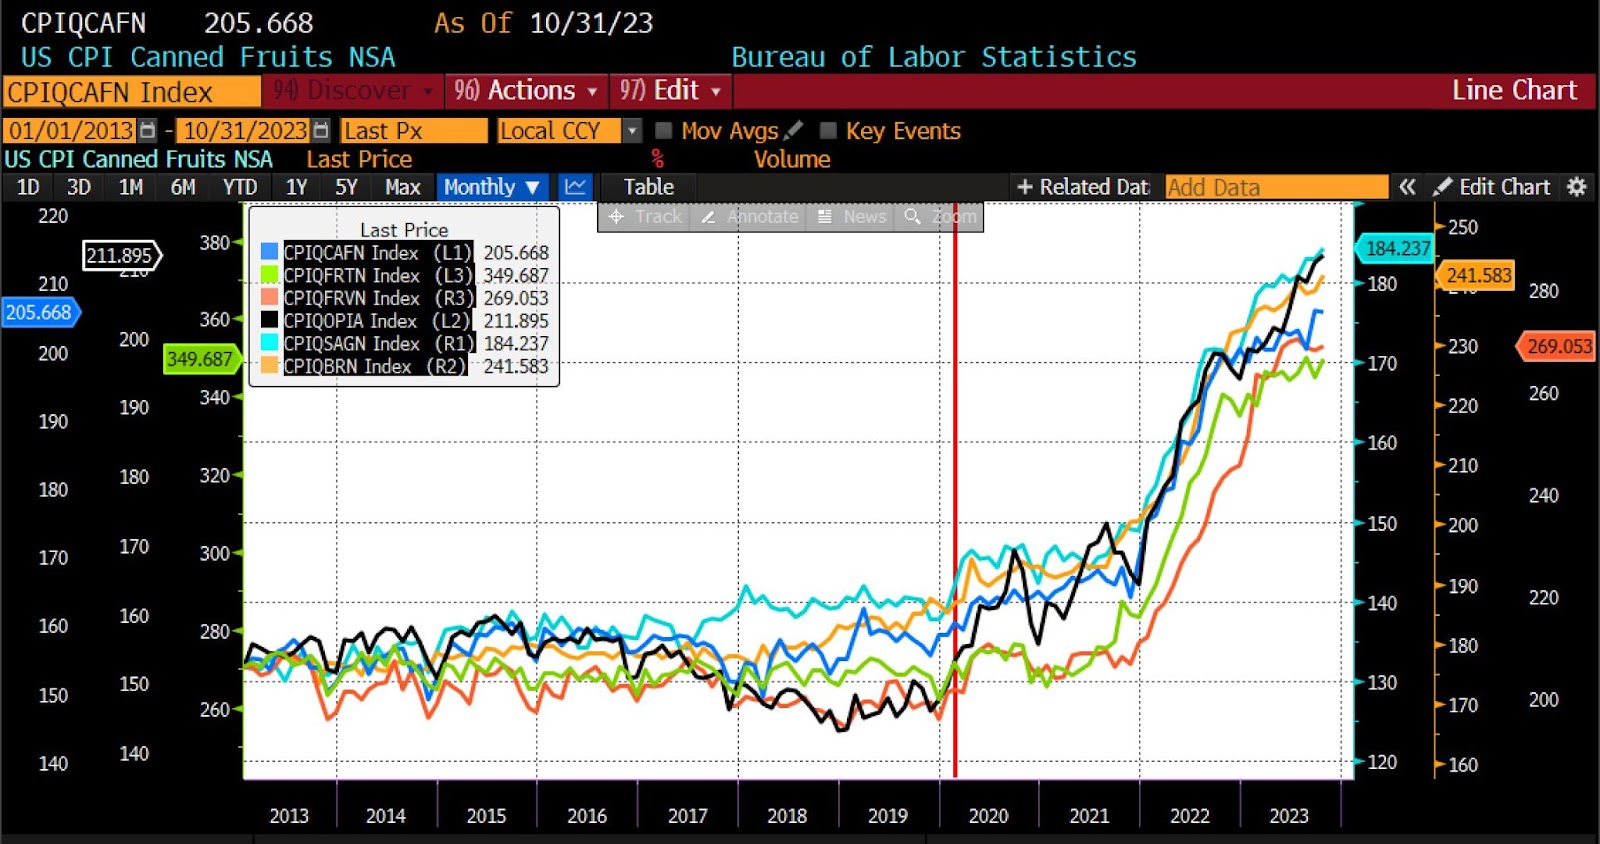
The constituents of the Thanksgiving Cost Index include the six CPI subcategories: turkey (and other poultry), sauces and gravies, bread (rolls and biscuits), canned fruit, vegetables, and pies and cakes. We also track the price of food away from home for comparison’s sake. Without further ado, the price changes are shown below, first as a ten year chart, and then over the past three years.
Thanksgiving Cost Index constituents (red vertical line indicates start of COVID monetary policy response), 10 years
| Oct | Oct | Oct | |
| 2020 to 2021 | 2021 to 2022 | 2022 to 2023 | |
| US CPI Other Poultry Including Turkey | 1.68% | 16.89% | 7.25% |
| US CPI Bread | 2.29% | 14.78% | 6.27% |
| US CPI Biscuits, Rolls, and Muffins | 4.76% | 13.57% | 5.68% |
| US CPI Potatoes | 1.66% | 15.19% | 3.34% |
| US CPI Frozen Vegetables | -0.30% | 16.74% | 10.69% |
| US CPI Fresh Vegetables | 1.69% | 8.28% | -2.22% |
| US CPI Canned Fruits | 2.87% | 18.68% | 3.09% |
| US CPI Sauces and Gravies | 1.76% | 14.57% | 7.48% |
| US CPI Food Away from Home | 12.04% | 8.59% | 5.37% |
The Inflation Reduction Act notwithstanding, the Thanksgiving Cost Index rose 5.3 percent between October 2022 and October 2023, from an index level of 1378.96 to 1451.78. That’s substantially less than the 17.8 percent increase from October 2021 to 2022, but a steeper increase than both the 2020 to 2021 (3.37 percent) and 2019 to 2020 (2.94 percent) rises. The cost of eating at a restaurant rose almost identically over the same time period (5.37 percent).
The twenty-year trend in the combined index is shown below — again with the start of the Fed’s COVID response indicated by a horizontal red bar. Since October 2019, our Thanksgiving Cost Index has risen 32 percent (1099.537 to 1451.781).
AIER Thanksgiving Cost Index, 2013 – present
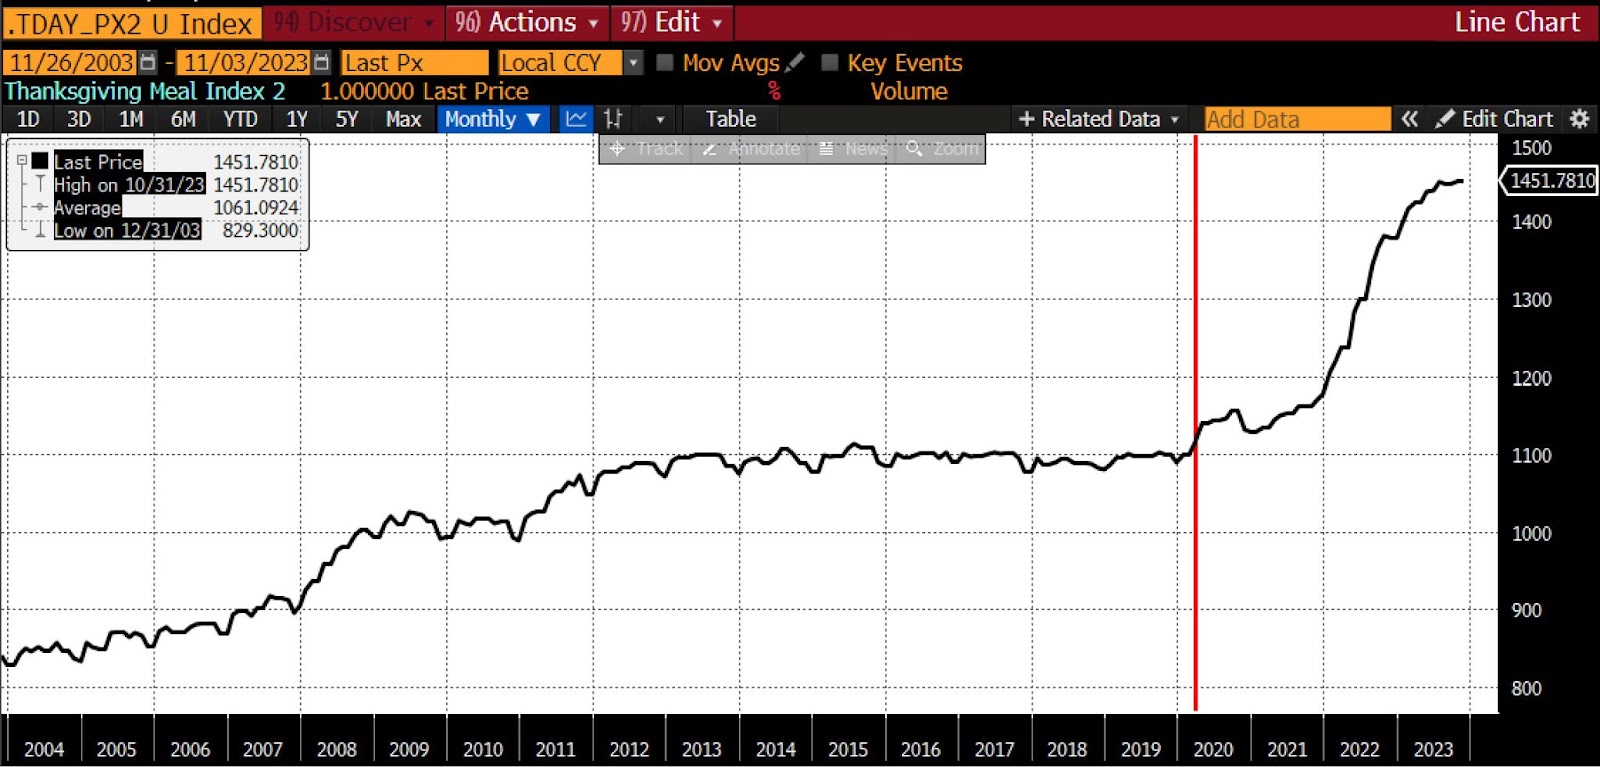
(Source: Bloomberg Finance, LP)
The American Farm Bureau Federation calculates that Thanksgiving dinners will be about 4.5 percent cheaper than last year’s historically high prices, reaching the same conclusions that we do using a somewhat different basket of goods.
We also examine a second set of prices, best described as “secondary” or “auxiliary” Thanksgiving expenses. They include costs that tend to be incurred around Thanksgiving but do not include food: transportation, grooming, and the like. Between 2022 and 2023, three of these prices took part in the overall deflationary trend: for gasoline, airline tickets, and intercity transportation (buses and trains), prices declined. Yet a handful of seasonally-engaged services — haircuts, dry cleaning/laundry, and pet care — rose at nearly twice the October year-over-year headline CPI rate (3.2 percent) from October 2022 to October 2023.
| Oct | Oct | Oct | |
| 2020 to 2021 | 2021 to 2022 | 2022 to 2023 | |
| AAA Gasoline (average, US) | 51.64% | 20.00% | -7.88% |
| US CPI Gasoline, Regular Unleaded | 51.28% | 17.07% | -5.58% |
| US CPI Airline Fare | -4.63% | 42.89% | -13.20% |
| US CPI Other Intercity Transportation | 4.60% | 4.07% | 0.37% |
| US CPI Haircuts and Personal Care Services | 4.31% | 5.59% | 5.04% |
| US CPI Pet Services Including Veterinary | 3.93% | 10.67% | 7.29% |
| US CPI Laundry and Dry Cleaning | 6.92% | 7.19% | 6.15% |
In 2023, Americans are facing another expensive holiday season stemming largely from the monetary interventions enacted during the initial stages of the COVID pandemic. Disinflation is underway, but as the AIER Thanksgiving Cost Index makes clear those effects are taking effect both slowly and not pervasively. The uptrend in both the general price level, and in this cultural touchstone as well, are the enduring legacy of the 2020 policy choices of the Federal Reserve.
Peter C. Earle

Peter C. Earle, Ph.D, is a Senior Research Fellow who joined AIER in 2018. He holds a Ph.D in Economics from l’Universite d’Angers, an MA in Applied Economics from American University, an MBA (Finance), and a BS in Engineering from the United States Military Academy at West Point.
Prior to joining AIER, Dr. Earle spent over 20 years as a trader and analyst at a number of securities firms and hedge funds in the New York metropolitan area as well as engaging in extensive consulting within the cryptocurrency and gaming sectors. His research focuses on financial markets, monetary policy, macroeconomic forecasting, and problems in economic measurement. He has been quoted by the Wall Street Journal, the Financial Times, Barron’s, Bloomberg, Reuters, CNBC, Grant’s Interest Rate Observer, NPR, and in numerous other media outlets and publications.