New Home Sales Jump to the Highest Level Since 2007

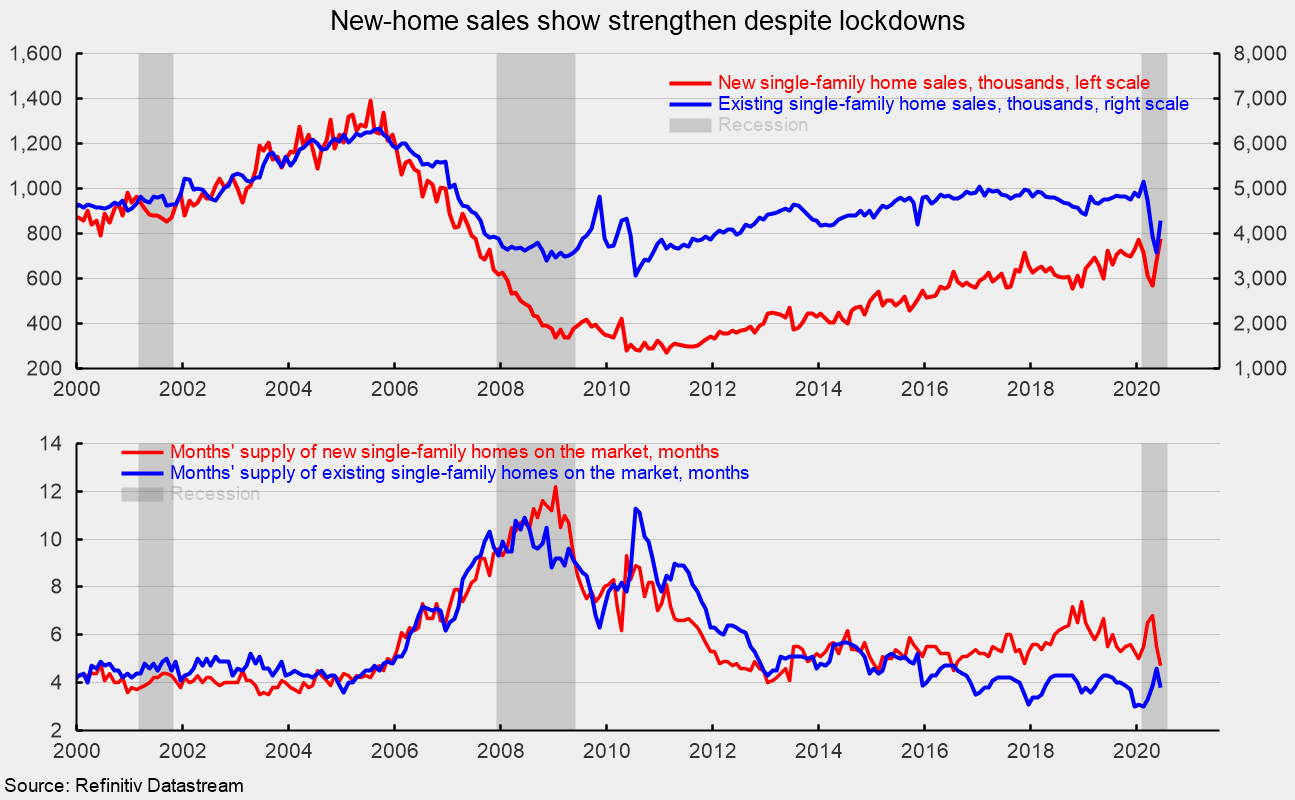
Sales of new single-family homes have bounced back, posting gains in May and June following three consecutive drops in February, March, and April. Total sales jumped 13.8 percent in June to a 776,000 seasonally adjusted annual rate, the fastest pace since July 2007, and are up 6.9 percent from a year ago (see top chart).
Sales rose across all four regions tallied: sales surged 89.7 percent in the Northeast, putting sales 111.5 percent above year-ago levels; sales were up 18.0 percent in the West, leaving that region’s sales rate 4.1 percent above the year-ago pace; sales were up 10.5 percent in the Midwest (and were 33.3 percent above year-ago levels); while in the South – the largest region by sales volume – sales increased 7.2 in June but were 1.8 percent below the year-ago level.
Total inventory of new single-family homes for sale declined 1.3 percent to 307,000 in June, the third decrease in a row, leaving the months’ supply (inventory times 12 divided by the annual selling rate) at 4.7, down 14.5 percent from May’s 5.5 months, and 14.5 percent below the year-ago level (see bottom chart).
Sales in the market for existing single-family homes rose 19.9 percent in June, coming in at a 4.28 million seasonally adjusted annual rate (see top chart). From a year ago, sales are off 9.9 percent. The June pace is about in line with the dip in early 2014 but below the range of 4.4 million to 5 million since early 2015 (see top chart).
By region, sales for existing single-family homes followed the same pattern as total existing homes: sales were up 30.8 percent in the West but are still down 12.4 percent from the year-ago level; sales rose 24.2 percent in the South, leaving that region’s sales rate 2.5 percent below the year-ago pace; sales gained 11.7 percent for the month in the Midwest but are 12.5 percent below the June 2019 rate; and sales were up 4.9 percent in the Northeast, leaving sales 25.9 percent below year-ago levels.
The existing single-family home segment saw inventory fall 0.7 percent to 1.37 million, pushing months’ supply to 3.8 from 4.6. Months’ supply for the existing single-family segment is very low by historical comparison (see bottom chart).
Robert Hughes

Robert Hughes joined AIER in 2013 following more than 25 years in economic and financial markets research on Wall Street. Bob was formerly the head of Global Equity Strategy for Brown Brothers Harriman, where he developed equity investment strategy combining top-down macro analysis with bottom-up fundamentals. Prior to BBH, Bob was a Senior Equity Strategist for State Street Global Markets, Senior Economic Strategist with Prudential Equity Group and Senior Economist and Financial Markets Analyst for Citicorp Investment Services. Bob has a MA in economics from Fordham University and a BS in business from Lehigh University.


