Business Conditions Monthly January 2024

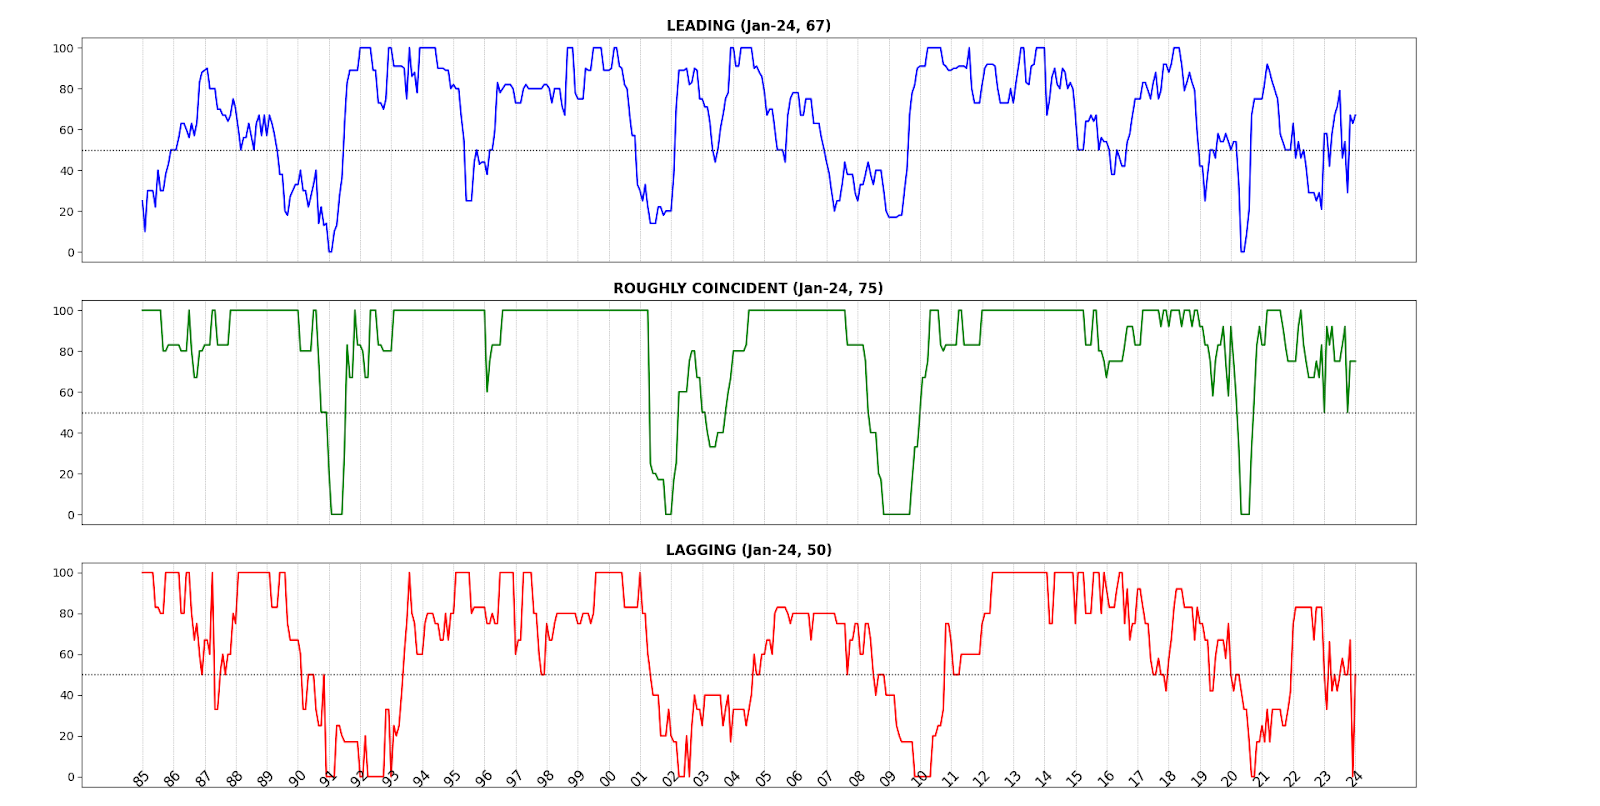
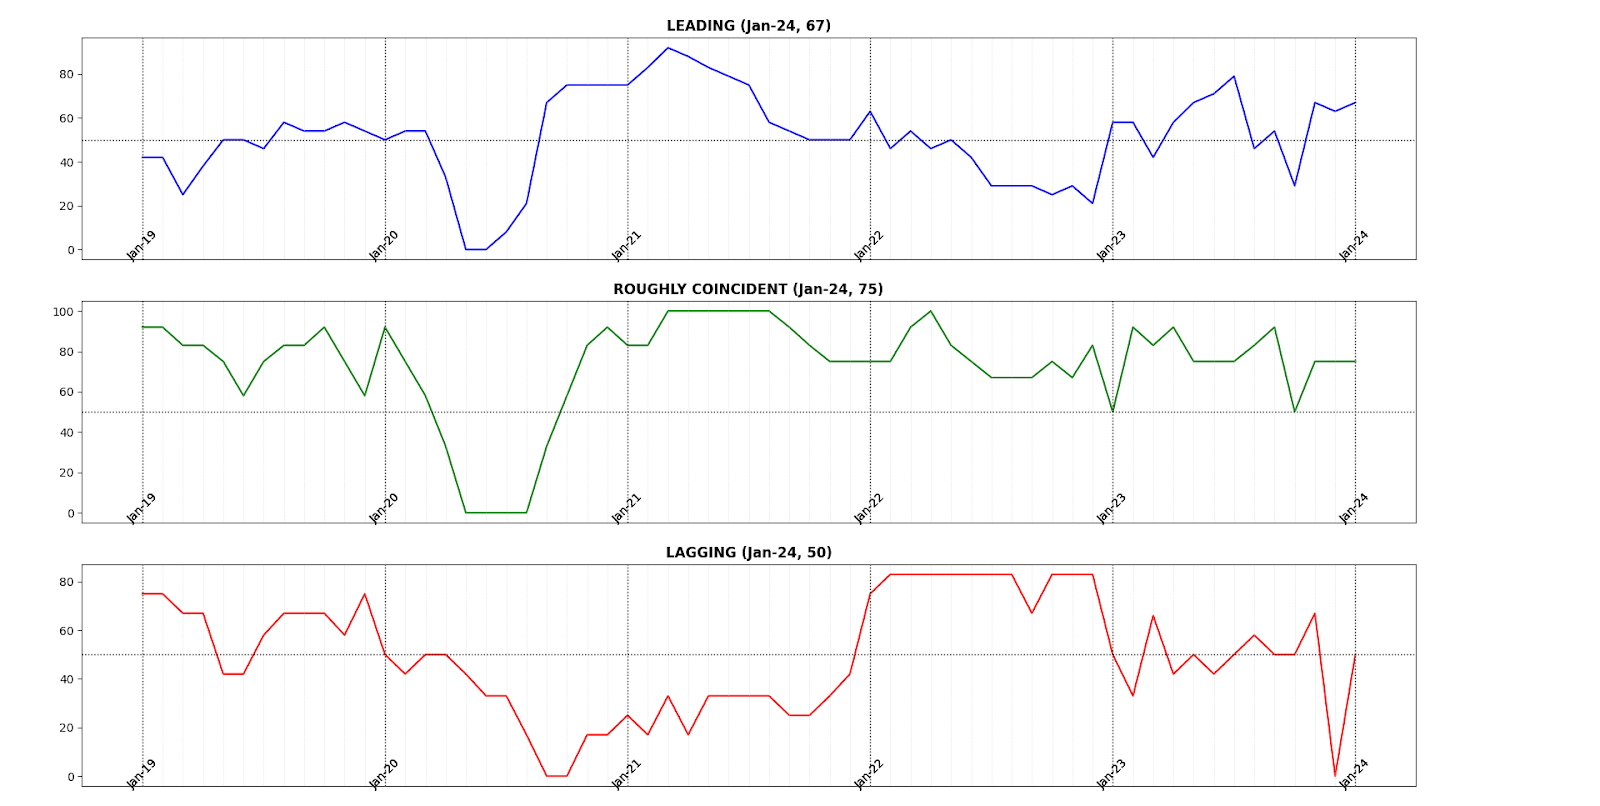
In January 2023, two of the AIER Business Conditions Monthly returned to the expansionary levels which characterized the last six to eight months. The Leading Indicator returned to its November 2023 level of 67 after dipping to 63, while the Roughly Coincident Indicator spent a third month at the 75. The Lagging Indicator, which plunged from 67 In November 2023 to 0 in December returned to 50, again exemplifying the high noise-to-signal ratio in post-pandemic economic data.
Leading Indicator (67)
Among the components of the Leading Indicator, seven rose, five declined, and two were neutral.
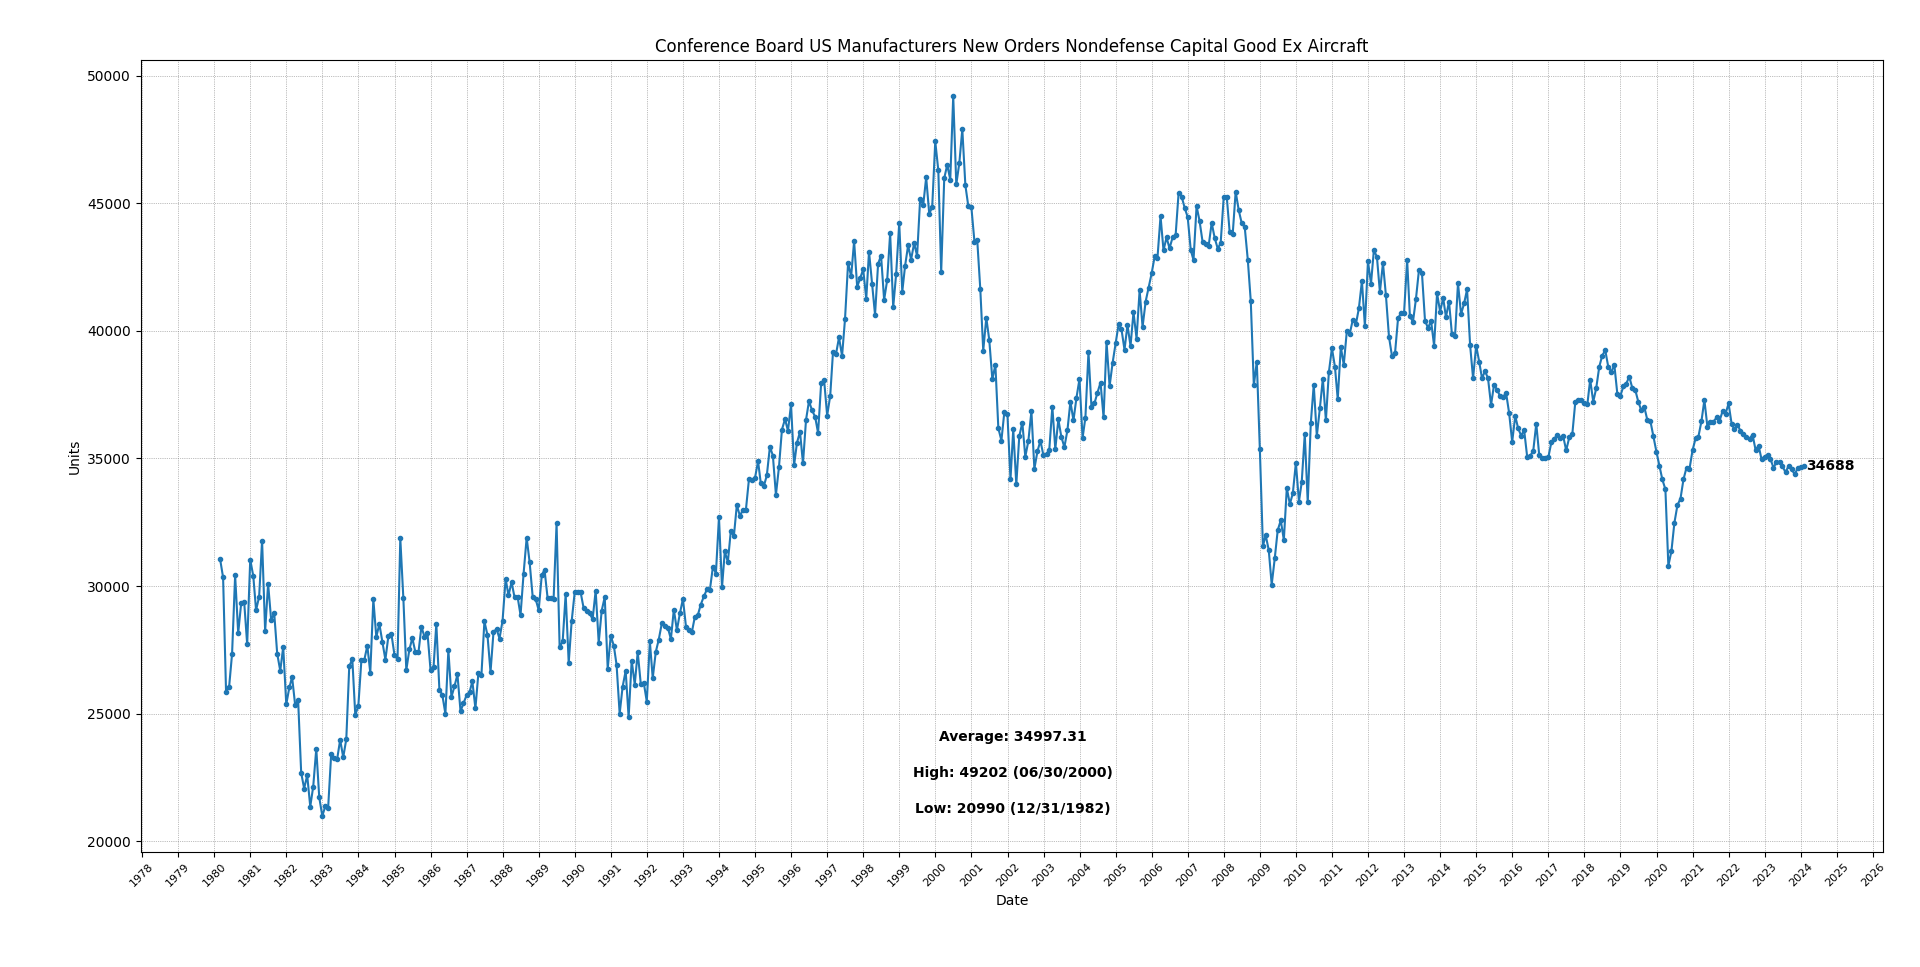
Rising were the University of Michigan Consumer Expectations Index (14.4 percent), United States Heavy Trucks Sales (10.5 percent), 1-to-10 year US Treasury spread (10.4 percent), Conference Board US Leading Index of Stock Prices (2.6 percent), Inventory/Sales Ratio: Total Business (0.7 percent), FINRA Customer Debit Balances in Margin Accounts (0.2 percent), and the Conference Board US Leading Index Manufacturing, New Orders, Consumer Goods and Materials (0.1 percent). The US Average Weekly Hours All Employees Manufacturing and Conference Board US Manufacturers New Orders Nondefense Capital Good Ex Aircraft were both neutral. Adjusted Retail and Food Service Sales fell (-1.1 percent), as did US New Privately Owned Housing Units Started by Structure (-5.9 percent) and US Initial Jobless Claims (-13.6 percent).
At 67, the Leading Indicator suggests continuing expansion, if moderately. It also did so during the spring and summer of 2023 before spending the fall in neutral and contractionary territory, rebounding in November.
Roughly Coincident (75) and Lagging Indicators (50)
The Conference Board Consumer Confidence Present Situation rose by 5.2 percent, as did its Coincident Personal Income Less Transfer Payments (0.2 percent), Coincident Manufacturing and Trade Sales (0.2 percent), and US Employees on Nonfarm Payrolls (0.1 percent). The US Labor Force Participation Rate was unchanged, while the Industrial Production index fell (-0.5 percent).
The Lagging Indicator had two rising, two falling, and one neutral component. The Conference Board US Lagging Avg Duration of Unemployment rose 6.7 percent as US Commercial Paper Placed Top 30 Day Yields rose 0.4 percent. The Conference Board US Lagging Commercial and Industrial Loans and the Census Bureau’s Private Construction Spending (Nonresidential) both slid -0.1 percent from December 2023 to January 2024. US CPI Urban Consumers Less Food and Energy was unchanged.
The Roughly Coincident Indicator has been the most consistent of the three Business Conditions Monthly indicators, remaining at an expansionary level of 75 or above throughout much of 2022 and all of 2023 with the exception of January and October 2023. The Lagging Indicator, having remained at largely neutral levels throughout 2023 before collapsing to zero in December 2023, is likely the most buffeted by continuing economic misalignments.
Discussion
The ongoing discourse surrounding the US economy has recently centered on the resilience and sustainability of consumer spending. Amidst a backdrop of escalating prices, rising interest rates, and diminishing post-pandemic savings, the vigor of consumer expenditure has been an ongoing surprise.
Yet in February 2024, headline retail sales witnessed a more subdued resurgence than anticipated, thought primarily to owe to a weather-induced uptick following January’s sales slump. Notably, sales growth was largely credited to demand for building materials and garden equipment. Elsewhere the consumption data showed only marginal improvement, reinforcing the notion that consumers are approaching the limits of their spending capacity amidst dwindling savings, apprehensions about borrowing amidst elevated interest rates, or an outright inability to access credit – as the popularity of Buy-Now-Pay-Later plans during the 2023 holiday season suggested. It thus appears that February’s retail sales figures signal the long awaited waning of spending momentum, particularly within the services sector, which aligns with the prognosis of a decelerated consumption growth trajectory ahead.
The underestimated resilience of consumption has relied on the interplay of the labor market’s recovery from pandemic policies, consumers’ propensity to tap into savings and credit, and elevated interest earnings. Nevertheless, these three pillars appear poised to transition into headwinds as 2024 draws on. Analyzing future consumer activity may employ two distinct analytical methodologies: a top-down or bottom-up approach. The top-down method assesses spending dynamics based on momentum and household wealth relative to income, whereas the bottom-up approach examines consumption as a product of wage growth, personal savings, and net interest impact. The top-down approach suggests a distinct but mild slowdown in consumption by year-end. The bottom-up framework focuses on the implications of rising unemployment and Federal Reserve rate cuts on wages and wage growth, personal savings, and interest income. When the Fed reduces rates – as it is continuing to project that it will do three times over the remainder of 2024 – consumers experience a decline in net interest income due to the faster decrease in interest versus borrowing costs. Simultaneously, increased unemployment and underemployment tend to prompt higher rates of saving. As a result, consumption is expected to decelerate from the rapid pace seen last year, but unless a significant negative economic event occurs, it is unlikely to plummet. In both scenarios, US consumer spending is likely to decline over the next two or three quarters, requiring sources of US economic growth (as measured by GDP) to come from elsewhere.
The long tail of pandemic disruptions are continuing to obscure the economic landscape, yet there are emerging trends that warrant attention, albeit often deep within reports featuring seemingly robust headline figures. Following a late-year and early-2024 slowdown, there are mixed indications of a continuing slowdown ahead: restaurant bookings, closely linked with credit card transactions, initially dipped during January’s cold spell but have since recovered. Yet, gasoline demand, which saw a decline in late January, has rebounded, and air passenger traffic has shown improvement in early March.
Truck demand, serving as a proxy for retail activity, experienced fluctuations since late December but has shown a stronger upward trend in March. Sentiment among box makers, another indicator, remains guarded, with expectations of flat first-quarter demand compared to a year earlier. The housing market remains sensitive to changes in mortgage rates, with a drop below 7 percent in early March prompting an increase in home purchase applications. Although iron and steel production saw a slight rise in February, industrial production fell well short of expectations in January due to cold weather impacting nondurable goods manufacturing and mining. The stabilization of oil rig numbers in late 2023 and early 2024, following a significant decline due to oil price drops and rising labor costs, is another noteworthy development. While jobless claims indicate minimal firing rates, continuing claims have remained above pre-pandemic averages since late September, indicating a challenging job market environment for the unemployed.
Small-business owners are experiencing a notable decline in optimism, driven by profit pressures arising from high labor costs and ongoing apprehensions about future conditions, particularly with respect to tax and regulatory policies in the wake of the upcoming November elections. On both sides, the signature economic points of either ratcheting up taxes on businesses or imposing double digit tariffs on foreign goods, are taking a toll on entrepreneurial sentiment. The NFIB Small Business Optimism index fell to 89.4 in February, below both the prior reading of 89.9 and the expected 90.5. Plans for job creation over the next three months dropped to 12 percent, the lowest since May 2020, with significant decreases in job openings observed across various sectors such as transportation, agriculture, retail, and services as compared to the same period in 2023. Despite a notable increase in job openings in the construction sector, more than half of small businesses report difficulty filling vacant positions. Additionally, actual sales declined, and a net -7 percent of owners plan to invest in inventory over the coming quarter. Company earnings are continuing to deteriorate alongside dampened expectations for general business conditions and compensation plans, which fell to their lowest level in three years (since March 2021). The proportion of owners raising average selling prices decreased to a net 21 percent, marking the lowest reading since January 2021. Overall, the majority of National Federation of Independent Business components evinced a downturn in February, reflecting the prevailing economic environment and persistent trends. Sentiment has remained consistently below its 50-year average of 98 since August 2021.
Recent data from both the Consumer Price Index and Producer Price Index indicate that core and “supercore” PCE inflation, closely monitored by the Fed, moderated only marginally in February. Nevertheless, and fulfilling the Nordhausian prognosis, Fed Chair Jerome Powell has expressed the possibility of the FOMC implementing rate cuts “well before” inflation reaches the 2-percent target with market implied policy rate markets strongly forecasting the first cut to come in June or July.
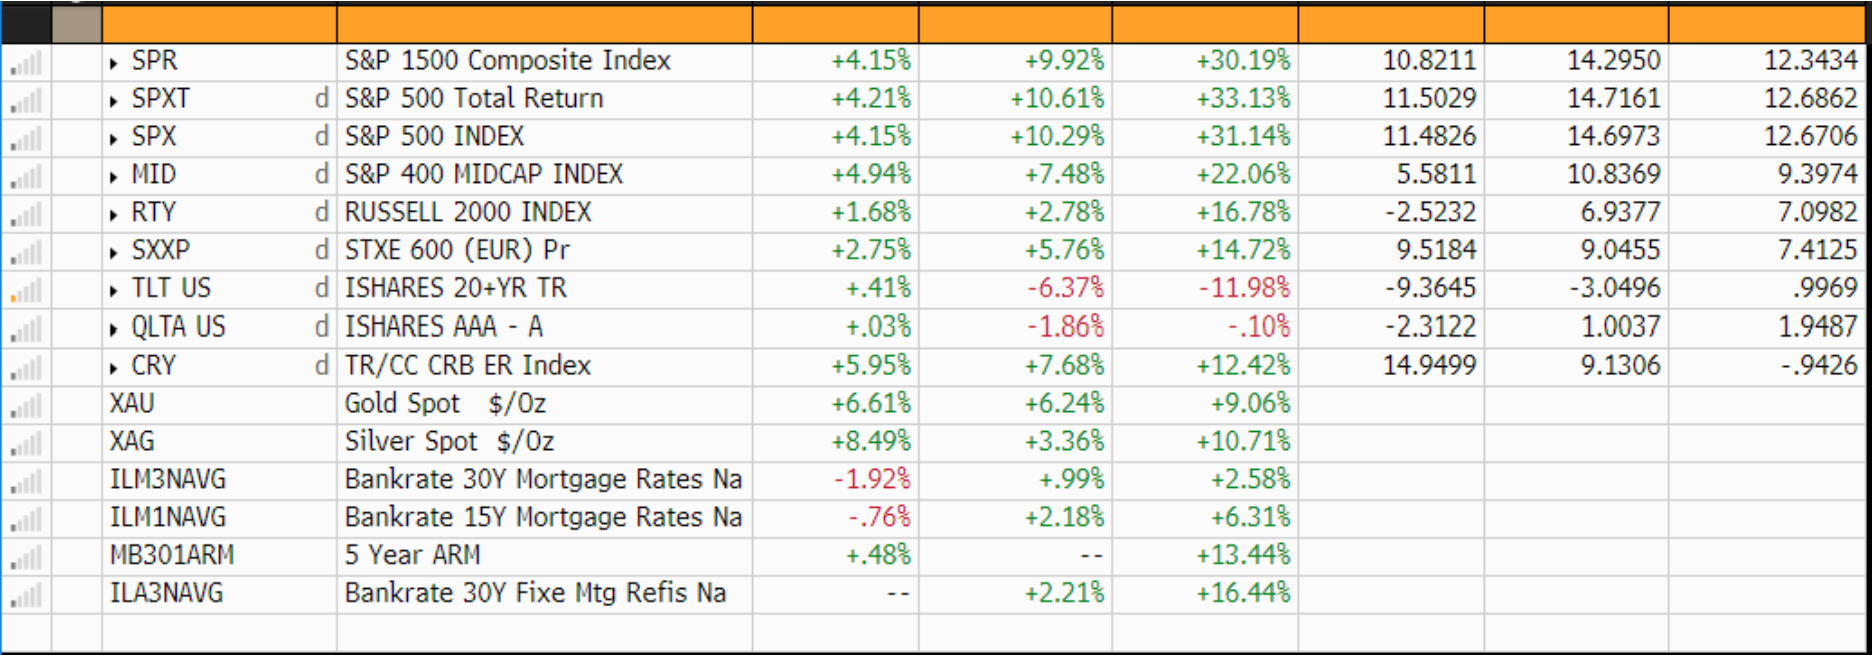
Only the price of gold, which recently hit an all time record price of $2,185.75 per ounce, appears appraised of the growing tenuousness of the US economy. In addition to a softening labor market and US consumer activity finally appearing to hit a wall, the potential for shocks of an endogenous or exogenous nature is elevated. (In the former category, the S&P 500 is up nearly 10 percent since the start of the year on extremely narrow breadth; in the latter, front-month West Texas Intermediate oil prices are currently trading for less than they did in the immediate aftermath of the October 7th attacks.) Increasing possibilities for political instability and civil unrest as the November elections draw nearer must also be taken into account. For these and related reasons, our forecast for 2024 remains characterized by an expectation of economic contraction.
LEADING INDICATORS


ROUGHLY COINCIDENT INDICATORS


LAGGING INDICATORS


CAPITAL MARKET PERFORMANCE