Household Net Worth Hits A Record While Debt Service Remains Low

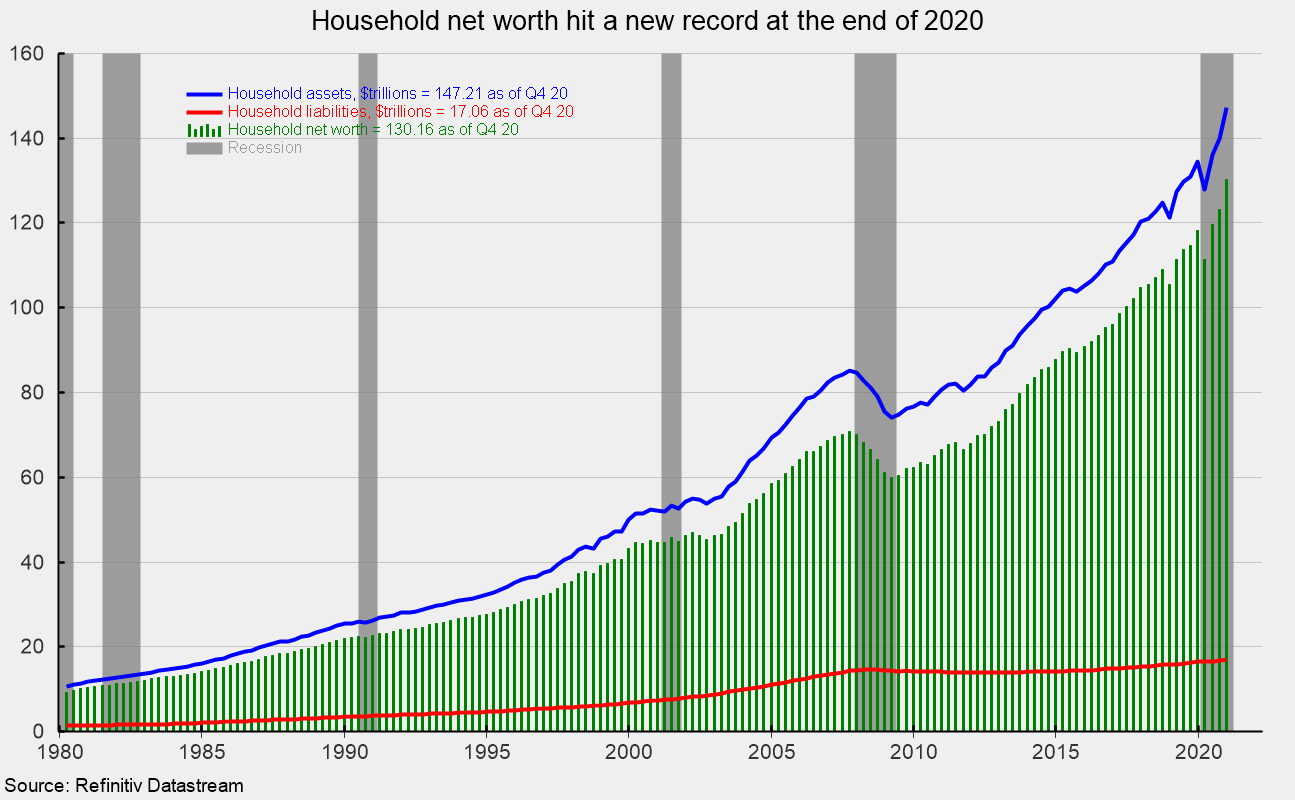
Despite the pandemic, restrictive government policies, and the worst economic contraction in history, household net worth rose again in the fourth quarter to a new record. Household net worth rose to $130.155 trillion, up 5.6 percent from the previous record of $123.229 trillion in the third quarter, and 10.1 percent from $118.220 trillion at the end of 2019 (see first chart). Total assets rose to $147.2 trillion while total household liabilities increased 1.8 percent or $297.3 billion, to $17.057 trillion (see first chart).
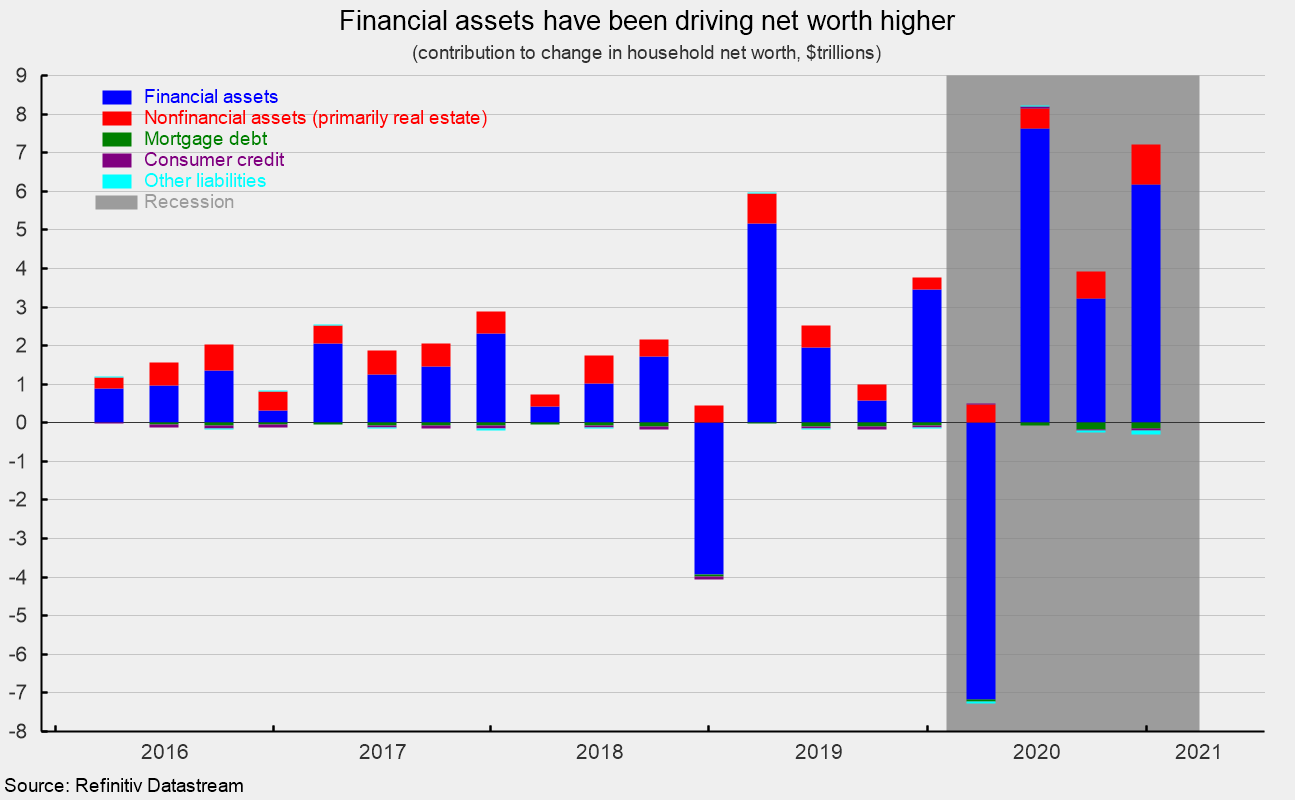
Total assets consisted of $104.6 trillion of financial assets and $42.6 trillion of nonfinancial assets. The gain in total assets was due to a 6.3 percent increase in financial assets which contributed $6.2 trillion to the increase in net worth (see second chart). Within financial assets, equities led with a 14.1 percent rise. Nonfinancial assets rose 2.5 percent, contributing $1.0 trillion to net worth (see second chart). Within nonfinancial assets, real estate led with a 2.6 percent rise. The change in total liabilities was led by a $148.9 billion, or 1.4 percent, increase in mortgage debt to $10.9 trillion, while consumer credit increased $44.5 billion or 1.1 percent to $4.2 trillion (see second chart).
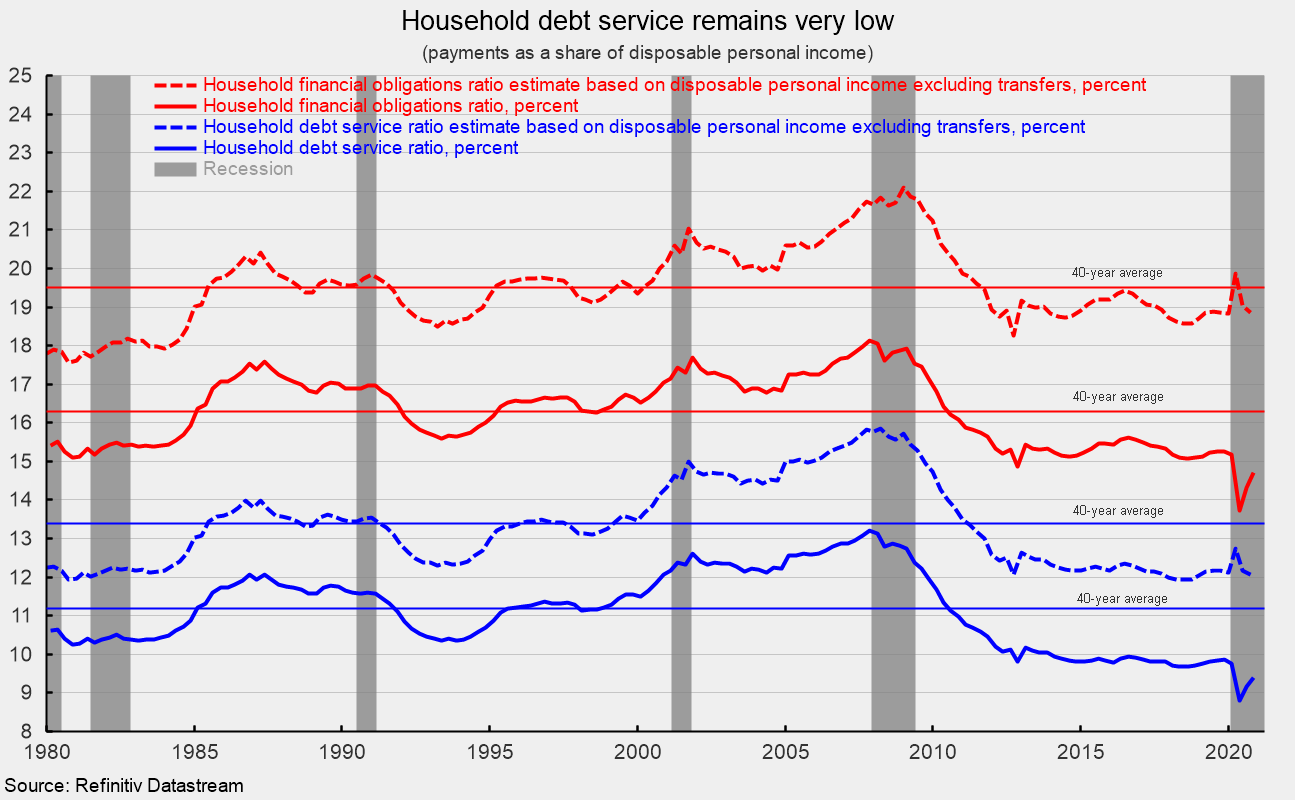
Two key measures suggest that household balance sheets are generally healthy. As of the fourth quarter, the financial obligations ratio (monthly payments for financial obligations as a share of disposable personal income) was 14.71 percent, up from 14.32 percent in the third quarter. Like many economic statistics, these numbers have been heavily distorted by the pandemic, lockdowns, and government payments. Excluding the government transfer payments, financial obligations would be 18.9 percent, down from 19.0 percent in the third quarter. Both measures remain well below their 40-year average through the end of 2019 (see third chart).
Household debt service (a narrower measure that includes just minimum monthly debt payments) came in at 9.7 percent for the fourth quarter, up from 9.2 percent. Excluding the government transfer payments, debt service comes in at 12.1 percent. Both of these measures are also well below their 40-year average (see third chart).
These data show that despite the damage done to the economy by the government lockdowns, in aggregate, household balance sheets are relatively strong. However, across the various cohorts of households, financial health varies widely. Some households have been severely impacted by lockdowns, particularly small business owners and low-wage workers in retail, travel, hospitality, and food services industries.
Robert Hughes

Robert Hughes joined AIER in 2013 following more than 25 years in economic and financial markets research on Wall Street. Bob was formerly the head of Global Equity Strategy for Brown Brothers Harriman, where he developed equity investment strategy combining top-down macro analysis with bottom-up fundamentals. Prior to BBH, Bob was a Senior Equity Strategist for State Street Global Markets, Senior Economic Strategist with Prudential Equity Group and Senior Economist and Financial Markets Analyst for Citicorp Investment Services. Bob has a MA in economics from Fordham University and a BS in business from Lehigh University.


