AIER’s Leading Indicators Index Improves in August but Remains Well Below Neutral

The historic plunge in economic activity resulting from the repressive lockdown policies implemented to slow the spread of Covid-19 has begun to reverse. However, inconsistent policies across industries and regions are contributing to very high levels of uncertainty, confusion, and risk aversion among consumers and businesses. Those conditions are producing wide-ranging recoveries across the economy, and ultimately represent a substantial lingering threat to broad economic recovery.
The progression of the outbreak as well as progress in developing an effective treatment and a vaccine continue to have mixed results. New daily cases and deaths have eased in many states but a lack of understanding of the disease as well as a plethora of misinformation represent roadblocks on the path to normalization. Development and distribution of a vaccine is proceeding but that process is slow and is likely to take a few more quarters. Consumers, businesses, and policymakers are adapting to the rapidly changing environment but not surprisingly, government policies still appear inconsistent, ineffective, or harmful. With a few months of data on the nascent rebound now available, winners and losers across the economy are becoming apparent. However, these early trends are still tentative and subject to changes in consumer or business behavior, government policies, and society’s understanding of the disease itself.
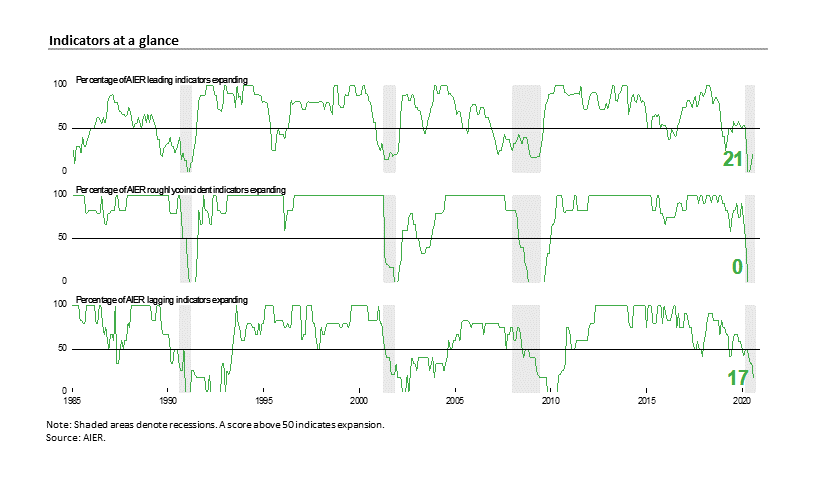
AIER Business Cycle Conditions indexes were mixed in August with the Leading Indicators index increasing slightly, the Roughly Coincident Indicators index unchanged for a fourth month and the Lagging Indicators index declining. All three indexes remain well below neutral (see chart). The latest results suggest the possibility of a rapid recovery continues to fall and that full recovery is likely to be more drawn out, uneven, and uncertain.
AIER Leading Indicators index rose slightly in August
The AIER Leading Indicators index rose to a reading of 21 (on a scale of 0 to 100) in August, up from 8 in July and two months at 0 in June and May. The back-to-back zeros were the first pair of bottom readings since January and February 1991. The last time the Leading Indicators index posted more than two months at the lower bound was a three-month run from April through June 1980. The index has never stayed at zero for more than three consecutive months.
Two leading indicators changed signals in August. The real stock price indicator improved from a negative trend to a neutral trend based on data through July (the latest data available). Furthermore, nominal stock prices posted gains in August, suggesting this indicator could show another improvement in the coming months if gains continue.
Real retail sales improved from a negative trend to a positive trend. The July retail sales report showed nominal retail spending rose to a record high despite continuing restrictions in many places. Debit balances in margin accounts remained in an uptrend.
The overall results among the 12 leading indicators show two indicators in uptrends, nine indicators still in downtrends, and one in a neutral trend.
The Roughly Coincident Indicators index remained at 0 in August, the fourth consecutive month at the lower bound. The last time the coincident indicators index spent multiple months at zero was in 2008-09 when the index spent a total of 11 consecutive months at the bottom. The index spent five months at zero in 1991 and four months there in 1981-82. While some of the underlying data for the Roughly Coincident Indicators posted gains in the most recent month or two, the trends remain negative. An additional month (or possibly more) of recovery may be needed before solid uptrends are established.
AIER’s Lagging Indicators index fell to 17 in August from 33 in July. Duration of unemployment fell from a positive trend last month to a negative trend in the most recent report. That change left just one indicator trending higher while five had unfavorable trends, and none were neutral.
Overall, extremely weak results continued for both the Leading Indicators index and the Roughly Coincident Indicators index suggesting that a rapid recovery from the historic policy-driven plunge in economic activity is unlikely. Some areas of the economy benefited from the initial push to reopen and posted sharp gains in May and June following massive drops in March and April. However, data for July and August indicate that the rebounds may be starting to falter in some areas. The outlook for the economy remains highly uncertain and full recovery to pre-pandemic conditions is likely many quarters away.
Winners…And Losers
The current U.S. recession is unlike any other in history. Never before have policymakers intentionally caused economic chaos and never before have activity and conditions among sectors and industries been so varied. As economies grow more complex, broad sweeping statements based on broad aggregate measures become less useful. That sentiment is even more relevant today.
While broad aggregates like gross domestic product show historic declines, there are areas and industries that are faring better than others. Among the key areas of the economy, consumer spending, housing, labor, and manufacturing, a more granular analysis of activity may provide a better understanding of emerging trends that could have a significant impact on the future path of the overall economy.
Retail Spending – several strong categories…
Retail spending hit new high in July, but gains were not consistent among the various categories of retailers. Retail sales and food-services spending in total posted a gain in July, rising 1.2 percent from the prior month following an 8.4 percent jump in June and an 18.3 percent record surge in May.
Excluding motor vehicle and gas categories, core retail sales and food services were up 1.5 percent in July after a 7.7 percent jump in June. The gains over the past three months have completely offset the declines from March and April, leaving the July tally for total retail sales and food services 2.7 percent above the July 2019 level while core retail sales and food services are 3.9 percent above year ago levels.
However, results across the various categories of retailers were mixed. Among the 13 categories of retailers within the retail sales report, seven are above their January 2020 level while six are below. Nonstore retail sales (which includes online retailers) rose 0.7 percent in July and is up 25.8 percent from July 2019. This category has been one of the most successful during the pandemic and lockdowns, with sales 23 percent above January 2020 levels. The switch to online spending has been going on for quite some time and the combination of lockdowns, regulations and safety concerns appear to be accelerating the trend. That trend has significant implications for retail and commercial real estate as well as transportation and logistics.
Home activities are surging under restrictions. Sporting-goods, hobby, musical-instrument, and bookstores saw a 5.0 percent decline in July but are still up 18.9 percent from a year ago and are 18 percent above January 2020. Food and beverage store sales posted a 0.2 percent rise for the month, leaving sales 12.8 percent above July 2019 and 11 percent above January 2020. Building materials, gardening equipment and supplies dealers sales had a 2.9 percent drop in July but are up 16.0 percent from a year ago and 7 percent from January. Health and personal care stores and general merchandise stores both had sales above year ago and January 2020 levels.
Motor vehicles and parts dealers’ sales fell 1.2 percent for the latest month leaving sales 7.0 percent higher than a year ago and 4 percent higher than January. Low interest rates and increased demand for private transportation options have helped vehicle sales stage a substantial recovery though unit sales remain below their pre-pandemic range.
…But several are still struggling
Categories that are below their January 2020 levels are generally retailers that depend heavily on the in-store experience, including clothing and accessory stores (up 5.7 percent in July but down 19.7 percent from a year ago and 21 percent below January 2020), and food services (up 5.0 percent in July but down 17.5 percent from a year ago and 20 percent below January). Electronics and appliance stores, furniture and home furnishings stores, and miscellaneous stores were all still below their January 2020 levels. Despite still being below their pre-pandemic sales levels, all six are above their April 2020 lows.
Gasoline stations sales were up 6.2 percent for the month but are down 14.8 percent for the year and 16 percent since January. Gasoline sales are caught in the crosswinds of less commuting demand, greater leisure demand, and volatile crude oil prices.
Housing – urbanites head for the suburbs
Like vehicles, housing is benefiting from low interest rates. Furthermore, increased demand for less dense housing is boosting some types of housing activity but hurting others. Existing-home sales surged in July, extending their sharp recovery. Sales of existing homes jumped 24.7 percent in July to a 5.86 million seasonally adjusted annual rate. Sales are now up 8.7 percent from a year ago and solidly in the 5 to 6 million range they had been in since 2015.
Sales in the market for existing single-family homes, which account for around 90 percent of total existing-home sales, rose 23.9 percent in July, coming in at a 5.28 million seasonally adjusted annual rate. From a year ago, sales are up 9.8 percent. The July pace is the fastest since December 2006.
Condo and co-op sales posted a 31.8 percent surge for the month, but were still just equal to the July 2019 pace. Sales came in at a 580,000 pace for the month versus 440,000 in June.
The total inventory of existing homes for sale fell 2.6 percent to 1.50 million in July, pushing the months’ supply (inventory times 12 divided by the annual selling rate) to 3.1 from 3.9 in June. For the single-family segment, the months’ supply also fell, to 3.0, tying the record low, from 3.8 in June, while the condo and co-op months’ supply fell to 4.1 from 5.3.
With demand up and restrictions on construction activity easing, total housing starts rose to a 1.50 million annual rate from a 1.22 million pace in June, a 22.6 percent increase. The July pace was the fourth highest since 2006 at the end of the housing bubble.
The dominant single-family segment, which accounts for about 60 percent of new home construction, rose 8.2 percent for the month to a rate of 940,000. Starts of multifamily structures with five or more units surged 56.7 percent to 547,000. From a year ago, total starts are up 23.4 percent with single-family starts up 7.4 percent and multifamily starts up 67.8 percent.
For housing permits, total permits rose 18.8 percent to 1.50 million from 1.26 million in June. Total permits are 9.4 percent above the July 2019 level. Single-family permits were up 17.0 percent at 983,000 in July while permits for two- to four-family units gained 12.5 percent and permits for five or more units increased 23.5 percent to 467,000. Combined, multifamily permits were issued at a 512,000 pace versus 418,000 in June. Permits for single-family structures are up 15.5 percent from a year ago while permits for two- to four-family structures are down 2.2 percent and permits for structures with five or more units are down 0.4 percent over the past year.
On the downside, dense, traditionally expensive markets such as New York City and San Francisco are experiencing sharp declines in rents and occupancy.
Future demand for less dense housing versus urban housing remains uncertain. Housing is one of the areas that may face structural changes if buyers and renters develop permanent shifts to their housing preferences. If it is believed that higher density living represents a higher risk in future pandemics, then there may be sustained increased demand for less dense suburban and rural housing. This trend could be sustained or boosted if businesses implement permanent work from home policies, to make employees happy but also to cut down on high-cost commercial real estate, especially in high-density, high-cost cities.
Labor – a partial rebound but damage has been massive
U.S. nonfarm payrolls posted a fourth monthly gain in August, adding 1.4 million jobs following a 1.7 million rise in July, a 4.8 million surge in June, and a 2.7 million gain in May. However, the four-month total gain of 10.6 million is far from offsetting the 22.2 million loss in March and April; payrolls remain well below the February peak.
The report suggests that the labor market recovery is continuing as restrictive government policies are lifted. However, the slowing pace of gain sustains concerns that a sizable portion of the losses may be very slow to return or may not return at all.
The total number of officially unemployed fell to 13.6 million in August, a drop of 2.8 million from 16.3 million in July and 9.5 million below the massive 23.1 million in April. The number of officially unemployed in February was just 5.8 million.
The unemployment rate fell to 8.4 percent from 10.2 percent in July while the participation rate ticked up to 61.7 percent from 61.4 percent. The participation rate was at a cycle high of 63.4 percent in January 2020 and fell to a low of 60.2 in April during the lockdowns.
The underemployed rate, referred to as the U-6 rate, fell from 16.5 percent in July to 14.2 in August; the peak was 22.8 percent in April.
Private payrolls added 1.0 million jobs in August following a gain of 1.5 million in July. Private services added 984,000 while goods-producing industries gained 43,000. For private service-producing industries, the gains were led by a 249,000 increase in retail followed by professional and business services which added 197,000, leisure and hospitality with a 174,000 gain, and health care and social-assistance industries with a 90,000 increase. Within the 43,000 gain in goods-producing industries, nondurable-goods manufacturing rose by 27,000, construction added 16,000 jobs, durable-goods manufacturing increased by 2,000, while mining and logging industries lost 2,000 jobs. Despite the gains over the last four months, every industry had fewer employees in August than in February. The net losses range from a 1.3 percent drop in utilities workers to a devastating 25 percent plunge in leisure and hospitality.
The government sector added 344,000 employees in August; however, most were related to hiring for the 2020 census.
Manufacturing – picking up but challenges remain
Industrial production rose 3.0 percent in July following a surge of 5.7 percent in June and a 0.9 percent gain in May. However, the three consecutive months of gains were not enough to overcome the back-to-back declines of 4.3 percent and 12.8 percent in March and April, respectively. Over the past year, industrial production is down 8.2 percent and 8.3 percent below the pre-pandemic level in February.
Manufacturing output, which accounts for about 75 percent of total industrial production, rose 3.4 percent after a monthly record gain of 7.4 in June and an increase of 3.8 percent in May. The three gains follow declines of 5.0 percent and 16.0 percent in March and April. The three consecutive gains still leave manufacturing output 7.7 percent below year-ago levels. With the manufacturing output index at 96.5 for July, output is about 8 percent below the 2018-2019 average index level.
The gains in the manufacturing sector in July were widespread across nearly all major market and industry groups. Measured by market segment, consumer-goods production was up 4.6 percent in July, with consumer durables rising 14.6 percent and consumer nondurables gaining 2.0 percent. Consumer durable-goods production was led by a 27.9 percent jump in automotive products. Business-equipment production increased 5.0 percent in July while construction supplies rose 0.4 percent for the month. Materials production (about 46 percent of industrial activity) increased 2.2 percent for the month. Despite the gains in July, nearly every major segment and industry shows a decline from a year ago.
Total industrial utilization rose to 70.6 percent in July from 68.5 percent in June. That is well below the long-term (1972-2019) average utilization of 79.8 percent. Manufacturing utilization rose 2.3 percentage points to 69.2 percent, well below the long-term average of 78.2 percent and below the 2018-2019 average of 76.1 percent. July data suggest that while manufacturing output is recovering, output and utilization remain weak and it may take substantial time before manufacturing returns to pre-pandemic levels.
The Institute for Supply Management’s Manufacturing Purchasing Managers’ Index rose again in August, posting a 56.0 percent reading for the month, up from 54.2 percent in July. The latest result is the third consecutive reading above the neutral 50 threshold and fourth consecutive month of improvement since hitting a low of 41.5 in April. Overall, the report notes, “The PMI signaled a continued rebuilding of economic activity in August and reached its highest level of expansion since November 2018, when the index registered 58.8 percent.”
Among the key components, the New Orders Index came in at 67.6 percent, up from 61.5 percent in July, and the highest result since January 2004. Fifteen of eighteen industries in the survey reported growth in new orders in August. The New Export Orders Index came in at 53.3 percent in August, up 2.9 percentage points from a 50.4 percent result in July. The Backlog-of-Orders Index came in at 54.6 percent in August, up from 51.8 percent in the prior month.
The Production Index registered a 63.3 percent result in August, up from 62.1 percent in July and the highest reading since January 2018. Fifteen industries reported growth in the latest month, including: wood products; primary metals; chemical products; plastics and rubber products; nonmetallic mineral products; transportation equipment; textile mills; machinery; food, beverage and tobacco products; fabricated metal products; petroleum and coal products; electrical equipment, appliances and components; miscellaneous manufacturing; computer and electronic products; and paper products.
The Supplier Deliveries Index, a measure of delivery times from suppliers to manufacturers, rose to 58.2 percent from 55.8 percent in July. Slower supplier deliveries are usually consistent with stronger manufacturing activity. However, the slower deliveries in recent months have been more a result of supply chain and logistical constraints. According to the report, “The Supplier Deliveries Index now better reflects supplier’s difficulty in maintaining delivery rates due to factory labor safety issues and transportation difficulties.”
Robert Hughes

Robert Hughes joined AIER in 2013 following more than 25 years in economic and financial markets research on Wall Street. Bob was formerly the head of Global Equity Strategy for Brown Brothers Harriman, where he developed equity investment strategy combining top-down macro analysis with bottom-up fundamentals. Prior to BBH, Bob was a Senior Equity Strategist for State Street Global Markets, Senior Economic Strategist with Prudential Equity Group and Senior Economist and Financial Markets Analyst for Citicorp Investment Services. Bob has a MA in economics from Fordham University and a BS in business from Lehigh University.


