Light-Vehicle Sales Ticked Down in October

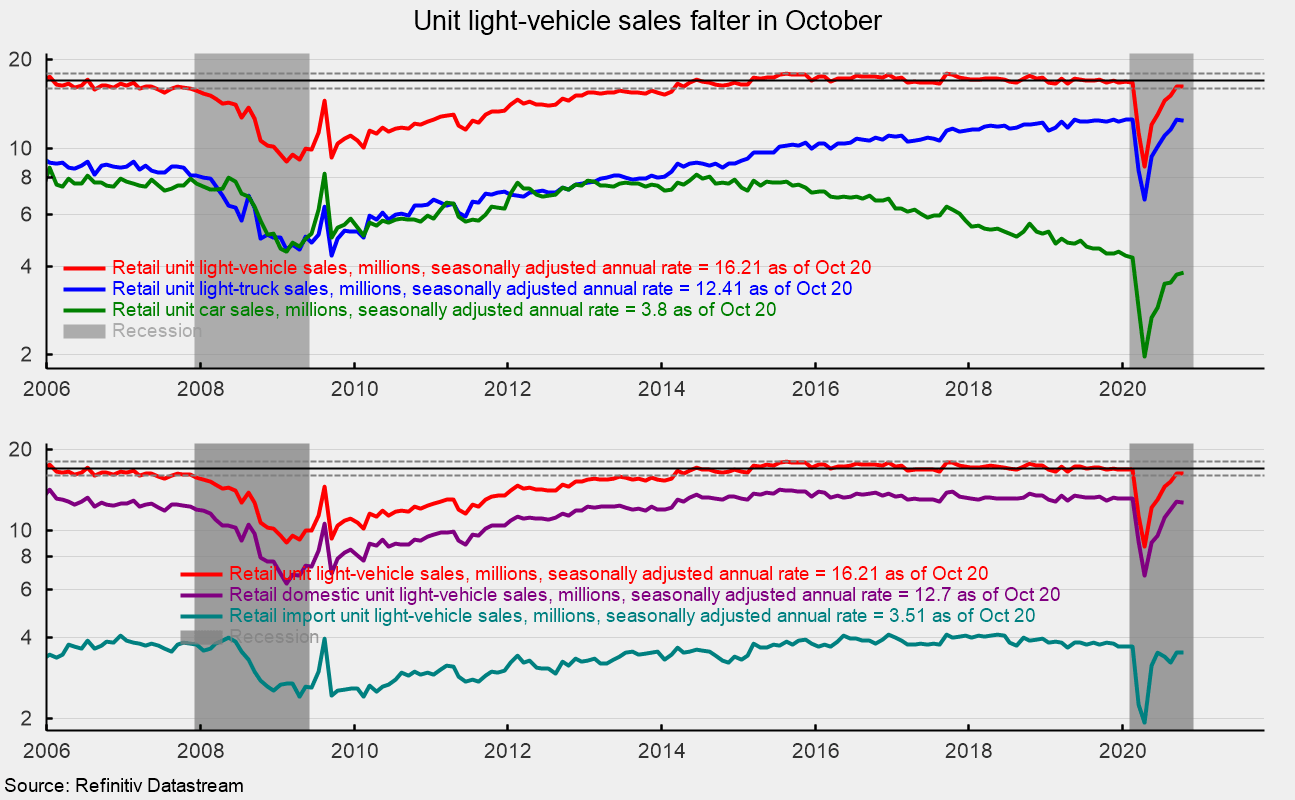
Sales of light vehicles totaled 16.2 million at an annual rate in October, slightly below the 16.3 million pace in September but the second month in a row back in the 16 to 18 million range following plunges in March and April (see top chart). The pace of sales in April was the lowest on record since this data series began in 1976 and follows a run of 72 months in the 16 to 18 million range from March 2014 through February 2020.
For the month of October, light-truck sales totaled 12.4 million at an annual rate versus a 12.6 million rate in September but well ahead of the 6.7 million rate in April. Car sales posted a modest gain, rising to a 3.8 annual rate versus 3.7 in September and 2.0 in April (see top chart).
The light-truck share stood at 76.5 percent for October, below the 77.9 percent record high in May, but still completely dominating the car share of 23.5 percent. The dominant share of light-trucks continues a long-term trend. As recently as February 2013, the split between cars and light-trucks (SUVs and pick-up trucks) was about even, with both segments selling about 7.8 million at an annual rate. Breaking down sales by origin of assembly, sales of domestic vehicles fell to 12.7 million units versus 12.8 million in September while imports were essentially unchanged at 3.5 million (see bottom chart).
Robert Hughes

Robert Hughes joined AIER in 2013 following more than 25 years in economic and financial markets research on Wall Street. Bob was formerly the head of Global Equity Strategy for Brown Brothers Harriman, where he developed equity investment strategy combining top-down macro analysis with bottom-up fundamentals. Prior to BBH, Bob was a Senior Equity Strategist for State Street Global Markets, Senior Economic Strategist with Prudential Equity Group and Senior Economist and Financial Markets Analyst for Citicorp Investment Services. Bob has a MA in economics from Fordham University and a BS in business from Lehigh University.


