Income and Spending Gains Suggest Fourth-Quarter Growth off to a Strong Start

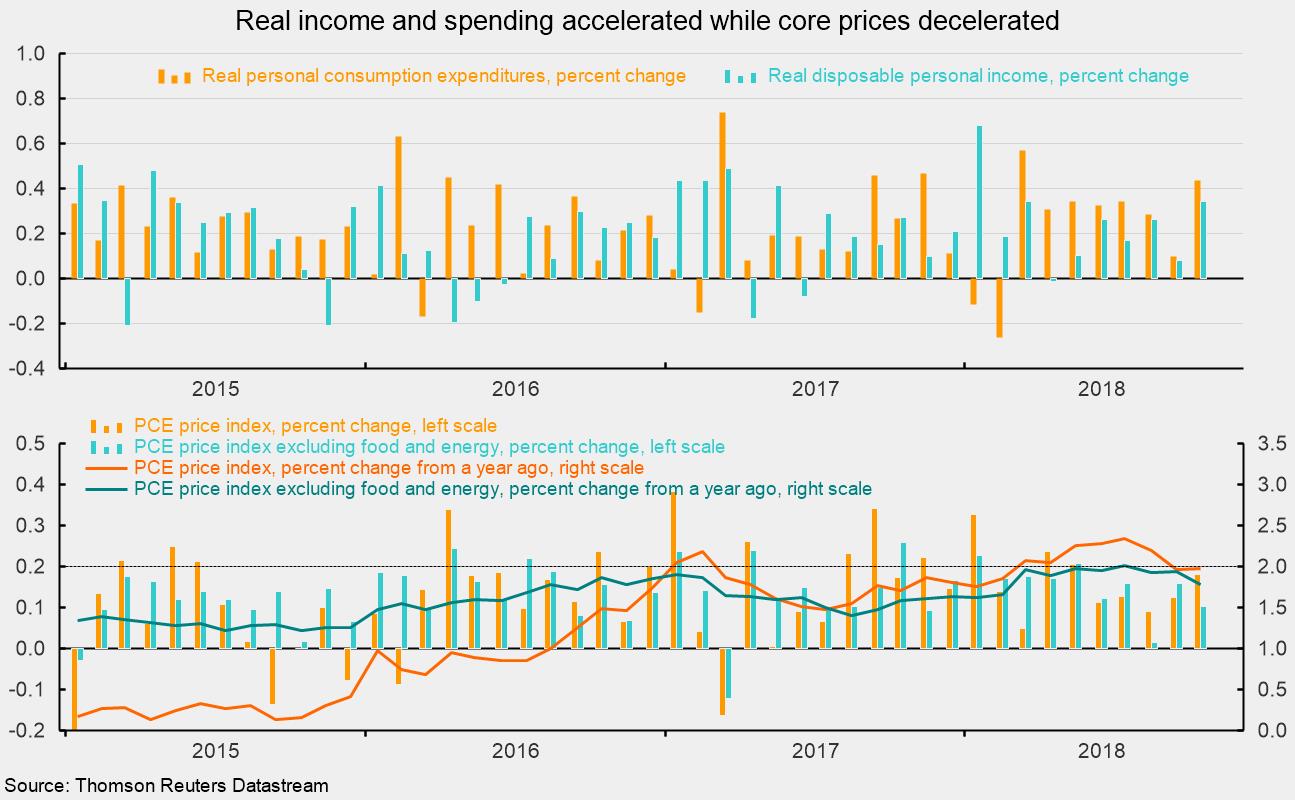
Personal income rose 0.5 percent in October, according to data from the Bureau of Economic Analysis. The gain in personal income was supported by a 0.3 percent increase in wages and salaries. Wages and salaries account for about half of personal income. Supplements to wages and salaries (primarily employer contributions to pension and insurance funds and government social-insurance programs) account for another 12 percent of personal income and posted a 0.2 percent rise in October. Proprietors’ income surged 1.6 percent for the month following a 0.8 percent decline while income on assets (interest and dividends) increased 0.4 percent. Personal tax payments rose 0.2 percent, leaving disposable income with a gain of 0.5 percent. Adjusting for price changes, real disposable income rose 0.3 percent in October, up from a 0.1 percent rise in September (see top chart).
On the spending side, total personal consumption expenditures (PCE) rose 0.6 percent in October. Among the components, durable goods rose 0.5 percent while nondurable-goods spending rose by 0.6 percent. Spending on services increased 0.7 percent for the month. After adjusting for price changes, real PCE increased 0.4 percent (see top chart) as a 0.4 percent gain in real durable-goods spending was accompanied by a 0.3 percent gain in real nondurable-goods spending and a 0.5 percent rise in real services spending. The personal savings rate, which was revised sharply higher in the benchmark NIPA revisions released earlier this year, dropped to 6.2 percent of disposable income from 6.3 percent last month. A more comprehensive measure of savings is available in the quarterly flow-of-funds data from the Federal Reserve. That measure has typically shown a higher savings rate compared to the measure in the monthly personal-income release.
The price indexes from the report on personal income and spending are the primary measures followed by the Federal Reserve. The total PCE price index increased 0.2 percent in October as durable-goods prices rose 0.1 percent, nondurable-goods prices rose 0.3 percent, and services prices increased 0.2 percent. The PCE price index excluding food and energy rose 0.1 percent for the month, down from a 0.2 percent increase in the prior month (see bottom chart).
Over the past year, the PCE price index is up 2.0 percent, down from the 2.3 percent recorded in May through July (see bottom chart). The core PCE index, which excludes food and energy prices, is up 1.8 percent from a year ago. That measure has been running at or below 2 percent since 2012.
Overall, gains in disposable personal income should provide support for future increases in personal consumption. Healthy incomes, solid balance sheets, a tight labor market, and high levels of consumer confidence all suggest the outlook for consumers remains favorable. The data suggest the Fed is unlikely to significantly alter the current slow pace of policy normalization. Together, these factors support a positive outlook for the economy with a low probability of recession over the next several months and quarters.
Robert Hughes

Robert Hughes joined AIER in 2013 following more than 25 years in economic and financial markets research on Wall Street. Bob was formerly the head of Global Equity Strategy for Brown Brothers Harriman, where he developed equity investment strategy combining top-down macro analysis with bottom-up fundamentals. Prior to BBH, Bob was a Senior Equity Strategist for State Street Global Markets, Senior Economic Strategist with Prudential Equity Group and Senior Economist and Financial Markets Analyst for Citicorp Investment Services. Bob has a MA in economics from Fordham University and a BS in business from Lehigh University.


