Global Well-being Inequality Is Falling!


In the past decade, there have been multiple books – by Johan Norberg, Steven Pinker, Hans Rosling among many others – arguing that there are important reasons to be optimistic for humanity. Trends are looking good! Poverty is falling, malnutrition is plummeting, life expectancy is increasing, schooling rates are surging and the share of the world population living under democratic institutions has been going in the right direction. Even many environmental indicators that, given media discussion, one would believe are deteriorating are actually improving (e.g., deaths from indoor and outdoor air pollution, forest cover, biodiversity in rich countries). One optimistic book, by Indur Goklany, summarized these trends pithily in its title: The Improving State of the World: Why We’re Living Longer, Healthier, More Comfortable Lives on a Cleaner Planet.
There is, however, one problem with all these works. They do not tell us clearly if well-being is improving for everyone. More importantly, they do not tell us clearly if the improvements are being enjoyed by those who need them the most – the poorest in the world. Indeed, one frequently reiterated criticism is that these works tend to eschew implications associated with inequality.
In a recent study with Chelsea Follett of the Cato Institute, I set out to correct this lacuna. Chelsea and I constructed the Human Progress Index (HPI), which amalgamates eight important indicators of well-being from 1990 to 2018: infant mortality, life expectancy, nutrition, deaths from outdoor air pollution, schooling, political liberty, internet access and GDP per capita.
Each of these measures is tied to a dimension of living standards broadly defined. Simply put, higher living standards are achieved when one has more effective possibilities to choose from. Higher incomes make it easier to buy new goods, invest in skills or save for retirement. Better health means one is not crippled by debilitating diseases. Better schooling means one is better able to find out what are the available options to him. Together, we call these “human progress,” which is why the HPI has the name we gave it.
The virtue of the HPI is that it mixes all of these different indicators into a single measure for all available countries. Unsurprisingly, given the flurry of books mentioned above, the HPI increased massively, as its value in 2018 was 42 percent above that of 1990.
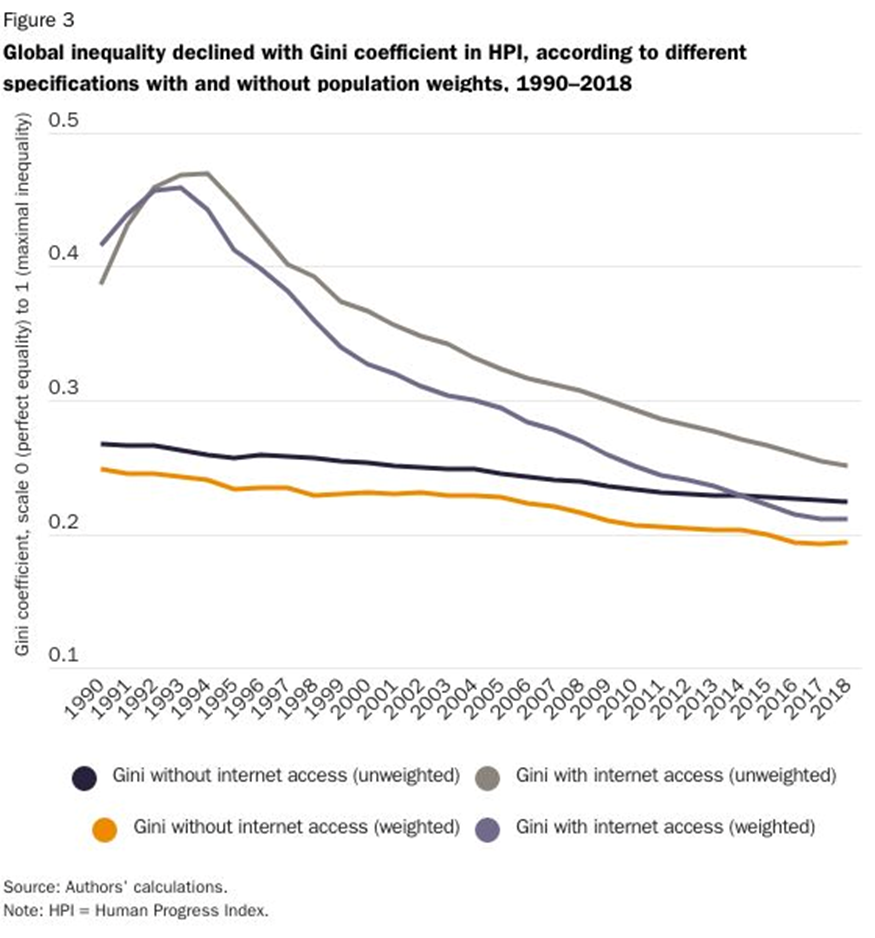
But what does that say about inequality? The virtue of having a single number for wellbeing for living is that it makes it easier to calculate measures of inequality. When we take this extra step, we find the graph that appears below where the “Gini coefficient” is depicted. That coefficient is the measure of inequality that stands between 0 and 1 where the former means perfect equality and the latter means perfect inequality (i.e., everyone except one person is poor and that remaining person has everything). As such, one should want to see those lines fall – as they clearly do. Regardless of whether we include some components – such as internet access – the trend is that inequality in HPI between countries has been falling steadily since the 1990s. Overall, inequality in human progress fell between 16 and 35 percent since 1990.
As such, the optimists, who are often derided, are not only generally correct, they understate the normative strength of their case. It is not just that the world is getting better, it is getting better for those who need it most.
Vincent Geloso

Vincent Geloso, senior fellow at AIER, is an assistant professor of economics at George Mason University. He obtained a PhD in Economic History from the London School of Economics.
Follow him on Twitter @VincentGeloso