AIER’s Leading Indicators Index Takes A Small Step Up in July

The policy-induced economic coma implemented to fight the spread of COVID-19 resulted in a historic plunge in economic activity in the second quarter. Reopening has allowed some partial rebounds in some areas of the economy but has also coincided with a resurgence of new cases and deaths attributed to COVID-19. The potential for uncertainty, confusion, and risk aversion among consumers and businesses along with the renewed shutdown efforts in some areas put the germinating recovery at great risk.
Developments in three areas remain critical to the medium-term path for the economy. First, the progress of the outbreak as well as progress in developing an effective treatment and a vaccine have had mixed results over the past month. Record new daily cases and deaths have eased slightly but are a setback on the path to normalization. Furthermore, development of a vaccine is proceeding but that process is slow and is likely to take several more quarters. Second, responses by consumers, businesses, and policymakers to the rapidly changing environment have been detrimental to economic activity. Consumer sentiment remains mixed while some businesses continue to lay off workers as others file for bankruptcy, and policymakers contemplate reimplementation of restrictions. Third, many areas of the economy benefited from the initial push to reopen, posting sharp gains following massive declines. However, the rebounds are starting to falter in some areas and the outlook across the economy remains highly uncertain.
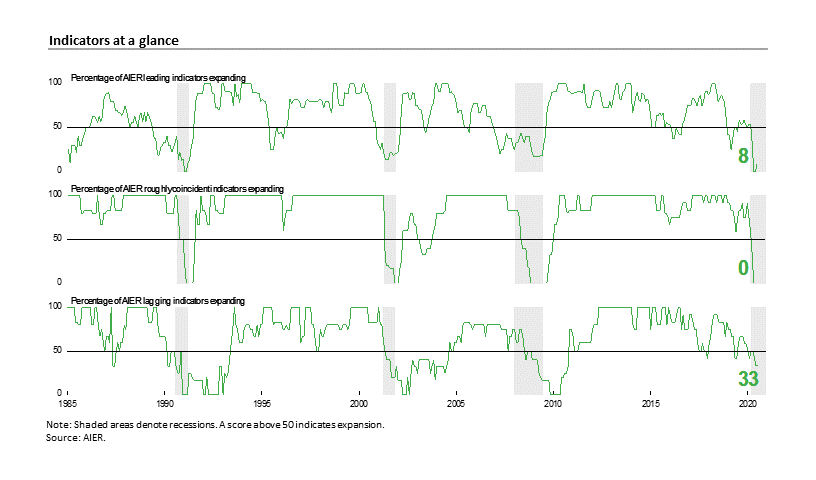
For the AIER Business Cycle Conditions indexes, results for July remain very weak. The Leading Indicators index increased slightly to a reading of 8 in July. The Roughly Coincident Indicators index held at 0 for a third month while the Lagging Indicators index remained at a cycle-low 33 for a second month (see chart). The latest results suggest the possibility of a rapid recovery is diminishing quickly and that full recovery is likely to be more drawn out, uneven, and uncertain.
AIER Leading Indicators index rose slightly in July
The AIER Leading Indicators index rose to a reading of 8 (on a scale of 0 to 100) in July following two months at 0. The back-to-back zeros in May and June were the first pair of bottom readings since January and February 1991. The last time the Leading Indicators index posted more than two months at the lower bound was a three-month run from April through June 1980. The index has never stayed at zero for more than three consecutive months.
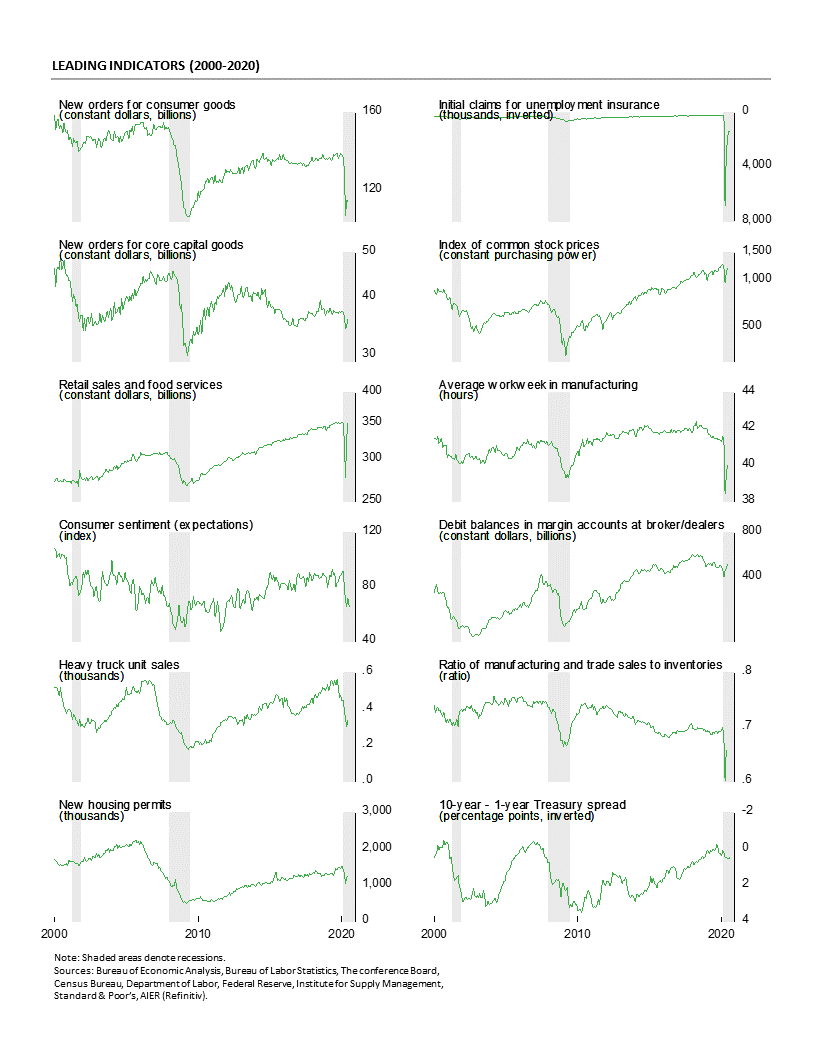
The one indicator to change in the July update was debit balances in margin accounts, improving from a negative trend in June to a positive trend in July. The improvement suggests investors are willing to take on more risk. The real stock price indicator remained in a negative trend through June (the latest data available). However, nominal stock prices posted gains in July, suggesting this indicator may show improvement in next month’s update.
With just the one indicator showing improvement in the July update, the results show 11 of the leading indicators still in a downtrend, one in an uptrend, and none are neutral.
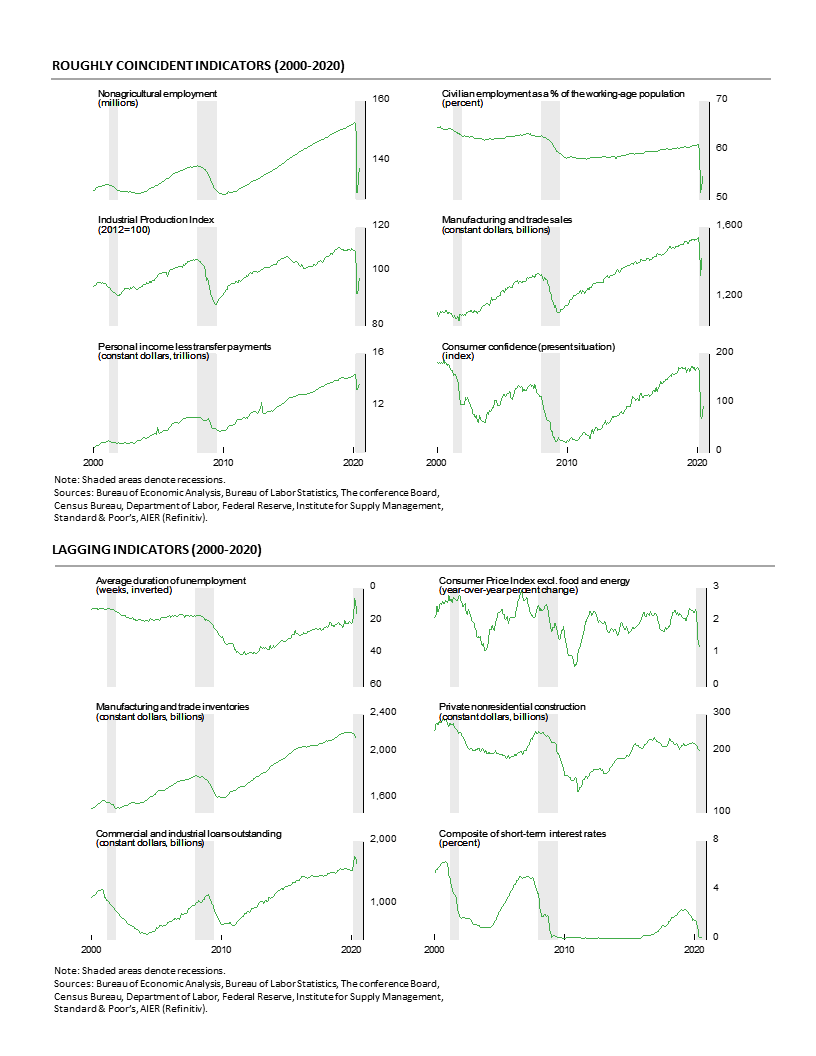
The Roughly Coincident Indicators index remained at 0 in July. The last time the coincident indicators index spent multiple months at zero was in 2008-09 when the index spent a total of 11 consecutive months at the bottom. The index spent five months at zero in 1991 and four months there in 1981-82. While some of the underlying data for the Roughly Coincident Indicators posted gains in the most recent month or two, the trends remain negative. An additional month (or possibly more) of recovery may be needed before solid uptrends are established.
AIER’s Lagging Indicators index held at 33 in July. None of the six individual indicators changed in July, leaving two indicators trending higher while four had unfavorable trends, and none were neutral.
Overall, the extremely weak results for both the Leading Indicators index and the Roughly Coincident Indicators index suggest that the probability of a rapid recovery is fading quickly. Many areas of the economy benefited from the initial push to reopen and posted sharp gains in May and June following massive drops in March and April. However, data for July indicate that the rebounds may be starting to falter in some areas. Those missteps suggest the outlook across the economy remains highly uncertain and that full recovery is likely many quarters away.
U.S. Economy Posts Record Decline During Lockdowns
Real gross domestic product plunged at a historic 32.9 percent annualized rate in the second quarter, down sharply from a severe -5.0 percent pace of decline in the first quarter. Over the past four quarters, real gross domestic product is down 9.5 percent, the worst year-over-year on record. On a nominal basis, gross domestic product tumbled 34.3 percent in the second quarter, putting the change from a year ago at -9.0 percent.
The historic plunge in the second quarter was expected as the outbreak of COVID-19 and government responses including shelter-in-place orders for individuals and the shutdown of nonessential businesses crushed the labor market and most economic activity.
Declines were widespread across the different areas of the economy. Real consumer spending declined sharply in the second quarter, falling at a 34.6 percent pace compared to a -6.9 percent rate in the first quarter. The decline was the result of drops in spending on durable-goods (down 1.4 percent) nondurable-goods (-15.9 percent), and services (-43.5 percent, see second chart). Among the few bright spots, spending on recreational goods and vehicles rose at a 40.5 percent pace while motor vehicles and parts spending rose at a 5.5 percent annual rate. Notable weakness came from recreation services (-93.5 percent annualized), transportation services (-83.9 percent), food services and accommodations (-81.2 percent), and the catch-all other services (-59.1 percent).
Business fixed investment fell at a 27.0 percent annualized rate in the second quarter of 2020. That decline was led by a 37.7 percent fall in spending on equipment while spending on structures fell 34.9 percent and Intellectual-property investment fell at a 7.2 percent pace.
Residential investment, or housing, dropped at a 38.7 percent annual rate in the second quarter compared to a 19.0 percent gain in the prior quarter. Housing has shown some resilience in the current environment as extremely low interest rates combined with the desire by some people to move away from virus epicenters created some demand.
Businesses liquidated inventory at a $315.5 billion annual rate (in real terms) in the second quarter, subtracting 3.98 percentage points from first-quarter growth after subtracting 1.34 percentage points in the prior quarter. Inventory liquidation has reduced real gross domestic product for five consecutive quarters.
Exports declined at a 64.1 percent pace, subtracting 9.38 percentage points, while imports declined at a 53.4 percent rate. Since imports count as a negative in the calculation of gross domestic product, a drop in imports is a positive for GDP growth, adding 10.06 percentage points. Net trade, as used in the calculation of gross domestic product, added 0.68 percentage points to overall growth.
Government spending rose at a 2.7 percent annualized rate in the second quarter compared to a 1.3 percent gain in the first quarter, contributing 0.82 percentage points to growth versus a 0.22-point contribution in the first quarter of the year. Within that total, federal government spending rose at a 17.4 percent annual rate while state and local governments saw a 5.6 percent annualized decline.
Real final sales to private domestic purchasers, a key measure of private domestic demand, fell at a 33.7 percent annualized rate in the second quarter, versus a 5.8 percent pace of decline in the first quarter.
Reopening Boosts Consumer Optimism, But COVID Dampens the Outlook
The Consumer Confidence Index from The Conference Board declined in July, falling 5.7 points to 92.6 and leaving the index 31.8 percent below the year-ago level. The index is constructed so that it equals 100 in 1985. The main components of the index moved in opposite directions in July.
The present-situation component increased to 94.2 from 86.7, a 7.5-point gain though the July result is still 44.9 percent below July 2019. According to The Conference Board report, “Consumer Confidence declined in July following a large gain in June. The Present Situation Index improved, but the Expectations Index retreated. Large declines were experienced in Michigan, Florida, Texas and California, no doubt a result of the resurgence of COVID-19. Looking ahead, consumers have grown less optimistic about the short-term outlook for the economy and labor market and remain subdued about their financial prospects. Such uncertainty about the short-term future does not bode well for the recovery, nor for consumer spending.”
The expectations component lost 14.6 points to 91.5 from 106.1 in the prior month. The Conference Board report also noted, “Consumers, however, were less optimistic about the short-term outlook. The percentage of consumers expecting business conditions will improve over the next six months declined from 42.4 percent to 31.6 percent, while those expecting business conditions will worsen increased from 15.2 percent to 19.3 percent. Consumers’ outlook for the labor market was also less favorable. The proportion expecting more jobs in the months ahead declined from 38.4 percent to 30.6 percent, while those anticipating fewer jobs in the months ahead increased from 14.4 percent to 20.3 percent.” The net percentage for jobs expectations (more jobs minus fewer jobs) came in at 10.3, down from 24.0 in June. This compares to a rise of 4.1 points to 1.3 in the net present situation labor index (current jobs plentiful minus current jobs hard to get).
Initial Claims for Unemployment Benefits Suggest Labor Market Recovery is Faltering
While reopening has helped some businesses recall some employees, the surge in new cases and deaths attributed to COVID-19 has led some states to slow the process of reopening and, in some cases, reverse course. Furthermore, ongoing restrictions on some businesses have limited revenues, resulting in bankruptcy and new layoffs. In addition, the potential for uncertainty, confusion, and risk aversion among consumers and businesses regarding the resurgence of COVID-19 cases is putting the nascent recovery at great risk.
For a second week in a row, initial claims for unemployment benefits rose slightly, suggesting labor-market conditions remain in flux. Initial claims for unemployment insurance totaled 1.434 million for the week ending July 25, a rise of 12,000 from the previous week’s 1.422 million. The second consecutive rise follows a run of fifteen consecutive weeks of slowing claims after registering a record 6.87 million for the week ending March 28. Overall, the latest results extend to nineteen the total number of consecutive weeks of historically massive claims. Prior to the lockdowns, initial claims were running around 250,000, less than a fifth of their current level.
The number of ongoing claims totaled 17.02 million for the week ending July 18, up 867,000 from the prior week. The insured unemployment rate was 11.6 percent, up from 11.1 percent in the prior week.
Consumer prices decline in 2Q
Consumer price measures from the gross domestic product report showed declines in the second quarter. The personal-consumption price index fell at a 1.9 percent annualized rate, down from a 1.3 percent pace in the first quarter. From a year ago, the index is up 0.6 percent, well below the Federal Reserve’s 2 percent target. Excluding the volatile food and energy categories, the core PCE (personal consumption expenditures) index fell at a 1.1 percent pace, the first quarterly decline on record. From a year ago, the core PCE index is up 1.0 percent and has been at or below 2 percent since 2012.
Existing-Home Sales Rebound in June; Inventory Remains Tight
Sales of existing homes jumped 20.7 percent in June to a 4.72 million seasonally adjusted annual rate. Sales are still down 11.3 percent from a year ago and below the 5 to 6 million range they had been in since 2015.
Sales were up in all four regions in June: sales were up 31.9 percent in the West but are still down 13.6 percent from the year-ago level; sales rose 26.0 percent in the South, the largest region by volume, leaving that region’s sales rate 4.0 percent below the year-ago pace; sales gained 11.1 percent for the month in the Midwest and are 13.4 percent below the June 2019 rate; and sales were up 4.3 in the Northeast, leaving sales 27.9 percent below year-ago levels.
Sales in the market for existing single-family homes, which account for around 90 percent of total existing-home sales, rose 19.9 percent in June, coming in at a 4.28 million seasonally adjusted annual rate. From a year ago, sales are off 9.9 percent. The June pace is about in line with the dip in early 2014 but below the range of 4.4 million to 5 million since early 2015.
By region, sales for existing single-family homes followed the same pattern as total existing homes: sales were up 30.8 percent in the West but are still down 12.4 percent from the year-ago level; sales rose 24.2 percent in the South, leaving that region’s sales rate 2.5 percent below the year-ago pace; sales gained 11.7 percent for the month in the Midwest but are 12.5 percent below the June 2019 rate; and sales were up 4.9 percent in the Northeast, leaving sales 25.9 percent below year-ago levels.
Condo and co-op sales posted a 29.4 percent surge for the month, but still leaving sales 22.8 percent behind the June 2019 pace. Sales came in at a 440,000 pace for the month versus 340,000 in May. Sales of condos and co-ops are only slightly ahead of the lows from the 2008-2009 recession.
Total inventory of existing homes for sale rose 1.3 percent to 1.57 million in June, pushing the months’ supply (inventory times 12 divided by the annual selling rate) to 4.0 from 4.8 in May. For the single-family segment, the months’ supply also fell, to 3.8 from 4.6 while the condo and co-op months’ supply fell to 5.3 from 6.6. Months supply for the single-family segment is very low by historical comparison.
Though mortgage rates are hitting record-low levels, unemployment has surged and the outlook remains highly uncertain, suggesting lending may be somewhat restrained as lenders grow more cautious. Furthermore, resurging COVID-19 cases and deaths may discourage buyers and sellers. Nevertheless, there are anecdotal stories of urban dwellers seeking temporary and permanent housing alternatives, providing a bit of a bump up in demand.
Robert Hughes

Robert Hughes joined AIER in 2013 following more than 25 years in economic and financial markets research on Wall Street. Bob was formerly the head of Global Equity Strategy for Brown Brothers Harriman, where he developed equity investment strategy combining top-down macro analysis with bottom-up fundamentals. Prior to BBH, Bob was a Senior Equity Strategist for State Street Global Markets, Senior Economic Strategist with Prudential Equity Group and Senior Economist and Financial Markets Analyst for Citicorp Investment Services. Bob has a MA in economics from Fordham University and a BS in business from Lehigh University.


