AIER Leading Indicators Index Suggests Continued Economic Growth

Summary
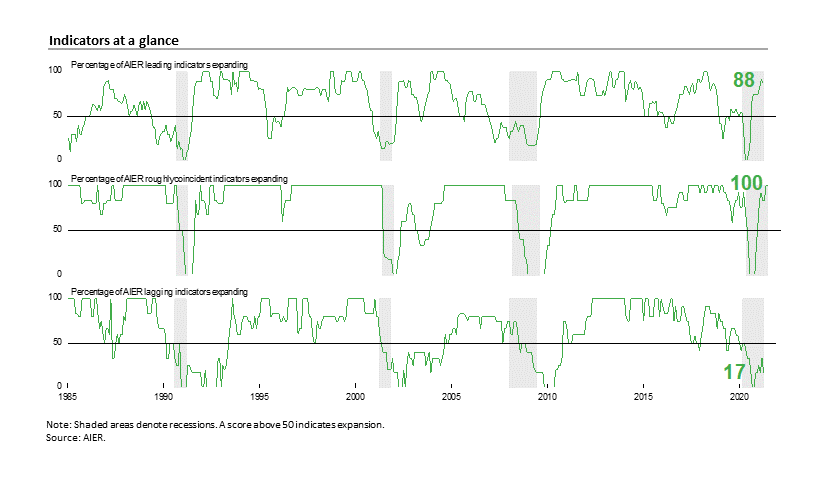
AIER’s Leading Indicators Index posted a slight decline in April, coming in at 88 versus 92 in March. Despite the pullback, the April result marks the eighth consecutive month above the neutral 50 level. The Roughly Coincident Indicators index remained at 100 in April. The back-to-back perfect results for the Roughly coincident Index follow four months between 83 and 92. The Lagging Indicators Index fell back to 17 from 33 in the prior month (see chart). Overall, the latest results for the business cycle indicator indexes suggest continued economic expansion in the months ahead.
The distribution of vaccines and cessation of restrictive government lockdown policies remain the driving force behind the economic recovery. As restrictions are eased, economic activity increases. While risks associated with the spread of Covid-19 (especially as the virus mutates) linger, the economy is on a clear recovery path with broadening economic activity. Other risks in the short term include shortages of materials, rising prices, and lingering logistical issues. Overall, the economic outlook is tilted to the upside.
Leading and Roughly Coincident Indicators indexes remain strongly positive
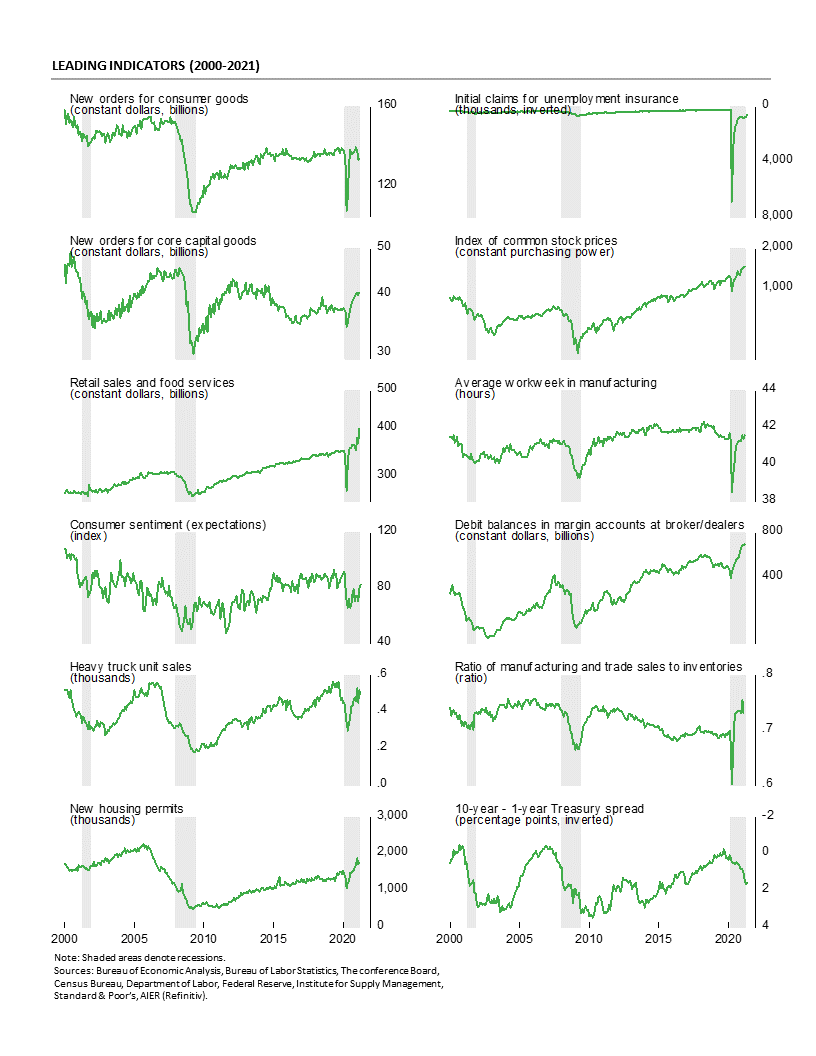
The AIER Leading Indicators index fell slightly to 88 in April, decreasing by four points from 92 in March. The March reading was the highest level since 2018. The April result is the eighth month in a row above the neutral 50 threshold and suggests continued overall economic expansion in the months ahead.
Among the 12 leading indicators, ten were in a positive trend in April, with just one trending unfavorably, and one trending flat or neutral. The unfavorable trend came from the Treasury yield spread, which was also in an unfavorable trend in March. The neutral trend result came from real new orders for consumer goods. This indicator showed a positive trend in March. Given the strong results from other measures of consumer spending, it is likely this indicator will return to a positive trend in the near future.
Overall, the Leading Indicators index remained above the neutral 50 level for the eighth consecutive month, suggesting continued expansion is likely. Over the last eight months, the leading indicators index has averaged 78.7, the highest level since November 2018. Government policies restricting consumers and businesses are slowly being removed, supporting a recovery in economic activity. However, mutations in the virus that causes Covid-19 could lead to a resurgence of the disease, causing renewed lockdown policies and threatening future growth. Despite the risk, economic activity is strengthening, and the overall economic outlook is tilted to the upside.
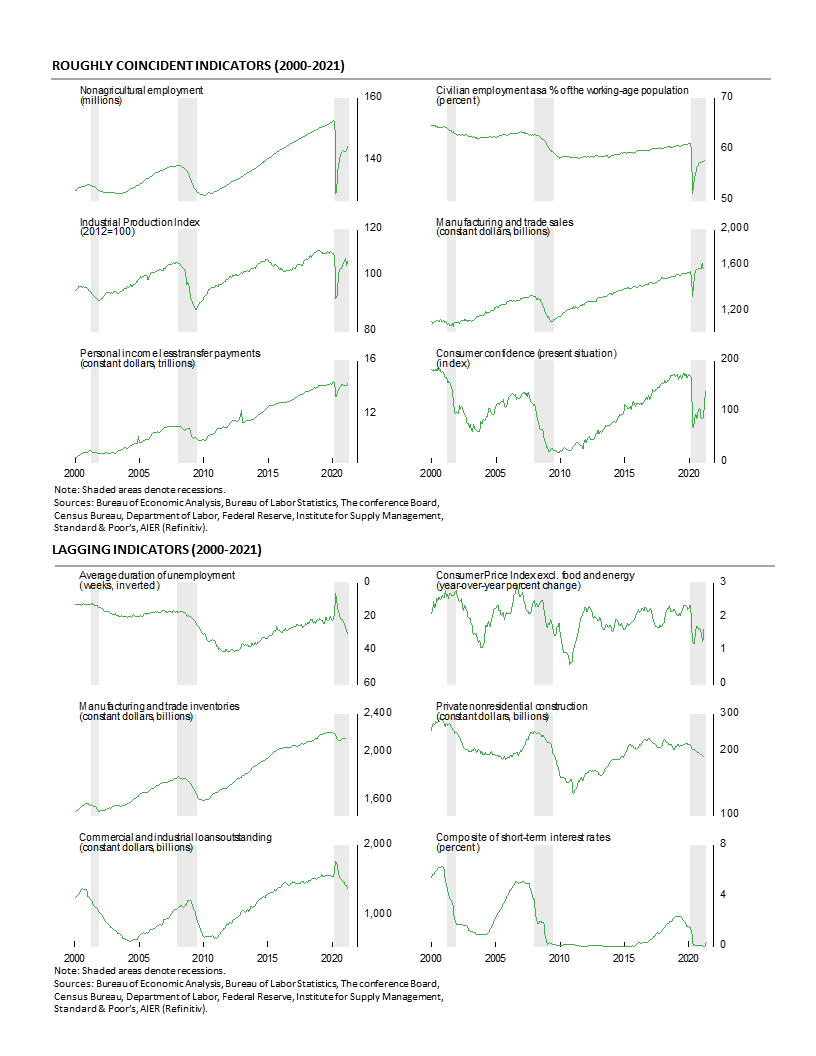
The Roughly Coincident Indicators index held at a perfect 100 reading in April with all six individual Roughly Coincident indicators continuing to trend higher. The back-to-back perfect results follow four months of readings in the 83 to 92 range and are the first consecutive perfect result since November-December 2018. The Roughly Coincident Indicators index has been above the neutral 50 level for seven consecutive months, posting an average reading of 85.7, the highest since May 2019.
AIER’s Lagging Indicators index dropped to a 17 reading in April, down from 33 in March and matching the February reading. The Lagging indicators index remains well below the neutral 50 threshold posting 12 consecutive months below 50, with the last 11-months at 33 or less including back-to-back readings of zero in September and October 2020. The average over the last 11 months is 18.9, the weakest 11 month run since October 2010. Just one indicator changed trend in the latest month: the composite short-term interest rate indicator, dropping to an unfavorable trend from a favorable trend. Overall, five indicators were trending lower, one indicator was trending higher, and none were in a neutral trend.
U.S. Economy Posts Widespread Gains in the First Quarter
Real gross domestic product increased at a 6.4 percent annualized rate in the first quarter, up from a 4.3 percent pace in the fourth quarter. Over the past four quarters, real gross domestic product is up 0.4 percent, but the level is still 1.5 percent below the pre-pandemic trend and 0.9 percent below the fourth quarter 2019 peak.
Real final sales to private domestic purchasers, a key measure of private domestic demand, rose at a very robust 10.6 percent annualized rate in the first quarter, versus a 5.5 percent pace in the fourth quarter. The rebound still leaves this important measure 1.2 percent below trend but at a record high, eclipsing the previous peak in the fourth quarter of 2019.
Gains were widespread across the different sectors of the economy. Real consumer spending rose sharply in the first quarter, increasing at a 10.7 percent pace compared to a 2.3 percent rate in the fourth quarter. The gain was the result of rises in spending on durable-goods (up 14.4 percent) nondurable-goods (14.4 percent), and services (4.6 percent). Business fixed investment increased at a 9.9 percent annualized rate in the first quarter of 2021. That gain was led by a 16.7 percent jump in spending on equipment and a 10.1 percent gain in intellectual-property investment. Those gains were partially offset by a decline in spending on business structures where spending fell at a 4.8 percent rate, the sixth consecutive decline in a row.
Residential investment, or housing, rose at a 10.8 percent annual rate in the first quarter compared to a 36.6 annualized gain in the prior quarter. Housing has shown resilience throughout the pandemic as extremely low interest rates combined with widespread remote working policies and the desire by some people to move away from virus epicenters has supported increased demand.
Businesses liquidated inventory at a $85.5 billion annual rate (in real terms) in the first quarter versus accumulation at a $62.1 billion rate in the fourth quarter, subtracting 2.64 percentage points from first-quarter growth after adding 1.37 percentage points in the prior quarter.
Exports fell at a 1.1 percent pace while imports rose at a 5.7 percent rate. Since imports count as a negative in the calculation of gross domestic product, a gain in imports is a negative for GDP growth, subtracting 0.77 percentage points in the first quarter. The drop in exports subtracted 0.1 percentage points. Net trade, as used in the calculation of gross domestic product, subtracted 0.87 percentage points from overall growth.
Government spending rose at a 6.3 percent annualized rate in the first quarter compared to a 0.8 percent decline in the fourth quarter, contributing 1.12 percentage points to growth versus a 0.14-point reduction in the fourth quarter of last year.
Retail Sales Surged to a Record High in March
Retail sales and food-services spending surged 9.8 percent in March, the second sharp jump in the last three months. The strong performance pushes total retail spending to a new record high and well above the most recent nine-year trend. From a year ago, retail sales are up 27.7 percent.
Core retail sales, which exclude motor vehicle dealers and gasoline retailers, posted an 8.2 percent jump for the month, putting that measure at a new record high as well. Core retail sales are up 17.9 percent from a year ago and are also well above the nine-year trend.
The strong performance in March was broad-based across the categories shown in the report with all thirteen major categories reporting a gain in sales. The gains were led by a 23.5 percent jump in sporting goods, hobby, musical instruments and book stores sales, followed by an 18.3 percent surge in clothing and accessories store sales, and a 15.1 percent gain in motor vehicles and parts sales.
April Auto Sales Hit the Highest Level Since 2005
Sales of light vehicles totaled 18.5 million at an annual rate in April, above the 18.0 million pace in March. The April result was the first month above the 16 to 18 million range and the fastest pace since July 2005. Unit sales plunged in March and April 2020 to 11.4 million and 8.7 million annual rates, respectively. The pace of sales in April 2020 was the lowest on record since this data series began in 1976 and follows a run of 72 months in the 16 to 18 million range from April 2014 through February 2020. Recent strength is a positive sign for consumer spending but may also be partially attributed to a potential chip shortage with consumers looking to accelerate purchases before inventories decline and prices rise.
Breaking down sales by origin of assembly, sales of domestic vehicles rose to 13.9 million units versus 13.6 million in March, a gain of 1.7 percent, while imports rose to 4.7 million versus 4.3 million in March, a rise of 7.2 percent. The domestic share came in at 74.8 percent in April versus 75.8 in March.
Breaking down by size of vehicle, April light-truck sales totaled 14.4 million at an annual rate versus a 14.0 million rate in March, a gain of 2.4 percent. Car sales were 4.1 million at an annual rate versus 3.9 million in March, a rise of 5.3 percent.
The light-truck share stood at 77.7 percent for April, completely dominating the car share of 22.3 percent. The dominant share of light-trucks continues a long-term trend. As recently as March 2013, the split between cars and light-trucks (SUVs and pick-up trucks) was about even, with both segments selling about 7.8 million at an annual rate.
Core Capital-Goods Orders Hit Another Record High in March
New orders for durable goods posted a gain in March, rising 0.5 percent following a drop of 0.9 percent in February. Total durable-goods orders are up 2.4 percent from a year ago. The March gain puts the level of total durable-goods orders at $256.3 billion, the fourth highest on record after the January reading of $257.2 billion, $256.4 billion in September 2018, and the record-high level of $292.4 billion in July 2014.
New orders for nondefense capital goods excluding aircraft or core capital goods, a proxy for business equipment investment, rose 0.9 percent in March after falling 0.8 percent in February, putting the level at $73.2 billion, a record high. This important category had been in the $65 to $70 billion range for several periods over the past 15 years before dropping to $61.3 billion in April 2020. The $61.3 billion pace was the slowest since June 2017. Core capital-goods orders have been above $70 billion for six consecutive months.
Five of the seven major categories of durable goods shown in the report had gains in the latest month. Among the individual categories, primary metals rose 1.2 percent, fabricated metal products gained 3.6 percent, machinery orders added 1.0 percent, computers and electronic products rose 0.5 percent, and the catch-all “other durables” category was up 2.3 percent. The two decliners were electrical equipment and appliances, down 1.5 percent, and transportation equipment, off 1.7 percent. Within the transportation equipment category, motor vehicles and parts gained 5.5 percent while nondefense aircraft fell 46.9 percent and defense aircraft dropped 20.2 percent.
The report on durable-goods orders highlights the strength of the business sector. While government lockdowns have caused extraordinary damage across the economy, as government restrictions are eased, signs of recovery have grown stronger. The manufacturing sector (along with housing) is one of the more robust areas and capital spending reflects that strength.
April Manufacturing Survey Suggests Strong Demand, Materials Shortages, and Rising Prices
The Institute for Supply Management’s Manufacturing Purchasing Managers’ Index eased back to 60.7 in April, a decline of 4.0 points over the 64.7 percent result in March. April is the eleventh consecutive reading above the neutral 50 threshold. Over the past 11 months, the Purchasing Managers’ index has averaged 58.1, the highest since January 2019. The survey results suggest that the manufacturing-sector recovery continues to gain momentum.
Among the key components of the Institute for Supply Management’s most recent survey, the New Orders Index came in at 64.3 percent, down 3.7 percentage points from 68.0 percent in March. The New Orders Index has been above 50 for 11 consecutive months and above 60 for 10 consecutive months. The 10-month average is 64.6, the highest since September 2004. The new export orders index, a separate measure from new orders, rose to 54.9 versus 54.5 in March. The new export orders index has been above 50 for 10 consecutive months.
The Production Index registered a 62.5 percent result in April, down from 68.1 percent in March. The index has been above 50 for 11 consecutive months and above 60 for the last 10 months. The 10-month average is 62.9, the highest since October 2004.
The Employment Index fell in April, losing 4.5 percentage points to 55.1 percent in April. The employment index had been one of the weaker components but has now been above 50 for five consecutive months and six of the past seven months.
The Backlog-of-Orders Index rose again, coming in at 68.2 percent in April, up from 67.5 percent in the prior month, the highest level since the series began in 1993.
Customer inventories in April are still considered too low, with the index remaining below 50 at 28.4 percent versus 29.9 percent in the prior month (index results below 50 indicate customers’ inventories are too low. The index has been below 50 for 55 consecutive months and is the lowest since this index began in 1997. Insufficient inventory may be a positive sign for future production.
The prices index, reflecting what manufacturers pay for input materials, rose to 89.6 in April, up 4.0 points from 85.6 in March and the highest level since July 2008. Rising input costs reflect shortages of materials, often related to production issues as well as logistical and delivery problems.
Supplier deliveries slowed again in April with the index falling slightly to 75.0 from 76.6 but still a very high level.
Housing Starts and Permits Rise in March as Headwinds Grow
Total housing starts rose to a 1.739 million annual rate from a 1.457 million pace in February, a 19.4 percent increase. The March recovery was expected as weather conditions in significant portions of the country were unfavorable in February and significantly depressed activity. From a year ago, total starts are up 37.0 percent.
The dominant single-family segment saw starts rise 15.3 percent for the month to a rate of 1.238 million. After the March rebound, single-family starts are up 40.7 percent from a year ago.
Starts of multifamily structures with five or more units surged 30.0 percent to 477,000 and are up 26.9 percent over the past year.
For housing permits, total permits rose 2.7 percent to 1.766 million in March. Total permits are 30.2 percent above the March 2020 level. Single-family permits were up 4.6 percent at 1.199 million while permits for two- to four-family units added 25.5 percent to 59,000 but permits for five or more units declined 3.6 percent to 508,000.
Home construction has been one of the strongest parts of the economy over the past year and excluding the plunge in activity during the government-enforced lockdowns in early 2020, single-family housing activity has been on an upswing for most of the last decade, recovering from the housing bubble and collapse of the late 2000s. The post-lockdown recovery has been supported by a surge in demand as consumers sought less dense housing.
The surge has also been supported by low mortgage rates with rates falling to multi-decade lows. However, conditions may be starting to change. Mortgage rates have been rising over the past several weeks, moving about 50 basis points higher off the low. Rates are likely to continue drifting higher as economic activity normalizes and market distortions from monetary policy initiatives are removed. Even with a move higher, rates are low by historical comparison.
Another headwind to continued gains in housing activity is rising home prices. Home prices have been rising fairly steadily since the bursting of the housing bubble and increases have accelerated sharply during the pandemic. The combination of rising mortgage rates and rising home prices should act as a powerful headwind to future demand.
New Single-Family Home Sales Jump in March
Sales of new single-family homes rose sharply in March, increasing 20.7 percent to 1.021 million at aseasonally-adjusted annual rate from a 846,000 pace in February. Sales are an astonishing 66.8 percent above the year-ago level. Sales were up in three of the four regions of the country in March with strong double-digit gains in the Northeast, the South, and the Midwest but a 30.0 percent drop in the West. From a year ago, sales are also up in three regions: 78.4 percent in the Midwest, 90.1 percent in the South, and 108.7 percent in the Northeast, but down 2.0 percent in the West.
While sales of new single-family homes rose in March, sales in the market for existing single-family homes, which account for around 90 percent of total existing-home sales, fell 4.3 percent, coming in at a 5.30 million seasonally adjusted annual rate. From a year ago, sales are up 10.4 percent. The March pace is the ninth consecutive month above the 5 million mark but is down from a recent peak of 6.01 million in October 2020.
The total inventory of new single-family homes for sale was unchanged at 307,000 in March, leaving the months’ supply (inventory times 12 divided by the annual selling rate) at 3.6, down 18.2 percent from February and 44.6 percent below the year-ago level. The median time on the market for a new home was unchanged in March, coming in at 3.6 months.
The total inventory of existing single-family homes rose 3.4 percent to 900,000 but is down 31.3 percent from March 2020. The months’ supply rose to 2.0 from 1.9 in February.
Outlook tilted to the upside
The U.S economy continues to show significant progress on the path to recovery. The AIER Leading Indicators index posted its eighth consecutive month above the neutral 50 threshold, suggesting continued expansion in coming months. The Roughly Coincident Indicators index posted a second consecutive 100 reading, confirming the strengthening economic recovery.
Easing government restrictions is leading to increasing economic activity. Risks remain, however. Virus mutations could result in a reacceleration of the spread of Covid-19 and spark new government restrictions on consumers and businesses. In the meantime, stronger growth is occurring but some challenges with logistics and shortages are pressuring prices. Overall, the outlook is tilted to the upside.
Robert Hughes

Robert Hughes joined AIER in 2013 following more than 25 years in economic and financial markets research on Wall Street. Bob was formerly the head of Global Equity Strategy for Brown Brothers Harriman, where he developed equity investment strategy combining top-down macro analysis with bottom-up fundamentals. Prior to BBH, Bob was a Senior Equity Strategist for State Street Global Markets, Senior Economic Strategist with Prudential Equity Group and Senior Economist and Financial Markets Analyst for Citicorp Investment Services. Bob has a MA in economics from Fordham University and a BS in business from Lehigh University.


