Multifamily Housing Permits and Starts Rise in April

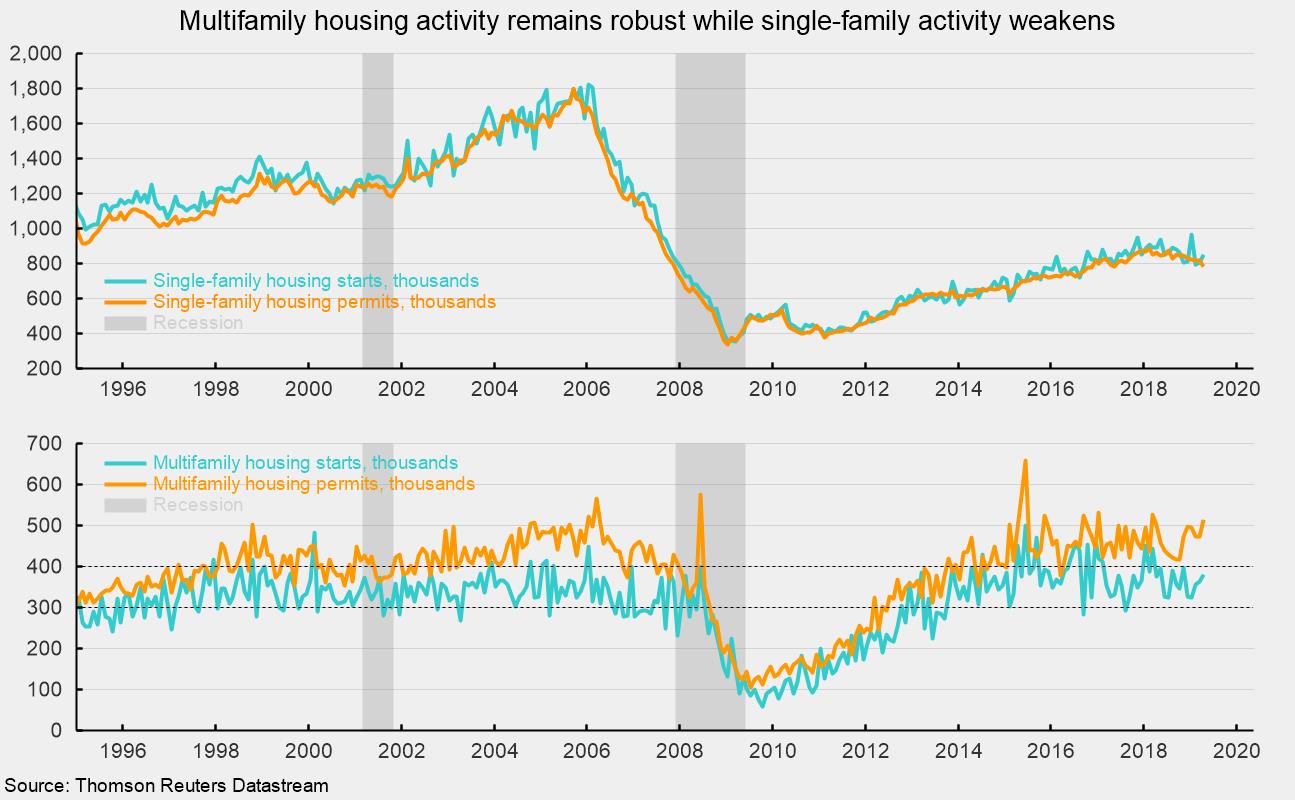
Housing activity improved in April as starts and permits posted gains. However, details varied widely among the segments and regions. Total housing starts rose to a 1.235 million annual rate from a 1.168 million pace in March. The dominant single-family segment, which accounts for about three-fourths of new home construction, rose 6.2 percent for the month to a rate of 854,000 units (see top chart). The April gain was the second in a row, but the trend remains flat or slightly down. Starts of multifamily structures with five or more units increased by 2.3 percent to 359,000. From a year ago, total starts are off 2.5 percent with single-family starts down 4.3 percent and multifamily starts up 1.4 percent.
Among the four regions in the report, total starts fell in two, the South (−5.7 percent) and the West (−5.5 percent), while the Northeast surged 84.6 percent and the Midwest jumped 42.0 percent. For the single-family segment, starts were up in three regions, with gains ranging from 37.9 percent in the Midwest to 13.7 percent in the West; single-family starts were off 5.6 percent in the South.
For housing permits, total permits rose 0.6 percent to 1.296 million from 1.288 million in March. Total permits are 5.0 percent below the April 2018 level. Single-family permits were down 4.2 percent at 782,000 in April (see top chart) while permits for two- to four-family units jumped 30.6 percent and permits for five or more units gained 7.1 percent to 467,000 (see top chart). Permits for single-family structures are down 9.4 percent from a year ago while permits for two- to four-family structures are up 14.6 percent and permits for structures with five or more units are up 1.5 percent over the past year. Combined, multifamily permits came in at 514,000 in April, a very robust pace by historical comparison (see bottom chart).
The single-family and multifamily segments of the housing market appear to be trending in somewhat different directions. The single-family segment never came close to the levels of activity achieved in the late 1990s or 2000s and appears to be trending lower from the peaks in late 2018. Multifamily activity returned to its prior range and appears to be holding at that robust level.
Mortgage rates remain key to both segments, with rates rising from late 2016 through late 2018 but now having fallen back somewhat over the last six months. With Fed policy apparently on hold, long-term rates may trend flat but swing up and down as expectations for growth, price changes, and policy fluctuate.
Robert Hughes

Robert Hughes joined AIER in 2013 following more than 25 years in economic and financial markets research on Wall Street. Bob was formerly the head of Global Equity Strategy for Brown Brothers Harriman, where he developed equity investment strategy combining top-down macro analysis with bottom-up fundamentals. Prior to BBH, Bob was a Senior Equity Strategist for State Street Global Markets, Senior Economic Strategist with Prudential Equity Group and Senior Economist and Financial Markets Analyst for Citicorp Investment Services. Bob has a MA in economics from Fordham University and a BS in business from Lehigh University.


