Cumulative Job Losses Show Labor Market Devastation

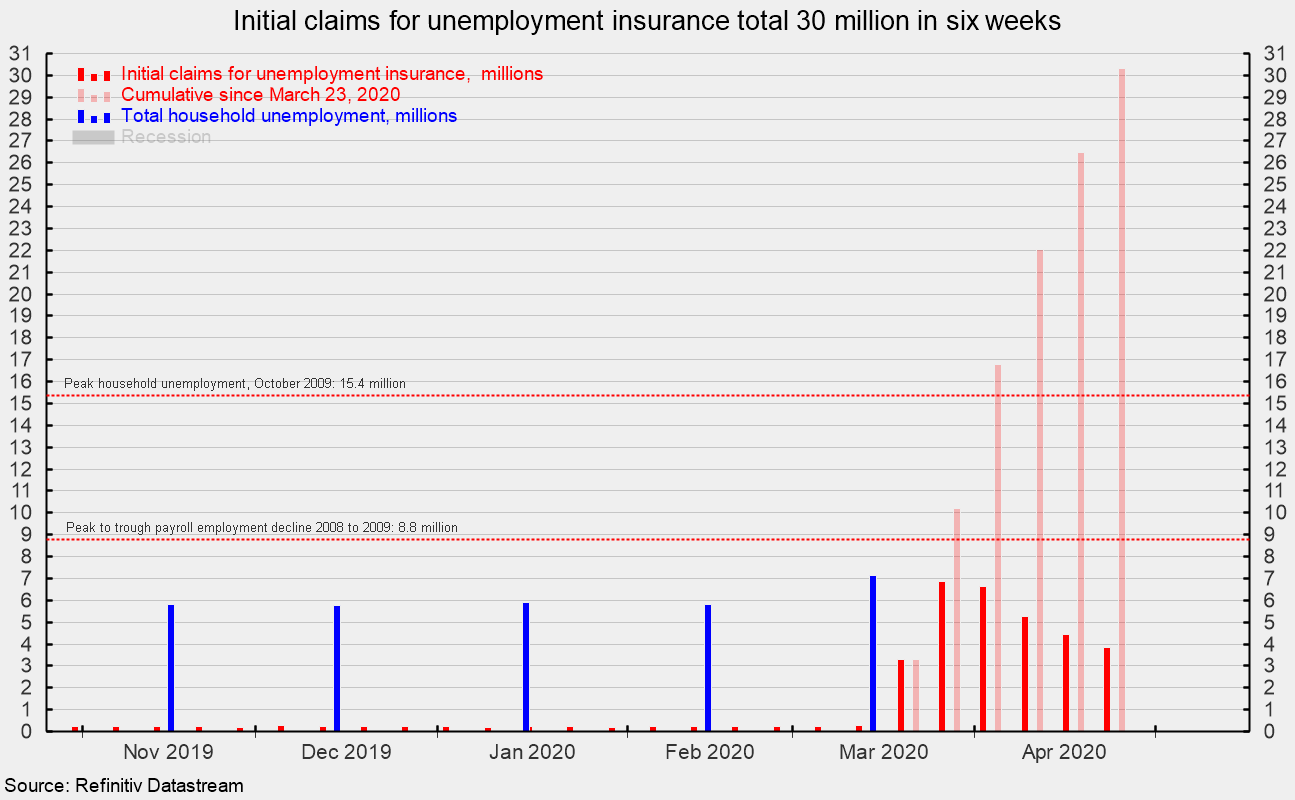
Initial claims for unemployment insurance totaled 3.8 million for the week ending April 25, marking the sixth consecutive week of massive, record-shattering layoffs, and dwarfing the previous high of 695,000 in October 1982. However, on a somewhat positive note, the latest tally is the fourth week of declines in the number of initial claims since the 6.87 million claims during the week of March 28 (see chart).
To help put these numbers in perspective, during the Great Recession in 2008-09, total payroll job losses were 8.8 million over 25 months versus the current 6-week total of 30.3 million initial claims (see chart). The peak number of unemployed people for the Great Recession, as measured in the household survey portion of the monthly Employment Situation report, actually occurred in October 2009, four months after the official end of the recession, and was 15.4 million (see chart).
As of the March 2020 Employment Situation report, there were 7.14 million unemployed in the United States, resulting in an unemployment rate of 4.4 percent. The April report is due out on Friday, May 8. Current consensus estimates are for payrolls to drop by 20 million, resulting in an unemployment rate of 14.0 percent. The previous cycle peak in the unemployment rate was 10 percent in October 2009 while the highest unemployment rate since 1950 came in November 1982 at 10.7 percent. Though data collection was much less reliable, the unemployment rate following the Great Depression was estimated to have peaked at 25 percent in 1933.
The outbreak of COVID-19 and government policy responses have resulted in massive distortions to economic activity including a record-shattering surge in layoffs, plunging consumer confidence, and collapsing retail spending. The unprecedented flood in claims is part of a tsunami of negative economic statistics that is expected to continue over the next several months.
Robert Hughes

Robert Hughes joined AIER in 2013 following more than 25 years in economic and financial markets research on Wall Street. Bob was formerly the head of Global Equity Strategy for Brown Brothers Harriman, where he developed equity investment strategy combining top-down macro analysis with bottom-up fundamentals. Prior to BBH, Bob was a Senior Equity Strategist for State Street Global Markets, Senior Economic Strategist with Prudential Equity Group and Senior Economist and Financial Markets Analyst for Citicorp Investment Services. Bob has a MA in economics from Fordham University and a BS in business from Lehigh University.


