Weather Weakness


Clouding the Picture…
The Bureau of Labor Statistic’s Employment Situation report issued in January for the month of December brought the first notable sign of weather-related weakness. Since then, a range of economic indicators have disappointed economists and analysts, with weather bearing much of the blame. Additionally, a number of corporate earnings reports released in recent weeks have noted the drag of severe weather on sales and earnings.
The impact of severe weather on an economy is extremely difficult to measure. There are the direct costs such as property damage to consider as well as the ancillary effects including lost work time and reallocated or deferred spending. Examples of reallocated spending might be buying shovels and snow blowers instead of new clothes and dinner out, or it might be repairing a storm-damaged roof instead of redecorating a room. For municipal governments, there might be more spending on snow removal and pothole repair and commensurately less on replacing old office furniture. Examples of deferred spending might be buying a new car or house next month instead of this month.
…But Blowing Over Soon
While such spending shifts may be quite important on a micro level — i.e., to the individual merchants affected — on a macro level, they tend to wash out. As long as weather-related spending replaces other current consumption and isn’t financed by the reallocation of capital away from productive investment, most weather-related economic effects tend to be temporary distortions, with underlying trends reestablishing themselves within a few months.
Economy Still Growing
Our Business-Cycle Conditions (BCC) indicators reflect the effects of severe weather on the economy. The percentage of leading indicators that expanded in February fell to 67 percent following four months at 100 percent. That’s the lowest reading since September 2009. Notably, the percentage of leaders expanding is still above 50 percent – meaning that more than half of our leading indicators still suggest ongoing economic growth.
The cyclical score for the leading indicators, derived from
a separate mathematical analysis, fell less sharply, to 87 from 90 in the prior month. This result supports the notion that the economic outlook, while impacted by recent weather events, is still positive.
Key takeaways from the latest readings of AIER’s BCC indicators include:
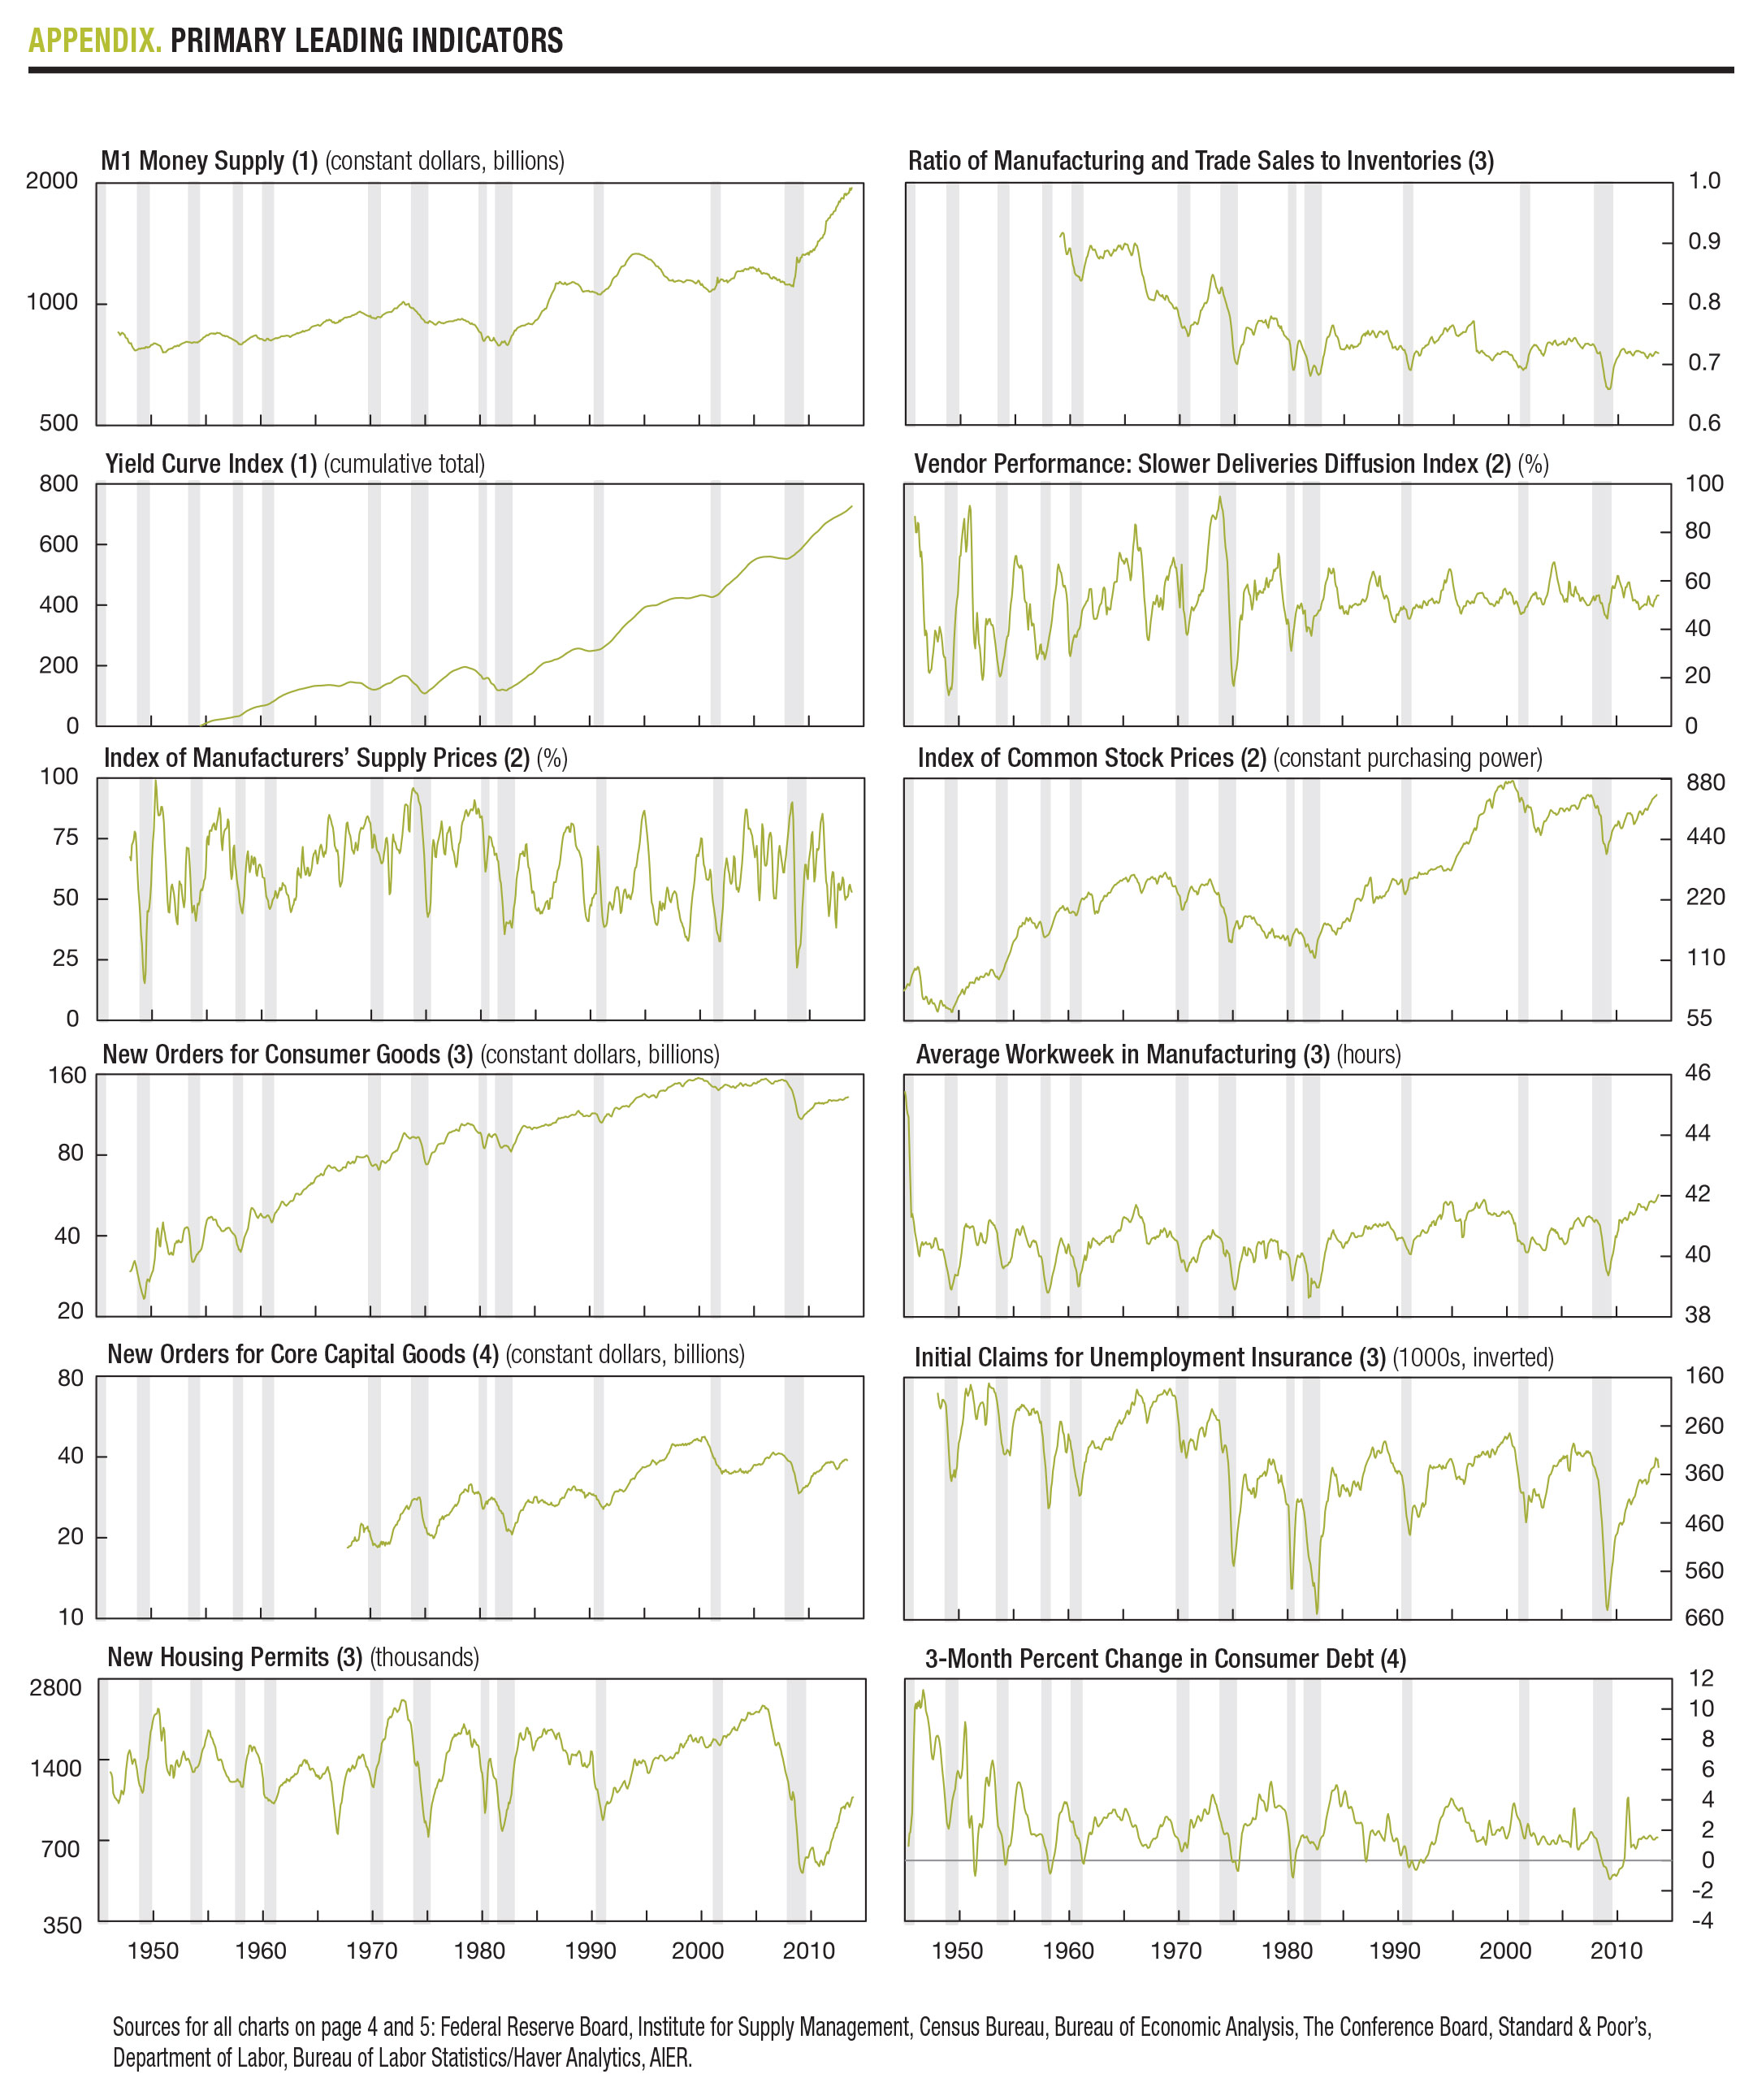
Leading: Among the leading indicators, eight were judged to have a positive trend in February, with three of those eight hitting new cycle highs: M1 money supply, the index of common stock prices, and the yield curve index. Conversely, four were judged to have turned to a negative trend: new orders for consumer goods, new housing permits, average workweek in manufacturing, and initial claims for unemployment insurance.
Coincident: All six of our coincident indicators continue to show positive trends, resulting in a perfect 100 reading for the 26th month in a row. Four of the six registered new highs in the latest month: nonagricultural employment, manufacturing and trade sales, civilian employment to population ratio, and gross domestic product.
Lagging: AIER’s index of lagging indicators broke a string of 21 straight months of perfect 100 readings as the percentage of laggers fell to 80. Among the individual indicators, change in labor costs per unit of output for manufacturing turned to a declining trend in the latest month, while new highs were recorded for commercial and industrial loans, manufacturing and trade inventories, and the ratio of consumer debt to income.
Lagging: AIER’s index of lagging indicators broke a string of 21 straight months of perfect 100 readings as the percentage of laggers fell to 80. Among the individual indicators, change in labor costs per unit of output for manufacturing turned to a declining trend in the latest month, while new highs were recorded for commercial and industrial loans, manufacturing and trade inventories, and the ratio of consumer debt to income.
In aggregate: While 10 of our 24 indicators hit new cycle highs last month, five established new downtrends, resulting in sharp drops in our percentage-of-leaders index and our percentage-of-laggers index. Among the four leaders that turned to downward trends, all four are consumer related and all susceptible to severe weather patterns. As consumers stay home and away from the shopping malls, consumer spending slows, leading to fewer new orders for consumer goods. Severe weather may prevent workers from getting to work, leading to a drop in hours worked, and government closings can slow the processing of new housing permits. In addition, slower business activity overall can lead to more layoffs, pushing up initial claims for unemployment insurance.
Despite the declines in several component indicators, our diffusion index of leading indicators and our diffusion index of lagging indicators remain above 50 percent and therefore do not suggest economic contraction (Chart 1). Given our view that severe weather is the likely cause of much of the weakness in our indicators, we expect both the economy and our indicators to show improving results over the next few months – barring any further significant weather events.
FED Holding Course
Recognizing the “cumulative progress” toward recovery since the end of the Great Recession, the Fed has begun reducing its monthly asset purchases, first by $10 billion to $75 billion in December 2013, and then by another $10 billion in January.
In her recent monetary policy testimony before Congress, Yellen stated, “If incoming information broadly supports the Committee’s expectation of ongoing improvement in labor market conditions and inflation moving back toward its longer-run objective, the Committee will likely reduce the pace of asset purchases in further measured steps at future meetings.” This statement is among the clearest made regarding future Federal Reserve monetary policy. If the economy continues to improve and inflation remains low as Fed officials expect, additional tapering of QE at future FOMC meetings this year is highly probable.
Yellen continues, “That said, purchases are not on a preset course, and the Committee’s decisions about their pace will remain contingent on its outlook for the labor market and inflation as well as its assessment of the likely efficacy and costs of such purchases.” Chairwoman Yellen, like her predecessor, emphasizes that future policy moves are contingent on incoming data and that the pace and timing of further tapering is not guaranteed but is subject to the evolving views of Fed officials. Fed policy has been and remains data dependent.
The FED’s Take
So how will the slowing economy affect Fed official’s outlook for the labor market and inflation, and therefore future policy? Yellen indicated last month that Fed officials suspect “unseasonably cold weather has played some role” in the recent softening in economic indicators. “If there’s a significant change in the outlook, certainly we would be open to reconsidering,” she said, “but I don’t want to jump to conclusions.” Yellen indicated that Fed economists will “try to get a firmer handle” on the extent of the impact of severe weather patterns on economic indicators.
Likewise, Philadelphia Fed President Plosser said, “We should be patient and not read too much into data that’s been very noisy” because of severe winter weather in much of the U.S.” He continued, “We may not get a good handle on the economy for a few months and even then we’ll still be uncertain as we always are.” We continue to believe that recent weakness in the economy is weather related. Therefore, we expect the economy to gradually reaccelerate and for Fed officials to follow through on their stated guidance of continuing to taper asset purchases in measured steps at the regularly schedule FOMC meetings this year.
Market Expectations
Between December 31, 2013 and February 3, 2014, the S&P 500 fell 106.47 points or 5.76% while 10-year Treasury note yields fell 43 basis points, from 3.04% to 2.61%, largely in response to weaker than expected economic data. Since February 3, in a stark contrast to each other, the S&P 500 has recovered all the lost ground and then some, to close at a record high 1859.45 on February 28 while 10-year Treasury note yields have risen just 4 basis points to 2.65%. These performances suggest equity investors remain optimistic about the outlook for the U.S. economy and corporate earnings – a view consistent with our read of the economy – while Treasury investors remain a bit more cautious. Other things being equal, continued tapering of QE along with a gradual reacceleration in economic growth is likely to lead to additional gains for U.S. equity markets and a gradual rise in interest rates.
[pdf-embedder url=”https://www.aier.org/wp-content/uploads/2014/03/AIER_BCC_Mar2014.pdf“]Robert Hughes

Robert Hughes joined AIER in 2013 following more than 25 years in economic and financial markets research on Wall Street. Bob was formerly the head of Global Equity Strategy for Brown Brothers Harriman, where he developed equity investment strategy combining top-down macro analysis with bottom-up fundamentals. Prior to BBH, Bob was a Senior Equity Strategist for State Street Global Markets, Senior Economic Strategist with Prudential Equity Group and Senior Economist and Financial Markets Analyst for Citicorp Investment Services. Bob has a MA in economics from Fordham University and a BS in business from Lehigh University.


