Outlook for Profit Margins
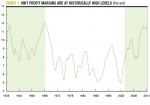
Nineteen sixty four was also the last time that U.S. profit margins ascended above the 11 percent mark. Margins continued to rise over the next several quarters, peaking at 12.05 percent in the first quarter of 1966. Following the peak in 1966, margins declined to a low of about 5 percent and remained range-bound between 5 percent and 9 percent for the next three decades. Profit margins finally broke above 11 percent in the fourth quarter of 2011 and have held there for the past ten quarters (Chart 1).
For Digital or Print Copies of AIER Research, Click Here
A critical question for the U.S. equity market, particularly in light of modest economic growth supporting only modest top-line revenue growth, is: How will margins behave over the next few quarters and years? Our research suggests that the answer lies in the intersection of two countervailing forces: rising labor costs, which depress margins, and rebounding productivity growth, which drives them upward.
Economic Outlook
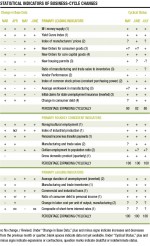
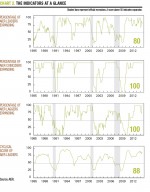
Our Business-Cycle Conditions (BCC) indicators eased back slightly in the latest month, the second decline in a row. The share of leading indicators that expanded in July dropped to 80 percent, down 2 percentage points from a reading of 82 percent in June.
Our cyclical score for the leading indicators, derived from a separate mathematical analysis, held 88 in July, unchanged from June. Despite the decline in the leaders’ diffusion index, both measures still register values well above 50, suggesting that the economic outlook remains positive, with a very low probability of recession in the coming quarters.
Key takeaways from the latest readings of AIER’s BCC indicators include:
Leading: Among the 12 leading indicators, eight were judged as “clearly expanding” in July, two were considered “indeterminate”—i.e., having no discernable trend—one was deemed “probably contracting,” and one was “clearly contracting.” Among those indicators that were clearly expanding, six hit new cycle highs: M1 money supply, yield curve index, new orders for core capital goods, index of common stock prices, average workweek in manufacturing, and initial claims for state unemployment insurance (inverted). The ratio of manufacturing and trade sales to inventories and the index of manufacturers’ prices were the two indicators that had no discernable trend, while the new housing permits indicator was deemed “probably contracting,” and vendor performance was judged as “clearly contracting.”
Coincident: All six of our coincident indicators continued to expand in July, resulting in a perfect 100 reading for the 31st consecutive month. Within these six indicators, five were “clearly expanding” while one, civilian employment to population ratio, was “probably expanding.” Four of these indicators also hit new cycle highs: nonagricultural employment, index of industrial production, manufacturing and trade sales, and civilian employment to population ratio.
Lagging: AIER’s index of lagging indicators registered a perfect 100 percent reading again last month as four out of four indicators with a trend were clearly expanding, and all four hit new cycle highs. They were average duration of unemployment, manufacturing and trade inventories, commercial and industrial loans, and the ratio of consumer debt to income. Two indicators were indeterminate last month: the composite of short-term interest rates and change in labor costs per unit of output for manufacturing.
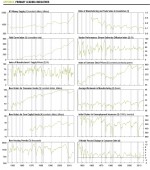
In aggregate: Eighteen of our 24 indicators were judged to be clearly expanding or probably expanding last month, with 14 hitting new cycle highs. Four indicators were considered to have no discernable trend, while two indicators were either clearly contracting or probably contracting. Overall, our three composite indexes remained well above 50 percent, pointing to continued economic growth in the months ahead (Chart 2).
Margin Definition
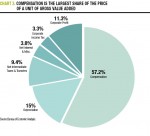
In our analysis of U.S. profit margins, we use data from the Bureau of Economic Analysis (BEA) that estimates the total price per unit, costs per unit, and profit per unit of real gross value added (GVA) for the nonfinancial corporate business sector of the economy. The specific cost components we look at include compensation costs—a.k.a. unit labor costs—as well as depreciation per unit of GVA, net intermediate taxes and business transfers per unit of GVA, net interest expense and miscellaneous payments per unit of GVA, taxes on corporate income per unit of GVA, and after-tax profit per unit of GVA. Each of these components is shown as a percentage of total price per unit of GVA (Chart 3). For example, profit margin is profit per unit of GVA divided by total price per unit of GVA.
Using an average of the four quarters through first-quarter 2014, compensation costs were the largest share of unit price, accounting for 57 percent of the price of a unit of real GVA. Depreciation and net intermediate taxes and business transfers accounted for 15.0 percent and 9.4 percent, respectively, while net interest expense and miscellaneous payments, and taxes on corporate income accounted for 3.8 percent and 3.3 percent, respectively. The remaining share, about 11.3 percent, is after-tax profit per unit as a share of the total price per unit of GVA, or profit margin.
Recent Trends
Depreciation, net intermediate taxes and business transfers, and net interest expense and miscellaneous payments combined for a little more than a quarter of the total price per unit of GVA.
Historically, these three components have shown varying trends (Chart 4). Depreciation has been trending steadily higher since the late 1940s. As the U.S. economy becomes more capital intensive and the total base of fixed investment continues to grow, depreciation of fixed capital investment will likely continue to grow as well. Over the period from 1948 through 2014, deprecation rose from about 8 percent to 16 percent, or about 12 basis points per year. While continued growth at this pace would exert significant margin pressure over a long period of time, the impact over the next few quarters or even years would be fairly limited. That likelihood implies little threat to profit margins from depreciation over the coming years.
Net intermediate taxes and business transfers has held remarkably steady over the past six decades, remaining between 8 percent and 10 percent. This long period of stability combined with the current reading, already near the top of the historical range, would suggest little threat to profit margins from this source over the next few years.
Net interest expense and miscellaneous payments showed a mild uptrend during the first 40 years of our observation window, rising from about 0.5 percent in 1948 to a high of 5.4 percent in 1990. However, since that peak, this measure has trended lower to about 3.8 percent in the latest four quarters. While rising interest rates could put upward pressure on net interest expense, large holdings of cash on corporate balance sheets and healthy levels of cash flow suggest alternative financing is available if interest expense rises too aggressively.
Unit income taxes generally trended lower from 1948 through the mid-1980s and have remained relatively steady over the past 30 years, ranging between 2 percent and 4 percent (Chart 5). Given the deep partisanship that dominates Washington, DC, it seems unlikely that major corporate tax changes are eminent, so we don’t expect any major shifts in unit taxes over the near term.
What To Watch
Compensation costs, the largest component of the price per unit of real GVA, have been the crucial determinant of improved profitability since 2002 and (along with productivity—see below) will likely determine the outlook.
Unit labor costs hit a cycle high of 65.7 percent of total unit price of real GVA in the third quarter of 2001, and have fallen to approximately 57 percent in recent quarters (Chart 6). That decline coincided with a sharp deceleration in compensation cost increases (Chart 7). With the economy continuing to grow, the risks appear somewhat tilted to a tightening labor market and resumption of wage increases, though it may still take several quarters for these costs to threaten profit margins. However, two forces may restrain compensation cost increases. The labor force participation rate, at 62.8 percent, remains well below its peak of 67.3 percent. Underemployment, (total unemployed, plus all workers marginally attached to the labor force, plus those working part time for economic reasons) stands at 12.1 percent, which is well above the pre-recession rate of about 8 percent. Both indicators suggest potential slack in the labor market, which could help contain labor cost pressure.
Notably, however, compensation costs can be offset by rising productivity growth. While productivity growth has suffered over the past several quarters, falling to less than 1 percent growth on a year-over-year basis, productivity growth does tend to follow real investment spending, with about a four-year lag (Chart 8). Given the patterns in real investment spending over the past four years, there is a reasonable probability that productivity growth will reaccelerate over the coming quarters, helping to contain compensation cost pressures.
Conclusions
The outlook for the economy remains favorable, according to our Business Cycle Conditions indicators. The Diffusion Index of Leaders suggests a low probability of recession in coming quarters.
Nonfinancial Corporate sector profit margins are at multi-decade highs and historically have not remained at such levels for extended periods of time. Our analysis suggests that while there are downside risks to profit margins, the risk of a sharp decline over the next few quarters or even the next few years is low, in our view.
The key thing to watch will be the potential acceleration in compensation cost increases, while also keeping an eye out for a potentially offsetting rebound in productivity growth. The resulting net of these two economic gauges will play an important role in the course of corporate profit margins and profit levels over coming quarters—and therefore in the ability of stock prices to continue posting gains.
A Glossary of the Business-Cycle Conditions Indicators can be found here.
[pdf-embedder url=”https://www.aier.org/wp-content/uploads/2014/08/BCC20140801_0.pdf“]
