Teaching High School Students About Unemployment
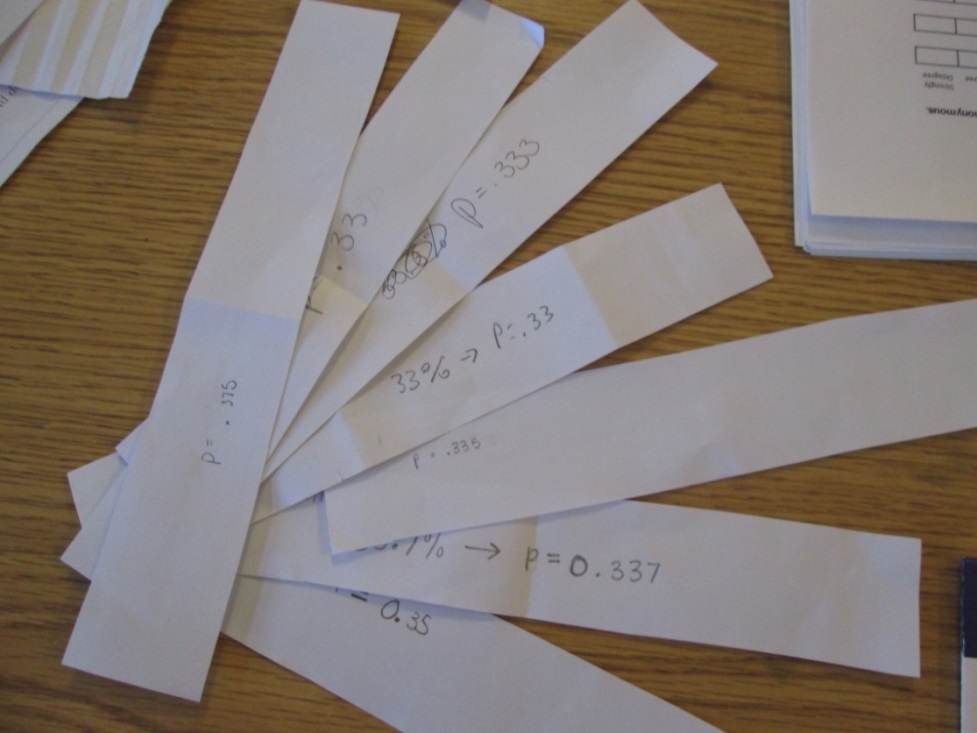
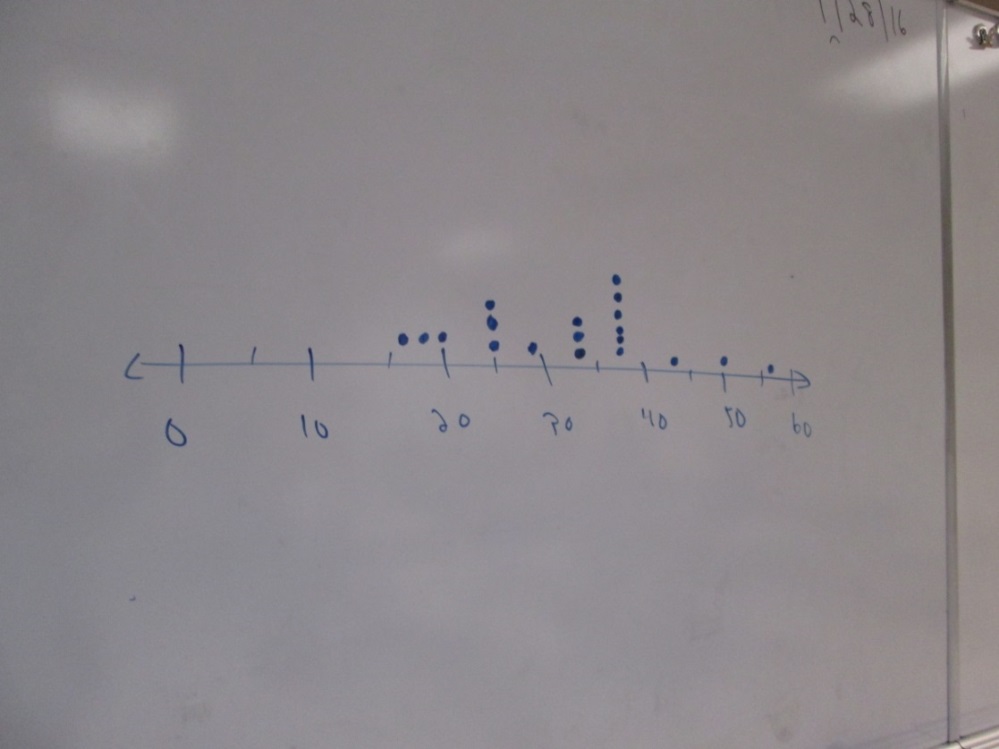
The first picture shows the role-playing cards being used by students to guess the actual unemployment rate after they saw the sampling distribution on the board, which is shown on the second picture (see below).
How would you use a sampling distribution to measure unemployment? Students at Lee Middle and High School, in Lee, Massachusetts, recently learned this lesson with some help from the American Institute for Economic Research.
Teachers who participated in AIER’s Teach-the-Teachers Initiative are field testing their lesson ideas. On January 28, we visited Lee to observe the AP Statistics class taught by Thomas McCormack. Prior to our visit, Mr. McCormack assigned each of his 20 students a labor force status (for instance, a retiree, a full-time student, a laid-off person). In addition, each student was given a randomly generated list of 10 of their classmates. This was an attempt to replicate the Bureau of Labor Statistics’ monthly survey when they use random digit dialing. Thus, each student had a sample of 10 students and was told to record the labor force status of each student in their sample. Then each student calculated the unemployment rate for their sample by dividing the number of unemployed by the number of people in the labor force, which is the sum of employed and unemployed. So each student obtained one number to represent the unemployment rate for their sample.
During the class period each student came up to the white board and put their unemployment rate statistic on a number line. As a whole, the class created a dot plot of 20 unemployment rates. Of course, each of the 20 unemployment rates was different, and represented a distribution of unemployment rates in 20 possible samples. This is exactly the definition of the sampling distribution! It was visual, it was understandable to the students, and it was cool!
Mr. McCormack then posed the question: “We have only one true number of the unemployment rate in this population, but we have all these dots here…. Why do you think that is?” The students discussed the concepts of a “range,” a “mean,” and a “standard deviation.” The teacher went on to describe the normal distribution and its properties.
Based on the sampling distribution of the unemployment rate depicted on the board (in this class we had rates that were as low as 17% and as high as 57%), students predicted the unemployment rate for the whole population and then compared this prediction with the actual unemployment rate defined by the teacher for this activity. This helped them to see that, even though there was one true unemployment rate for the population (33%), individual samples can vary quite a bit. The class discussed the reasons for the “errors” and proposed ways to minimize them, such as using a larger sample, for example.
This creative lesson required students to actively engage with the concepts of an unemployment rate and a sampling distribution. In addition to employing the inquiry-based method, it allowed the infusion of economic concepts into a statistics class, promoting an interdisciplinary approach to teaching and learning. All of these things are important for building college- and career-readiness skills among high school students. We are happy that our program helped Mr. McCormack to create such a stimulating lesson.
We are offering three workshops for teachers during the Summer 2016. Visit our Web site to learn more and to register for the program: https://www.aier.org/teach-teachers.