Business Conditions Monthly August 2023

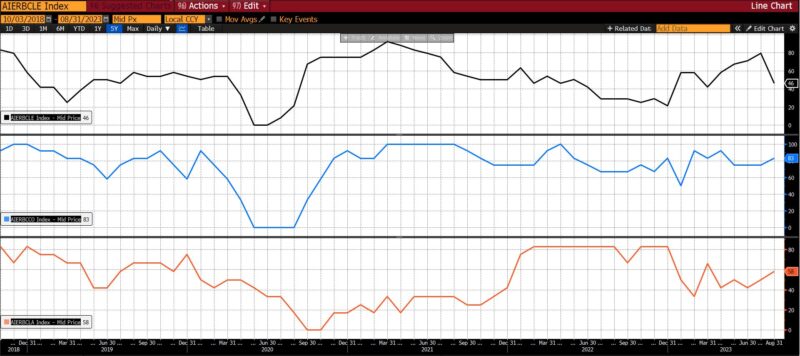
In August 2023, the Leading Indicator in AIER’s Business Condition Monthly metrics fell sharply. While the Roughly Coincident and Lagging Indicators edged up slightly (from 75 to 83 in the former, and from 50 to 58 in the latter), the Leading Indicator fell from 79 in July 2023 to 46 in August 2023.
AIER Business Conditions Monthly (5 years)
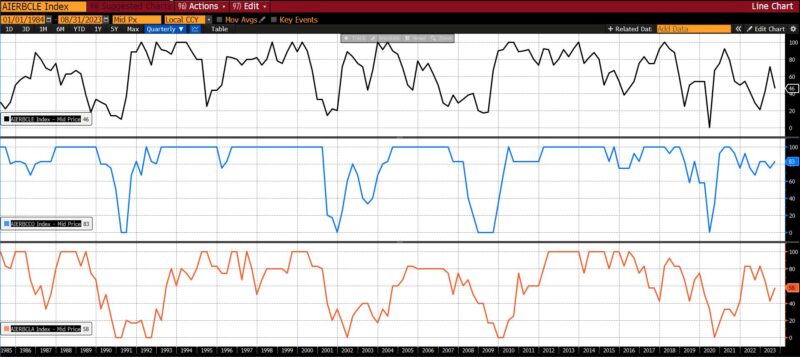
AIER Business Conditions Monthly (1985 – present)
Leading Indicators (46)
With the decline from 79 to 46, the Leading Indicator is at its lowest level since March 2023. This is the largest month-to-month decline in this indicator since it fell from 33 in April 2020 to 0 in May 2020.
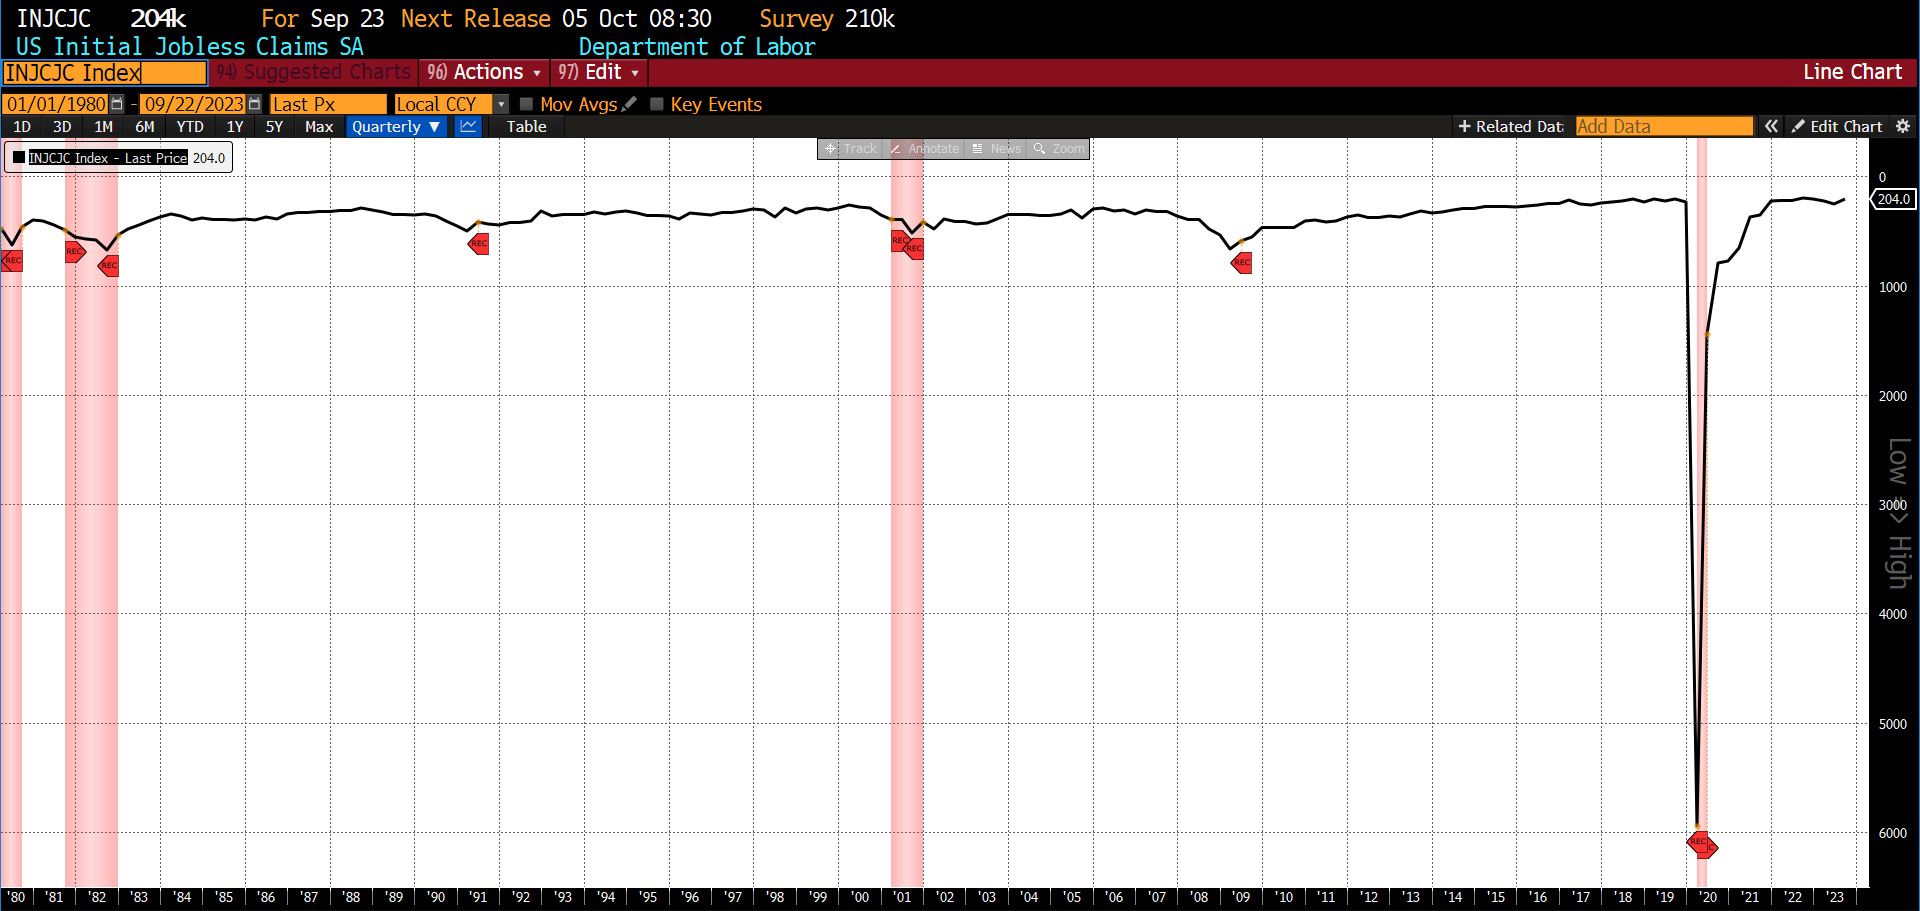
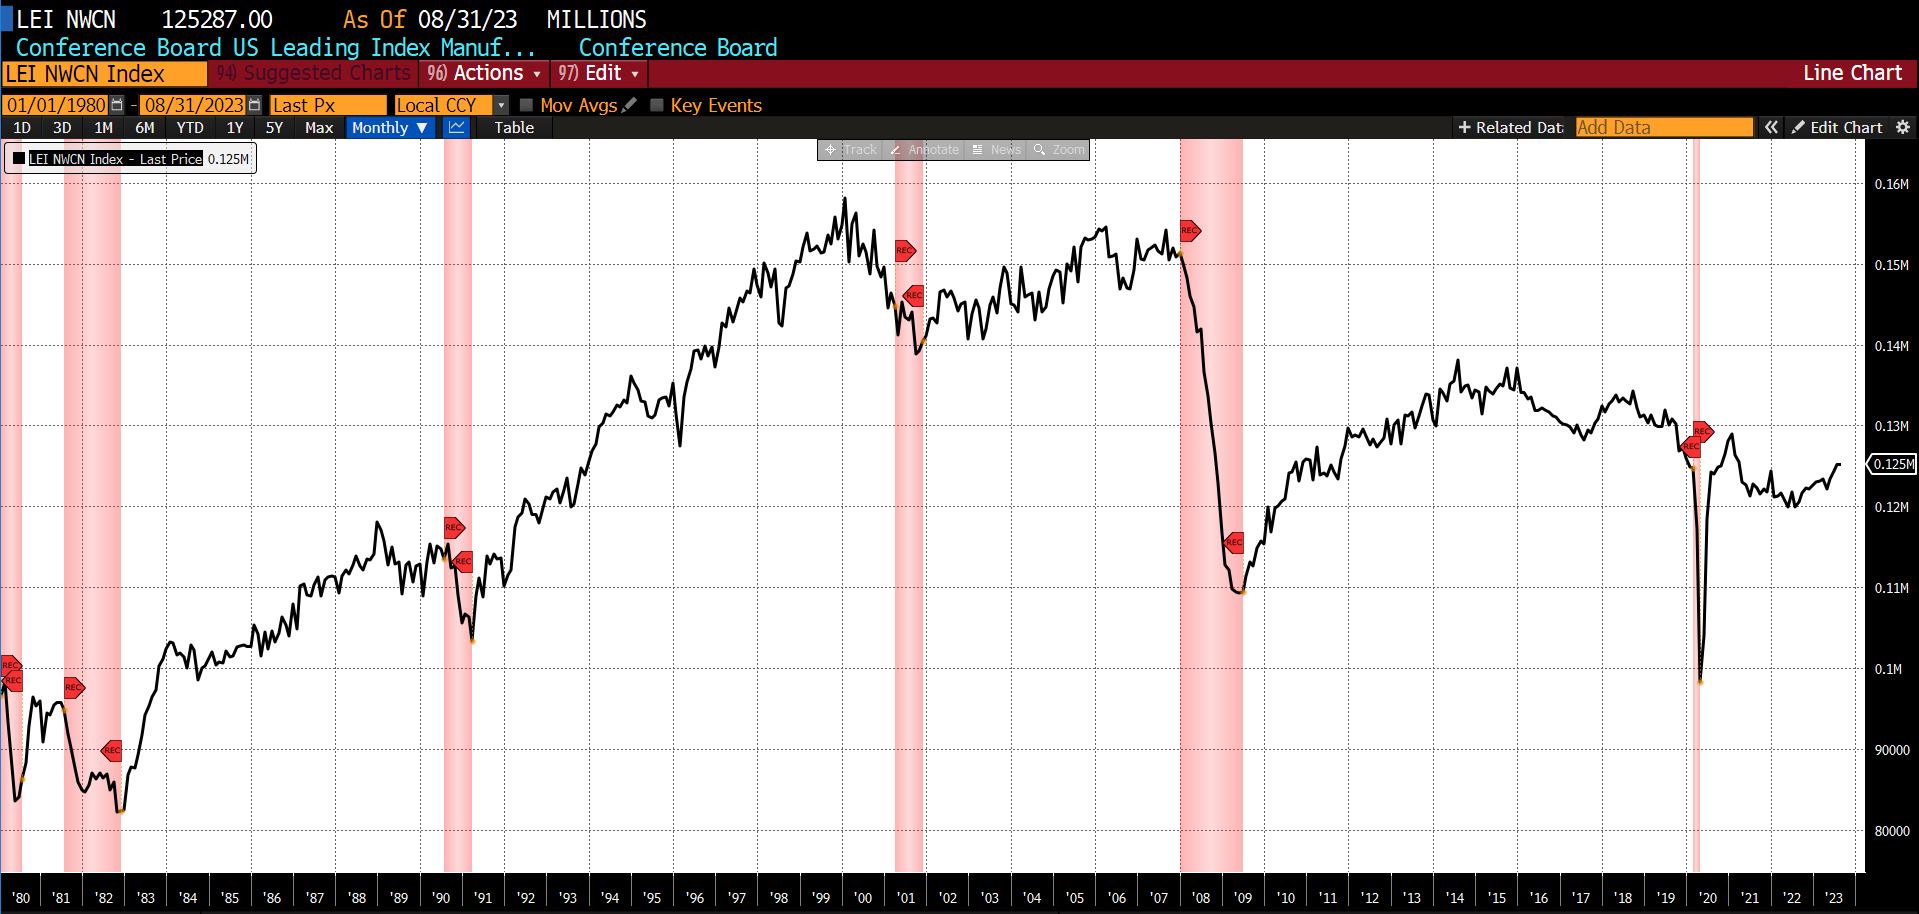
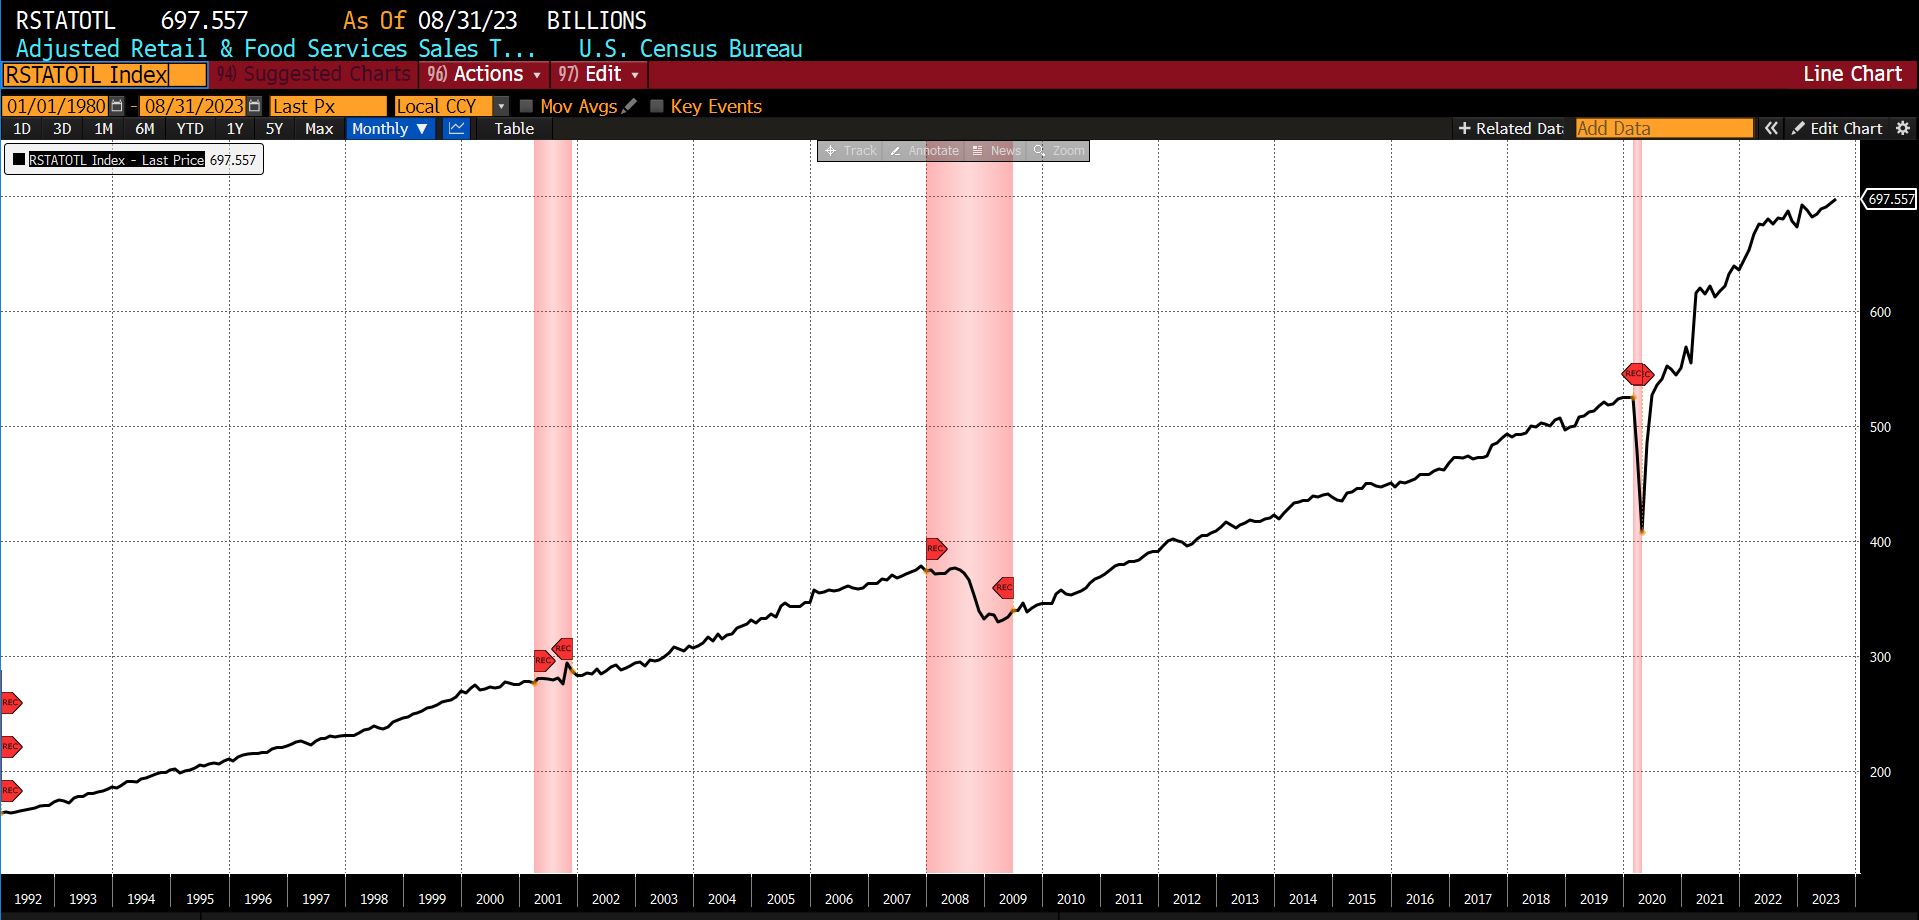
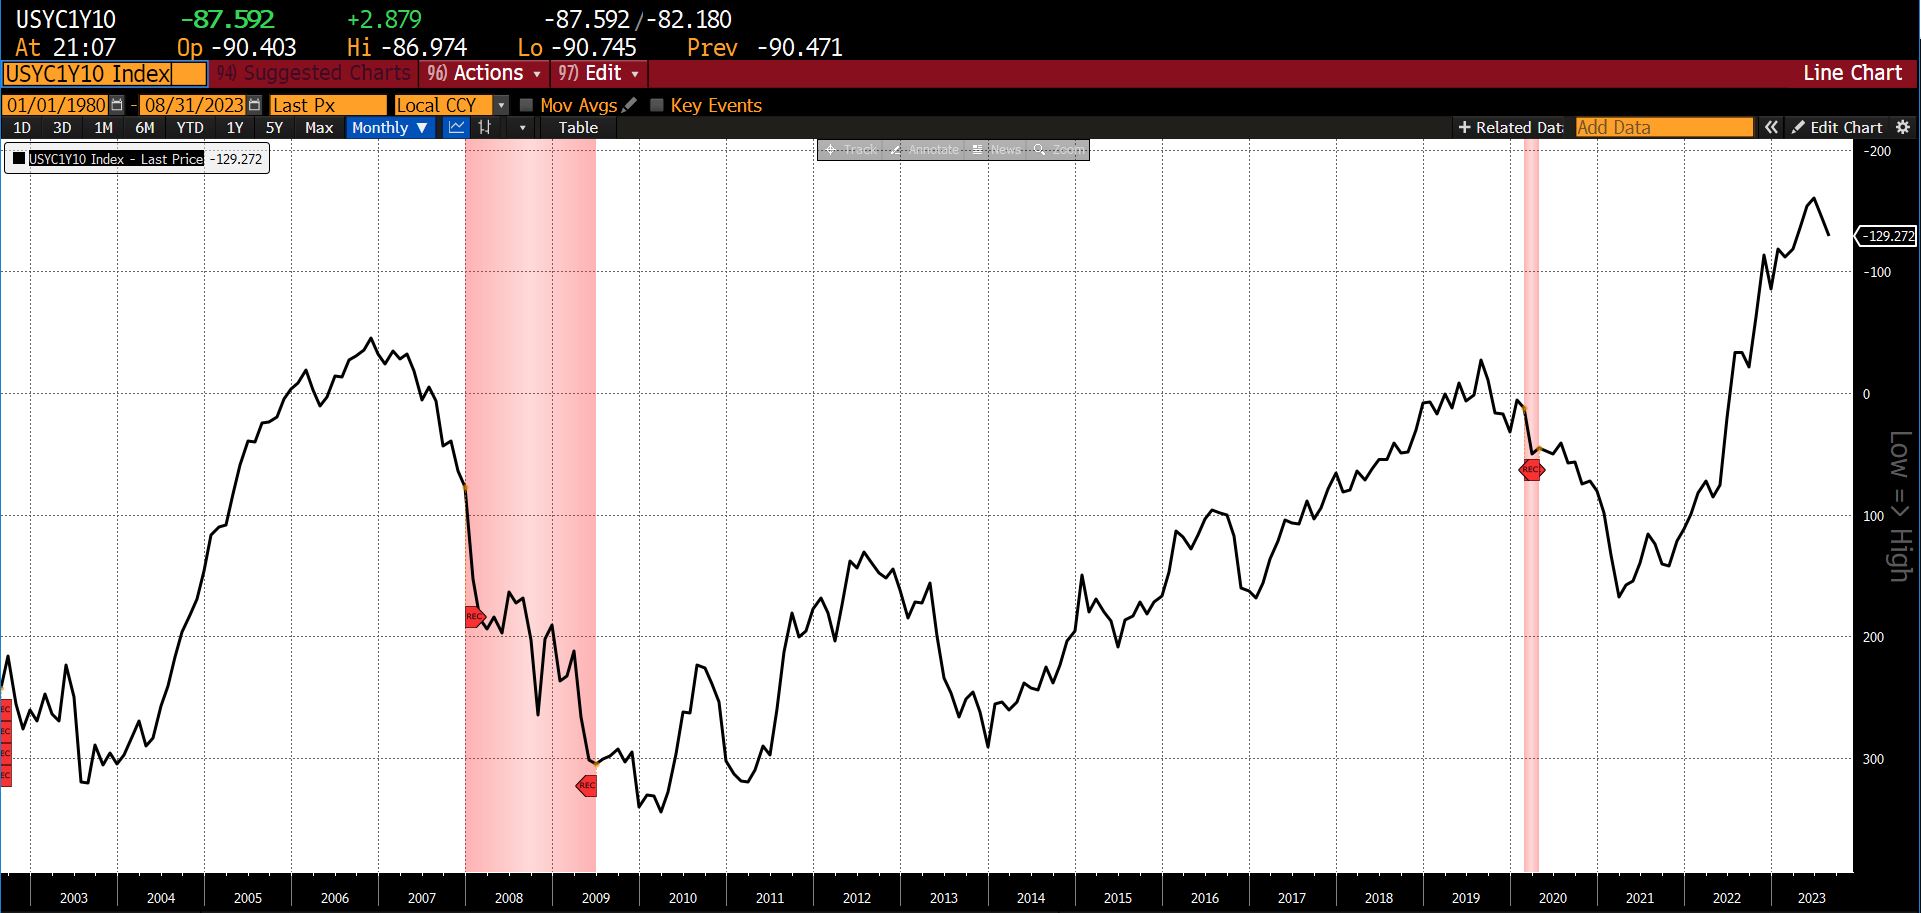
Five of the twelve constituents rose, six declined, and one was unchanged/neutral. Rising from July to August 2023 were the US Initial Jobless Claims (8.73 percent), the Conference Board’s US Leading Index of Manufacturers New Orders, Consumers Goods, and Materials (0.07 percent), the Conference Board’s US Manufacturers New Orders of Capital Goods Excluding Aircraft (0.47 percent), Adjusted Retail and Food Service Sales (0.56 percent), and the 1-to-10 year US Treasury spread (10.12 percent).
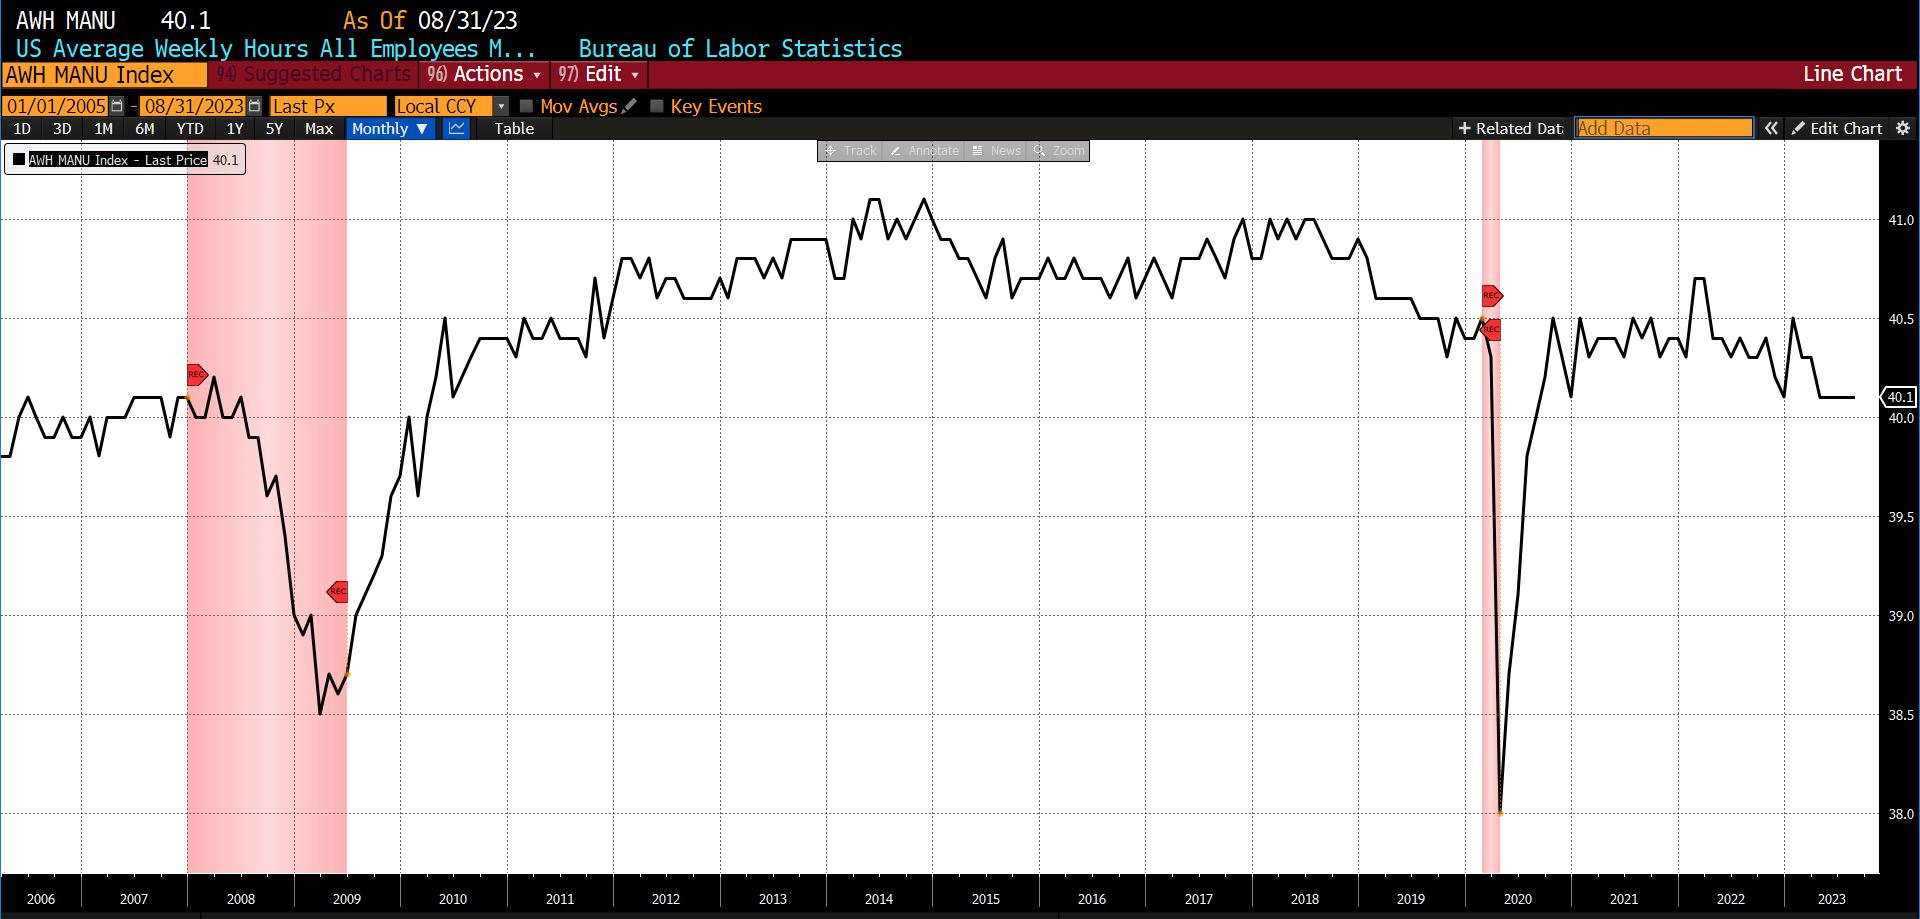
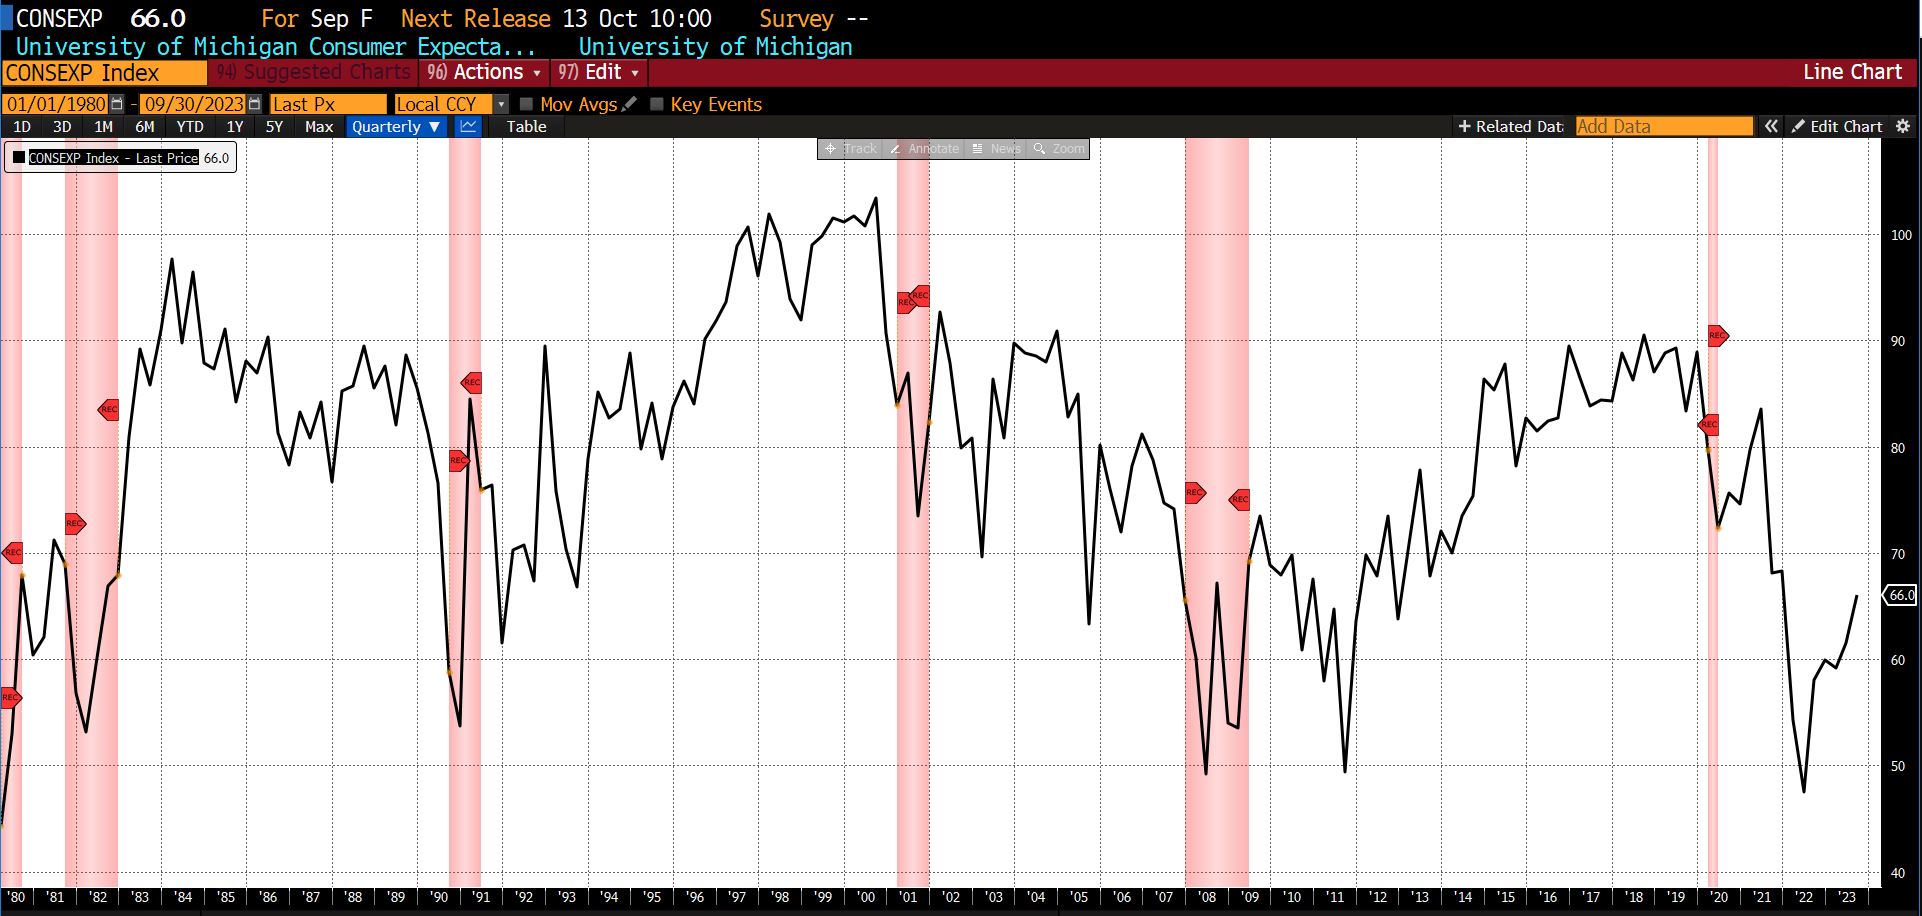
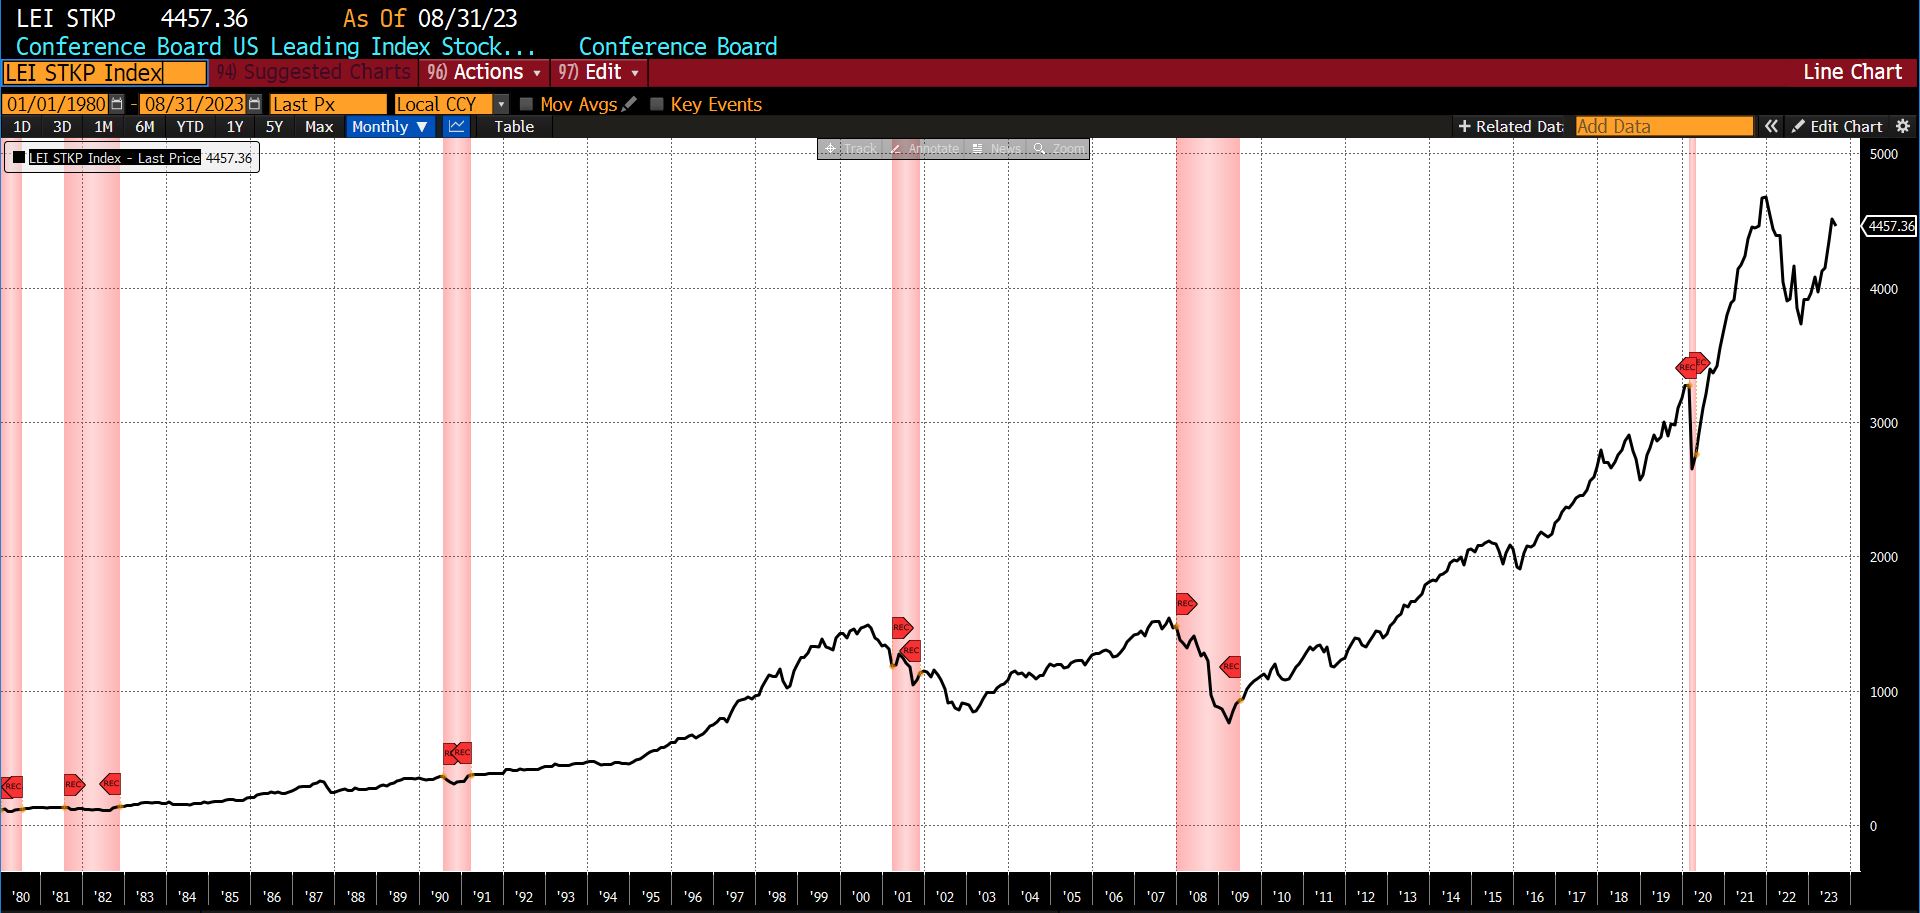
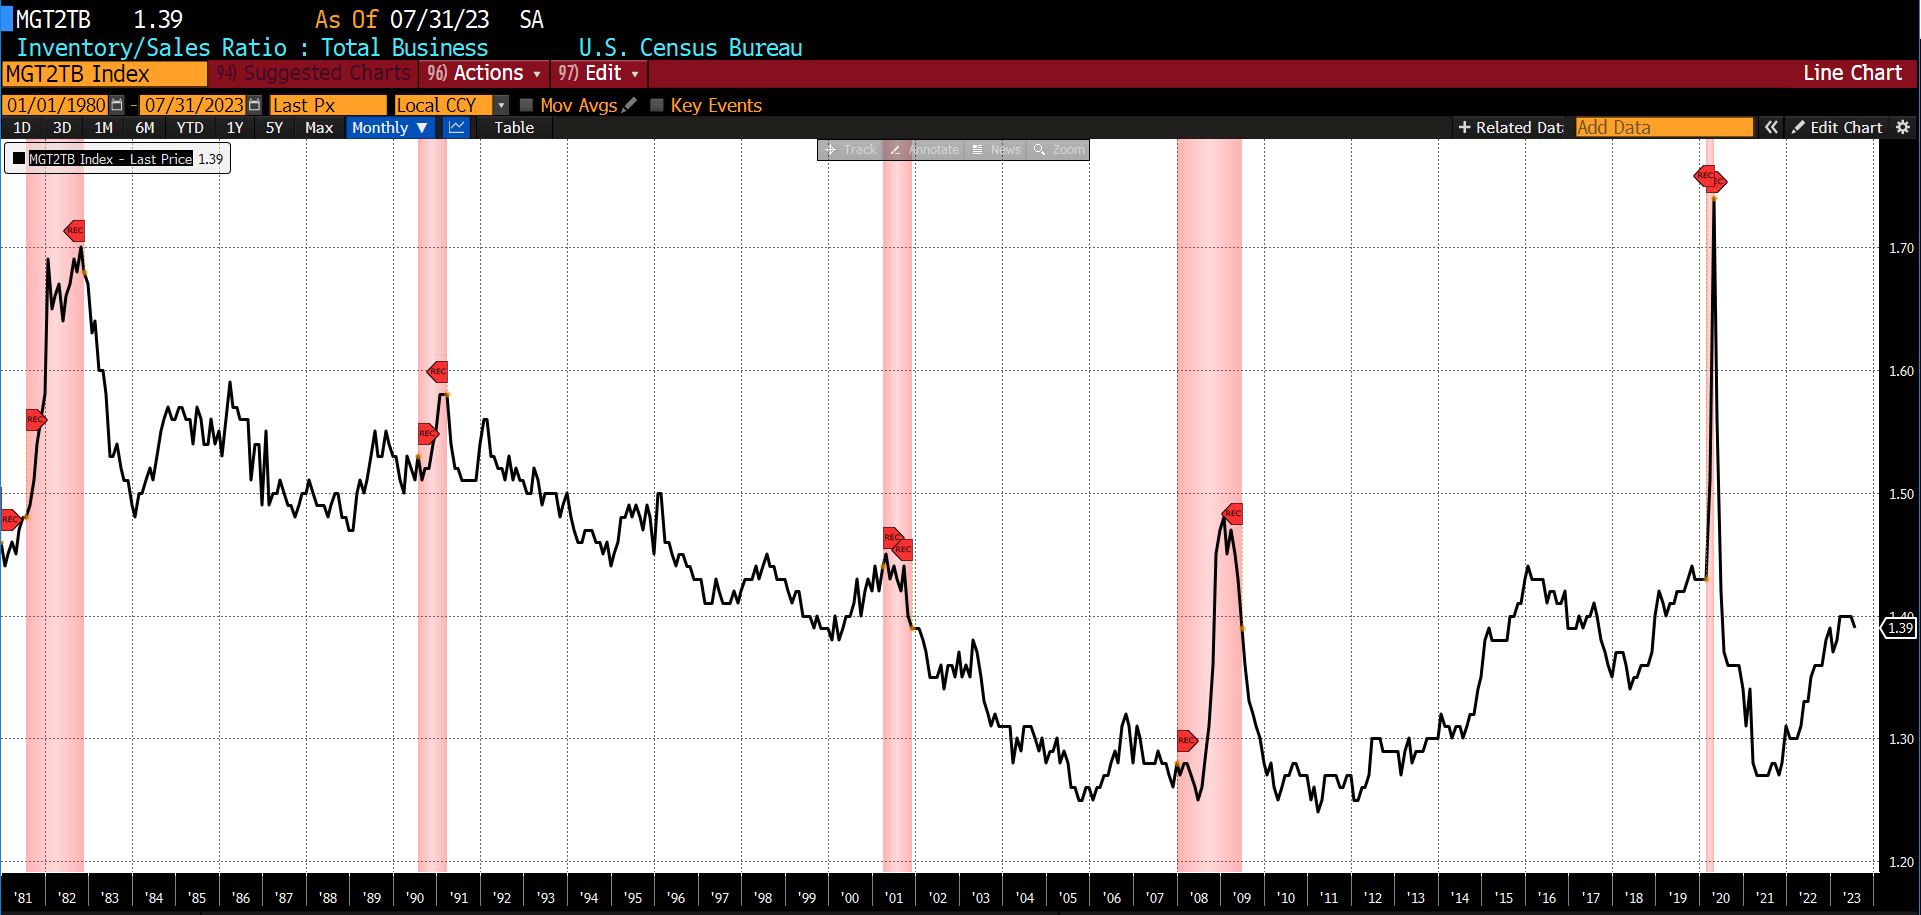
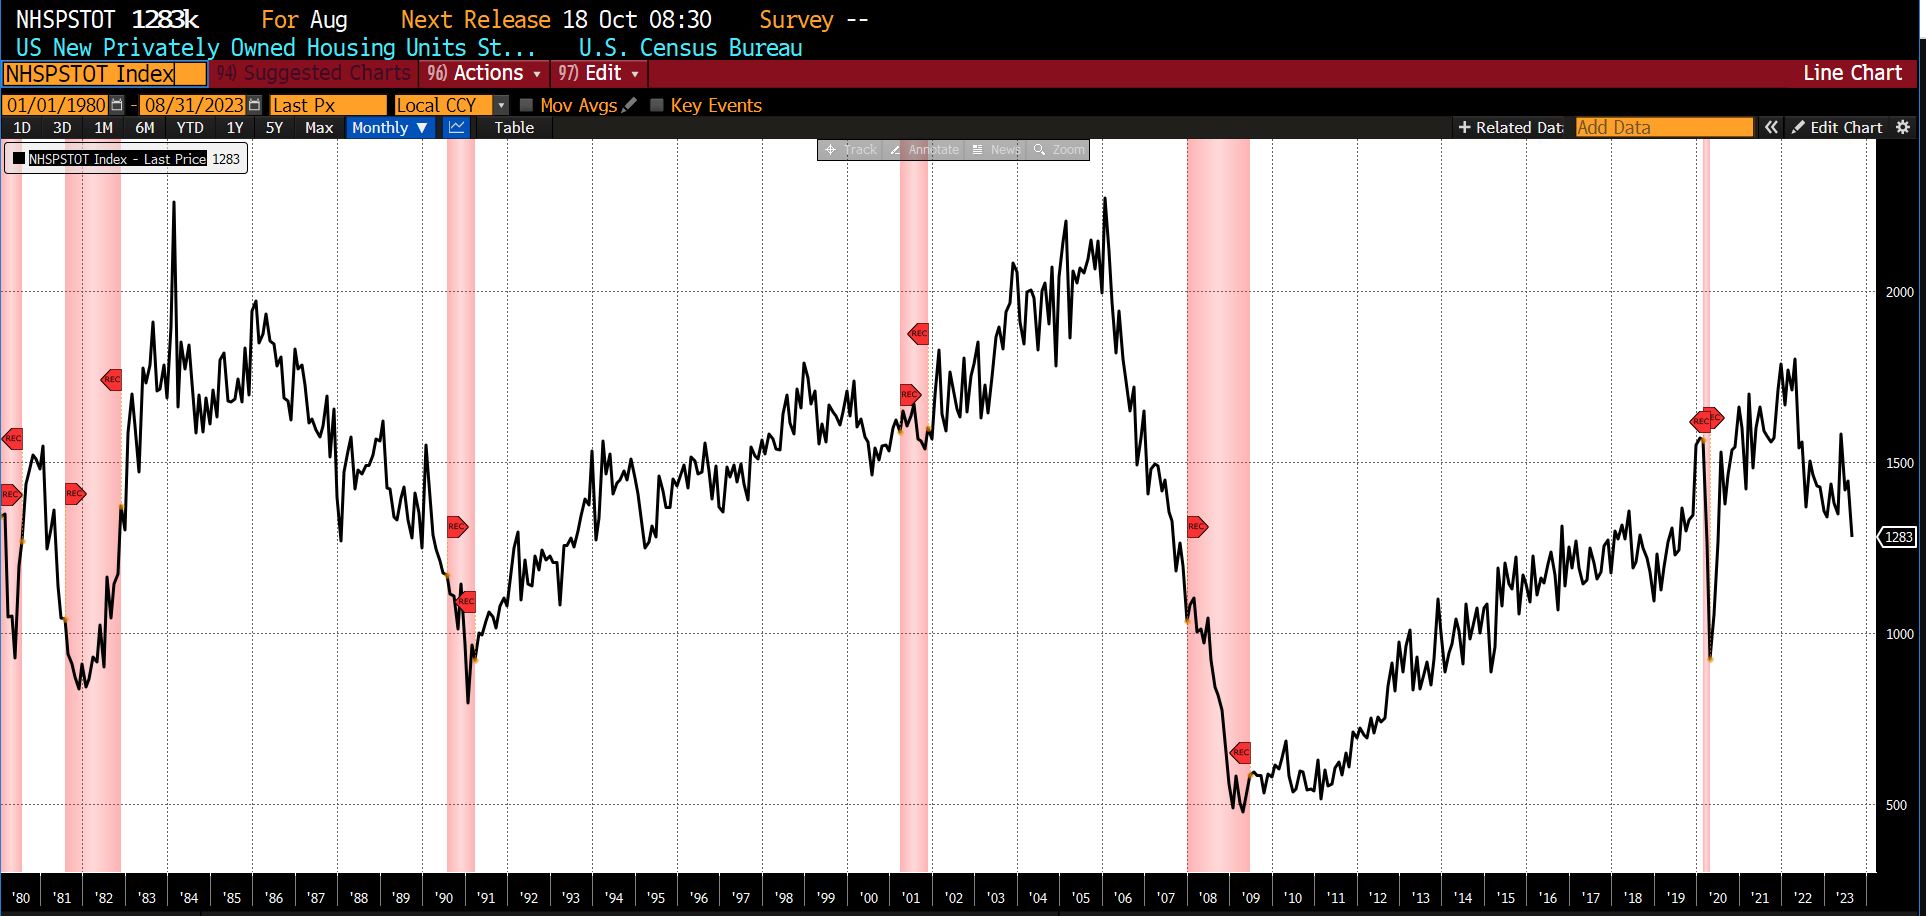
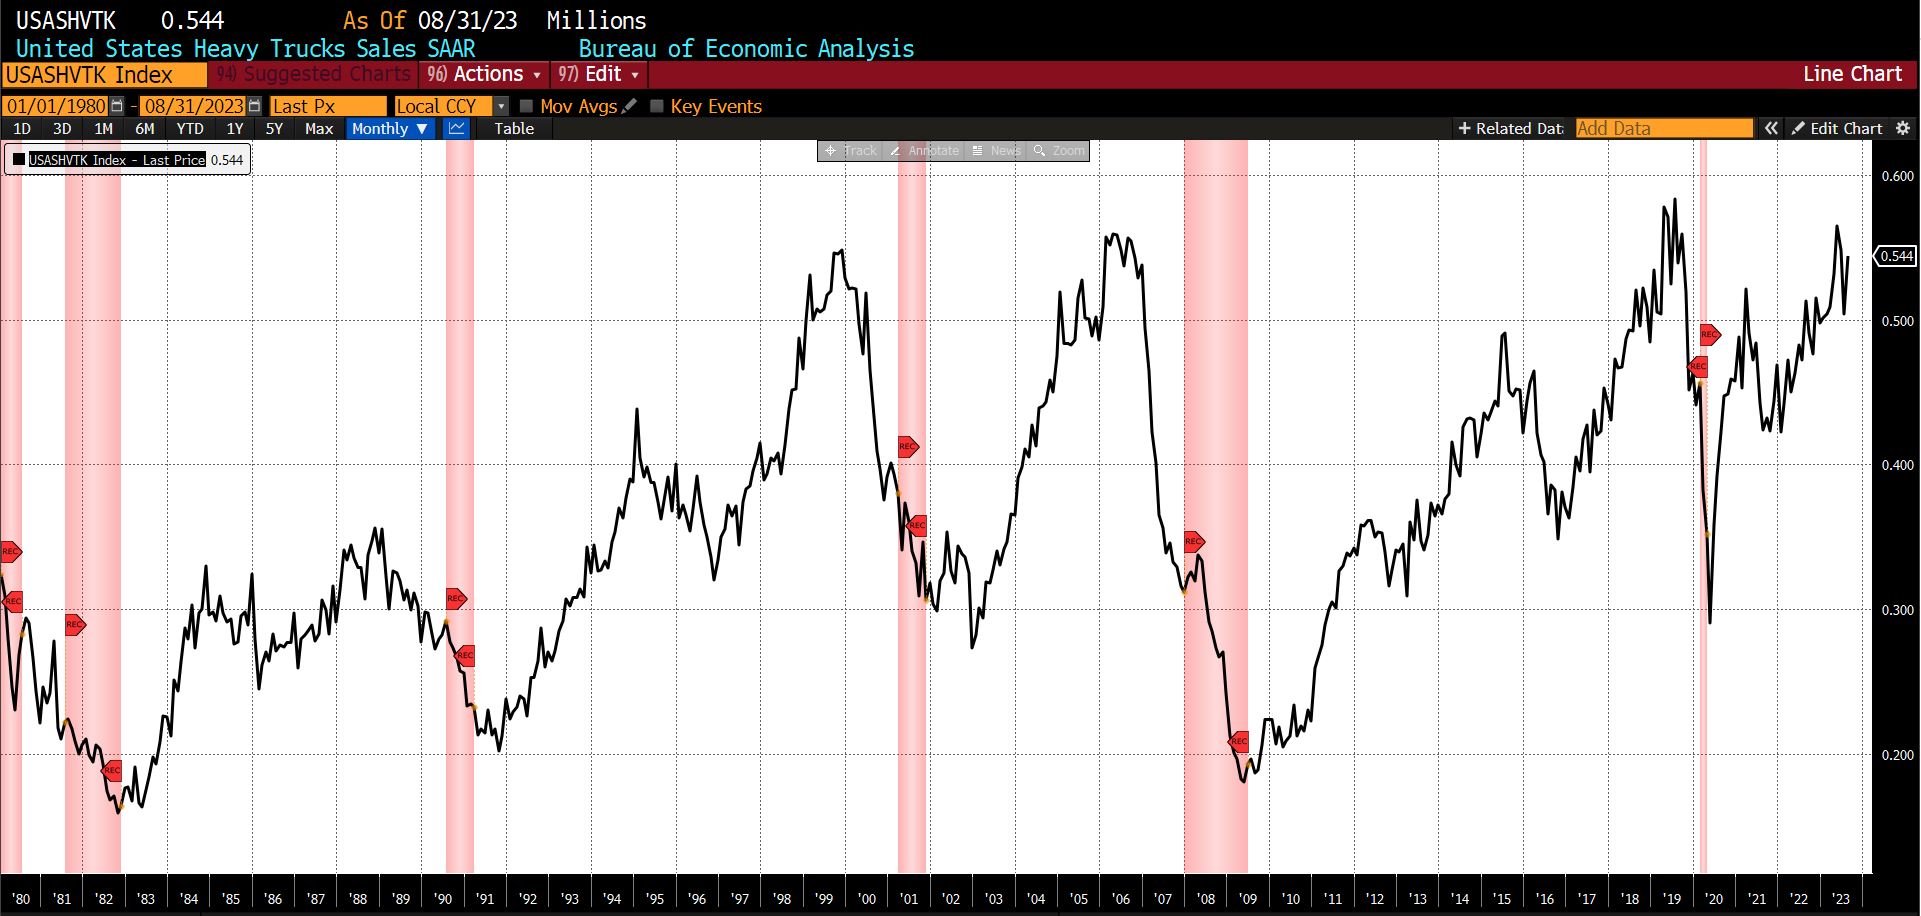
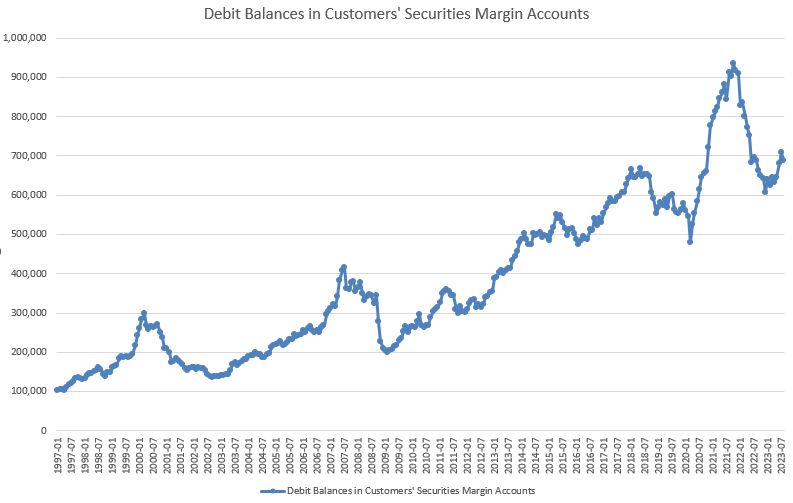
Declining from July to August 2023 were the University of Michigan Consumer Expectations Index (-4.10 percent), the Conference Board’s US Leading Index of 500 Stock Prices (-1.13 percent), the US Census Bureau’s Inventory/Sales Ratio Total Business (-0.71 percent), US New Privately Owned Housing Units Starts (-11.64 percent), United States Heavy Truck Sales (-1.92 percent), and FINRA Debt Balances in Margin Accounts (-2.91 percent). US Average Weekly Hours (All Employees, Manufacturing) was unchanged.
Roughly Coincident (83) and Lagging Indicators (58)
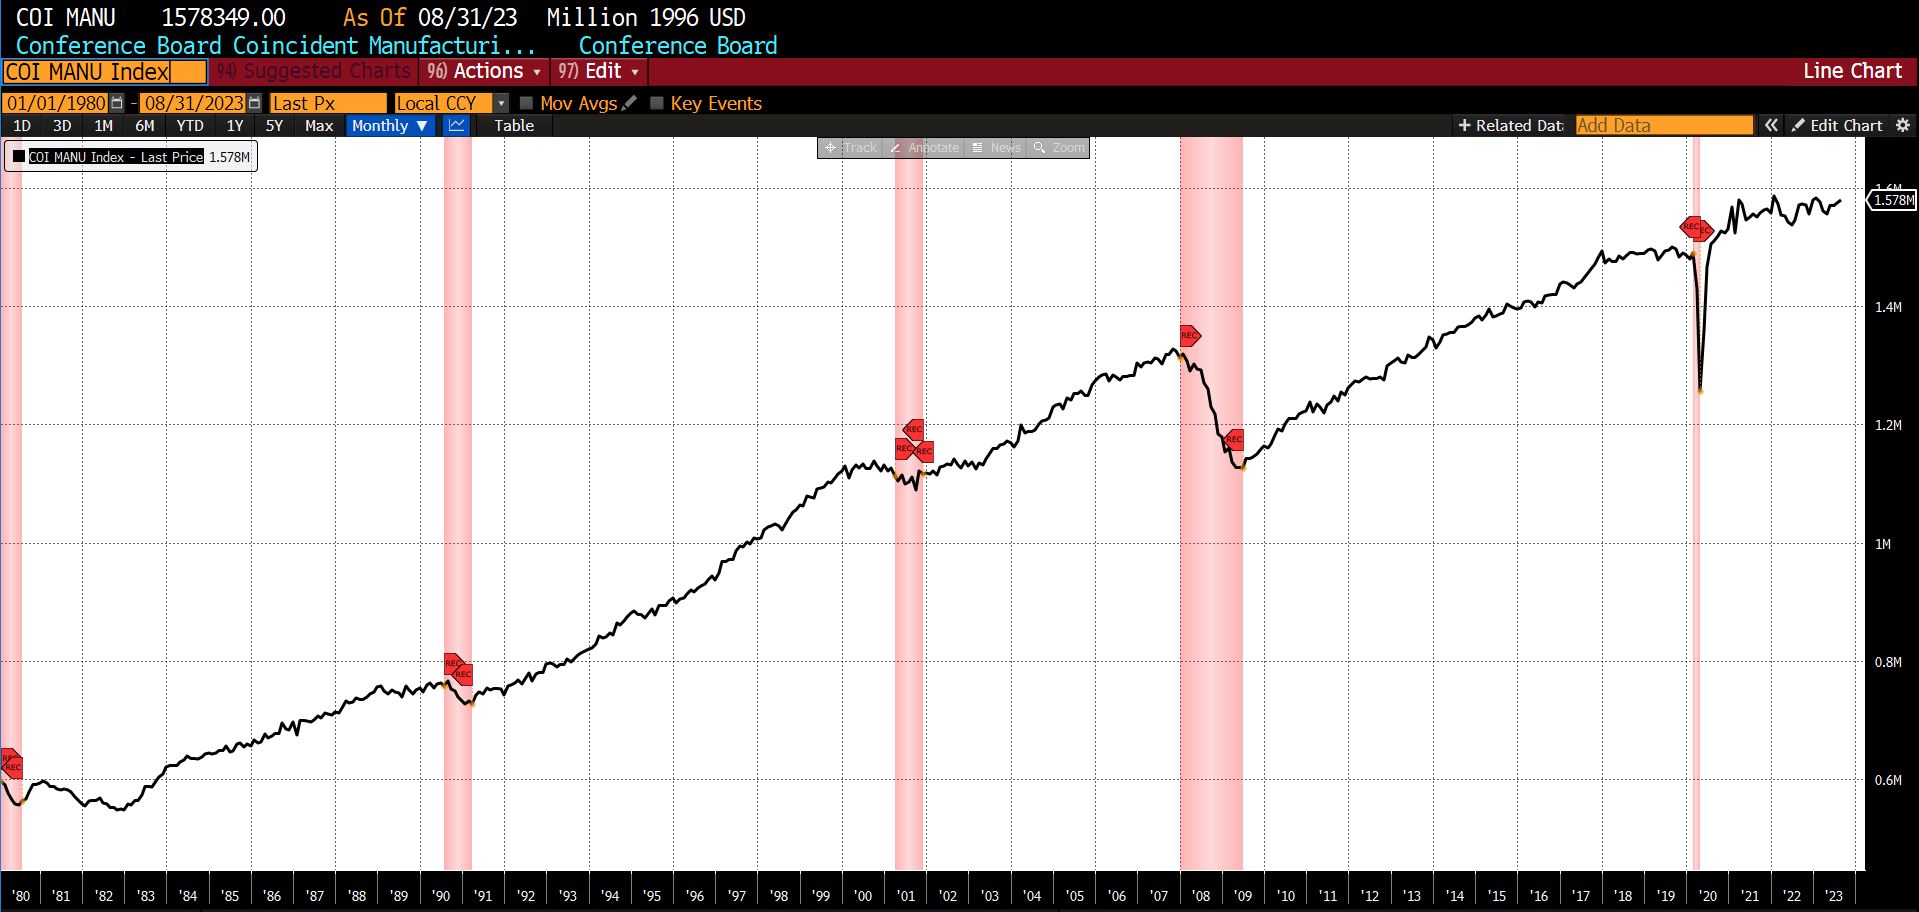
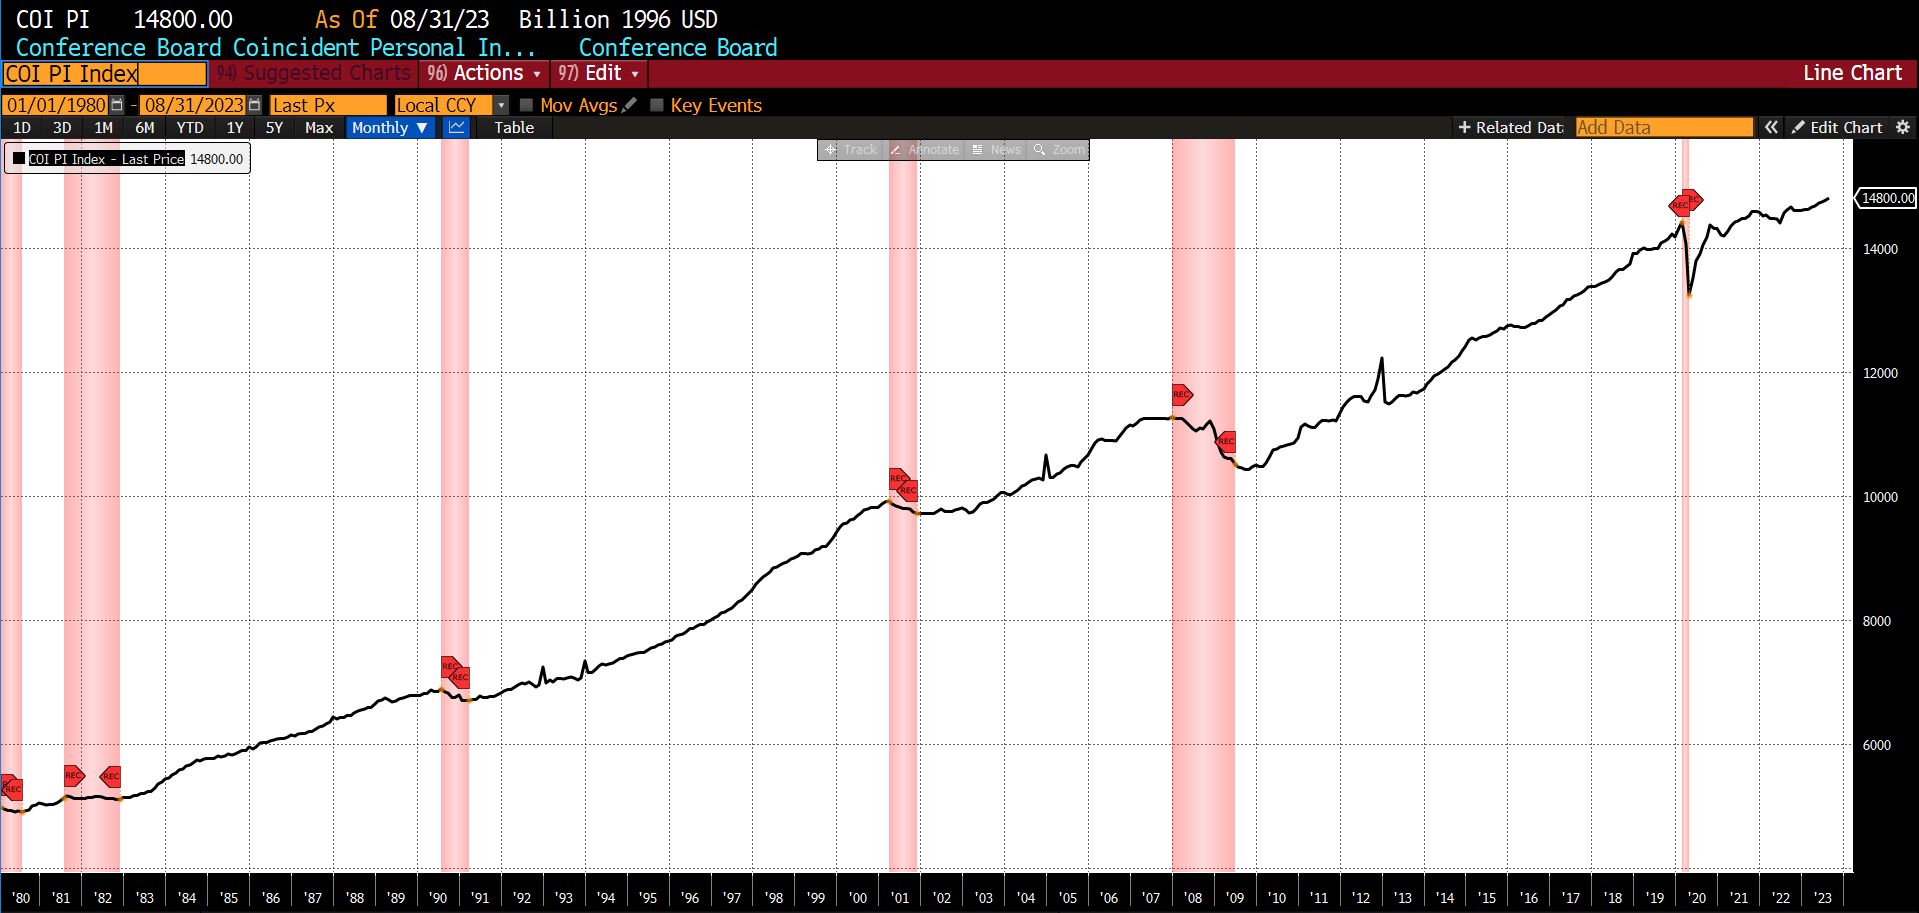
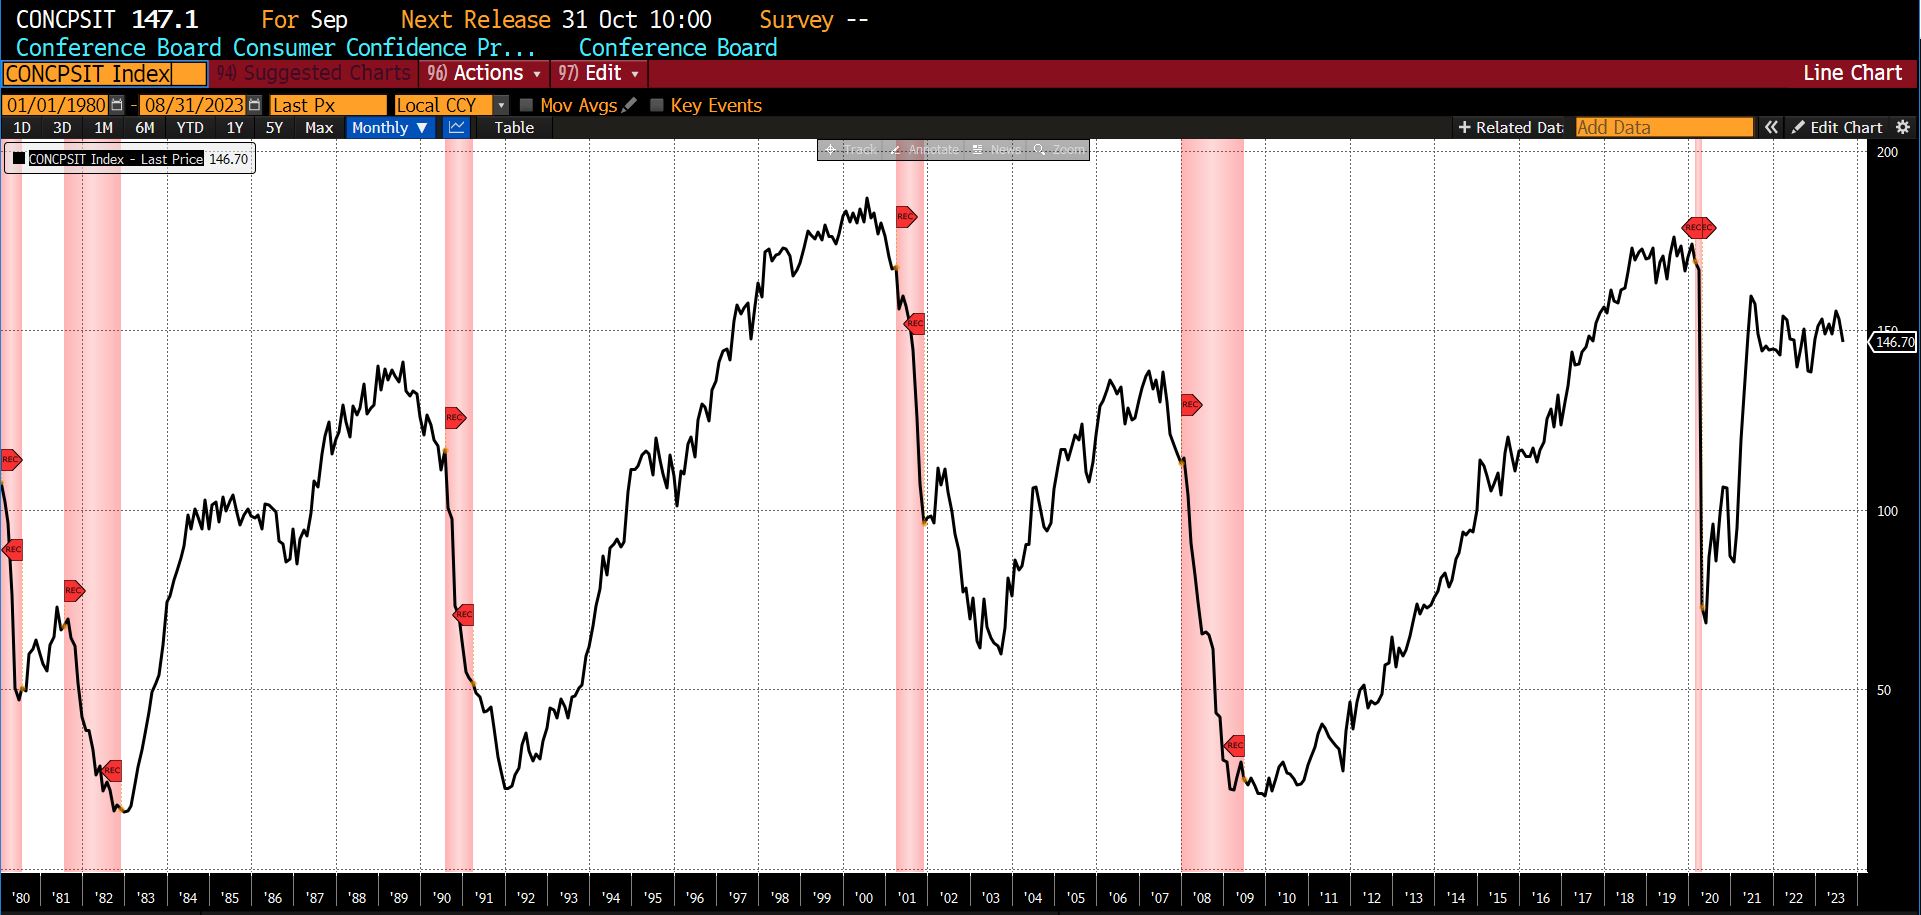
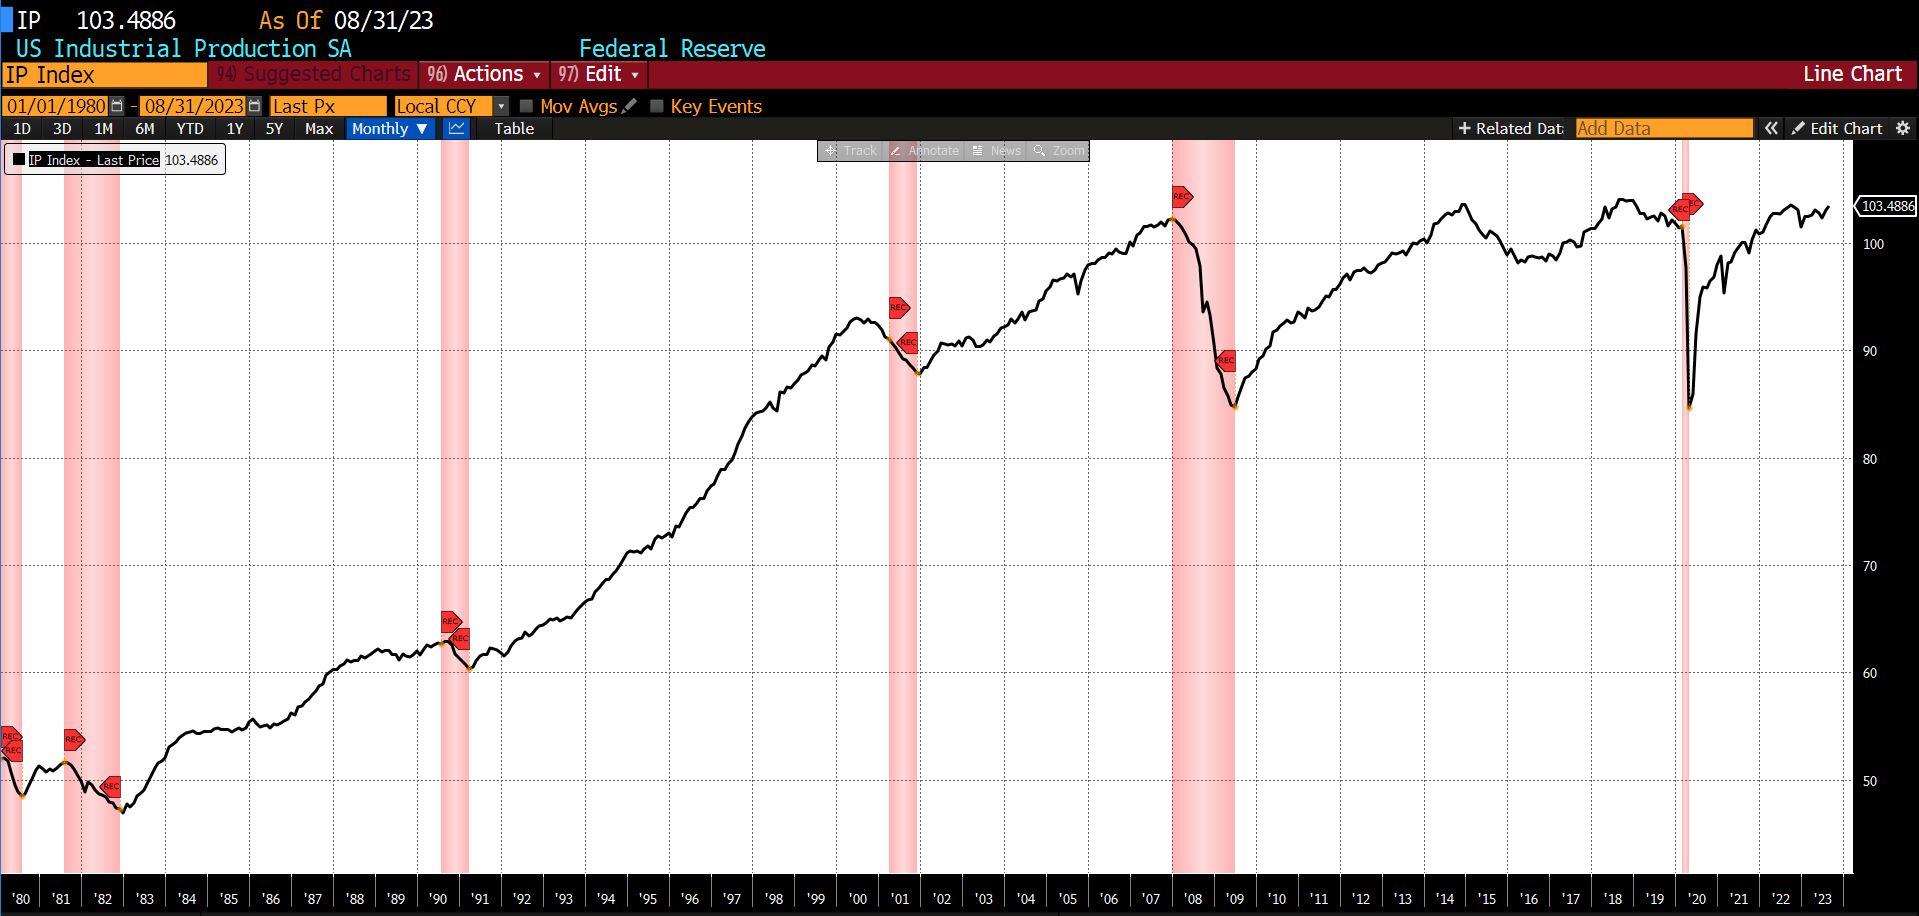
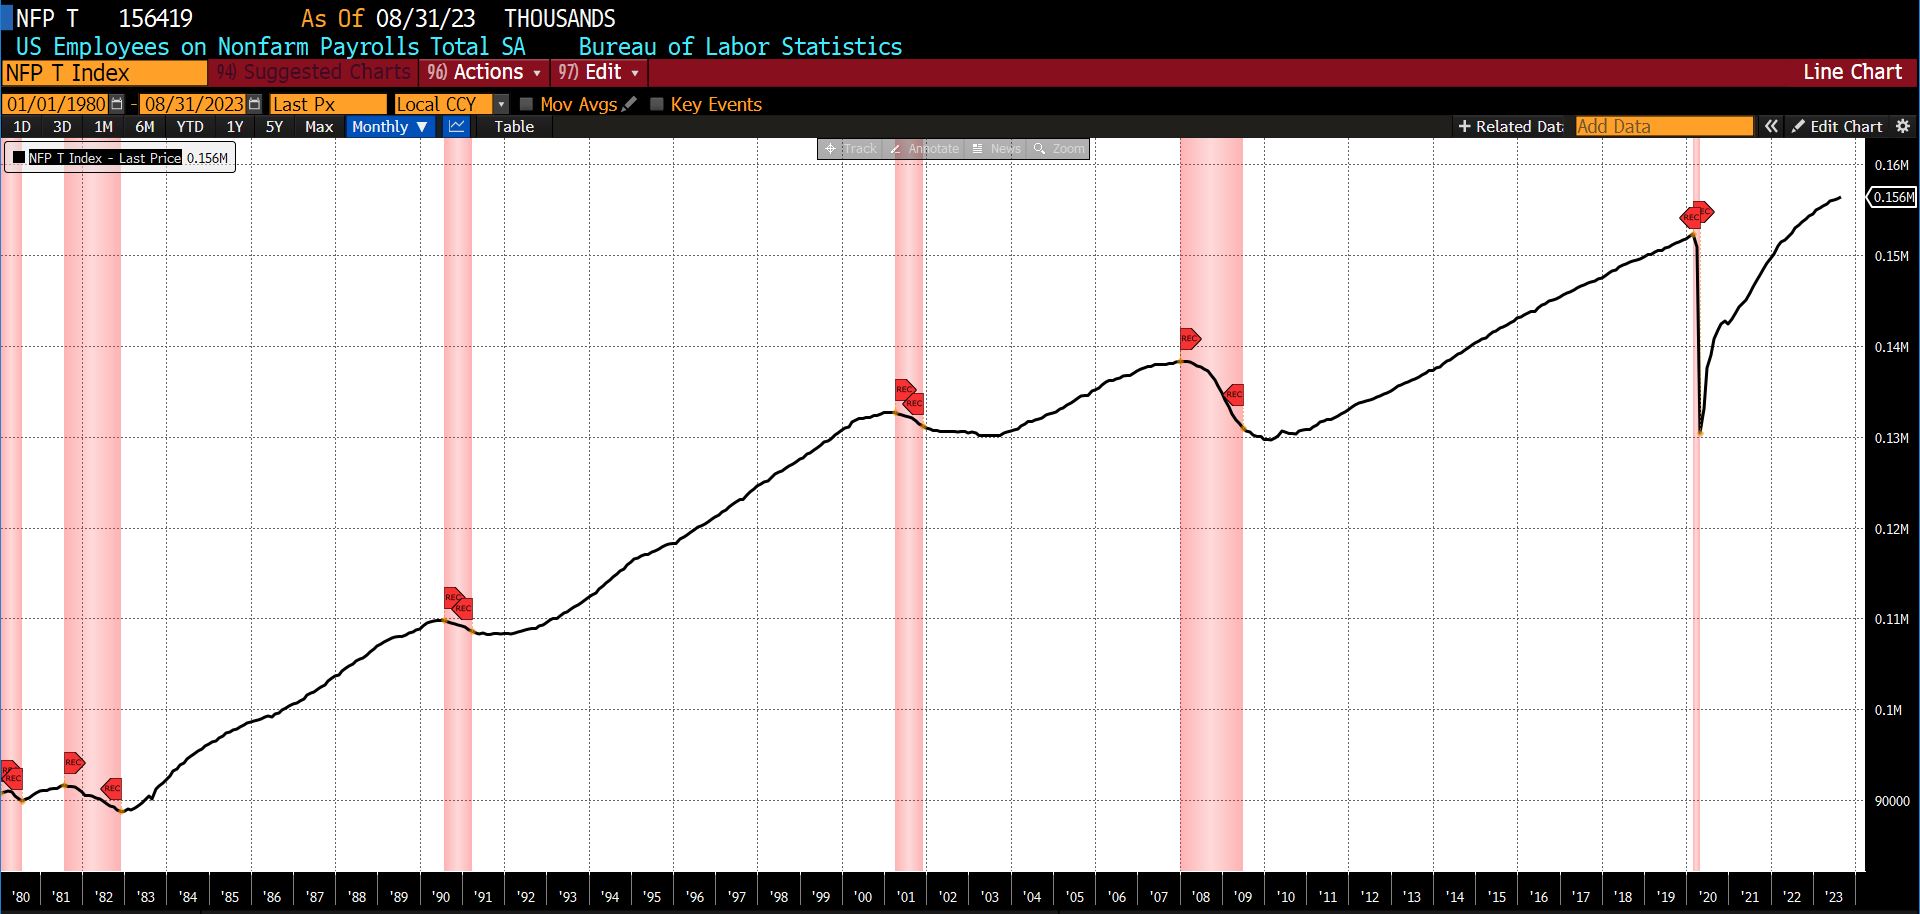
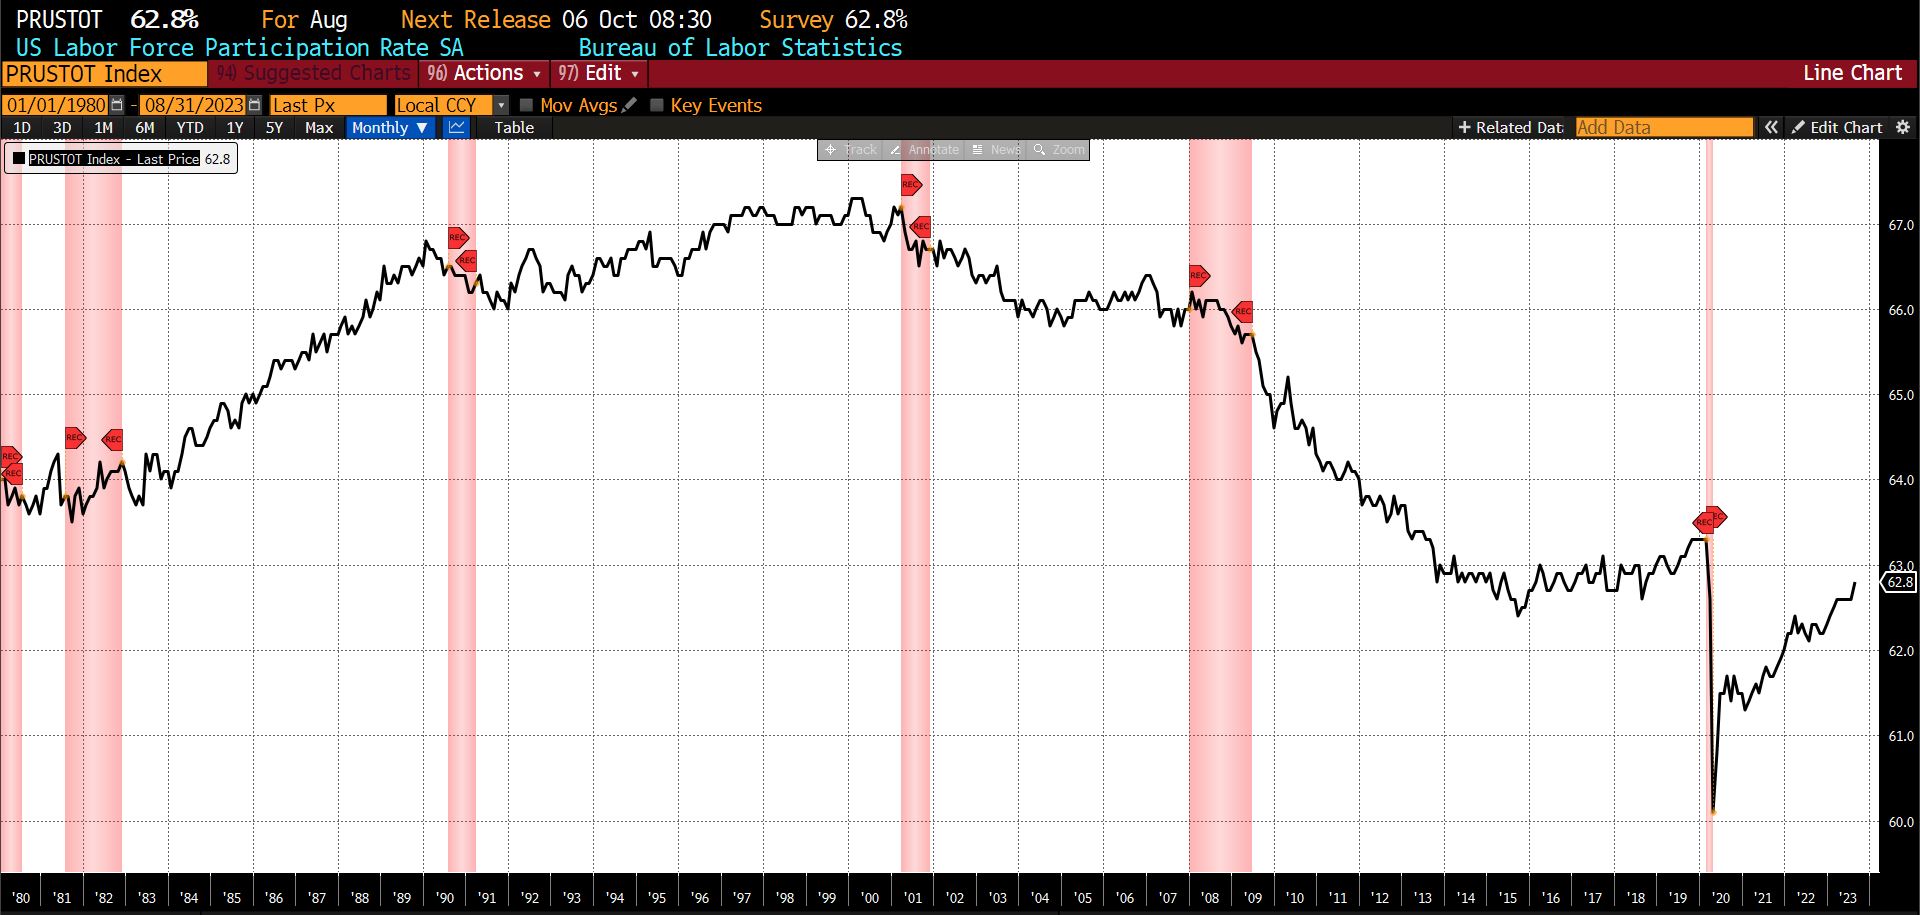
The Roughly Coincident Indicator edged up from 75 in July to 83 in August, reattaining the broadly expansionary levels seen in February (92), March (83), and April (92) of this year. Five of the constituent indices increased, with one falling. Two of the three Conference Board indices (Coincident Manufacturing and Trade Sales and Coincident Personal Income Less Transfer Payments) rose 0.19 percent and 0.24 percent, respectively. Also ticking up in August were US Industrial Production (0.38 percent), US Employees on Nonfarm Payrolls (0.12 percent), and the US Labor Force Participation Rate (0.32 percent). The Conference Board’s Consumer Confidence Present Situation declined 4.12 percent.
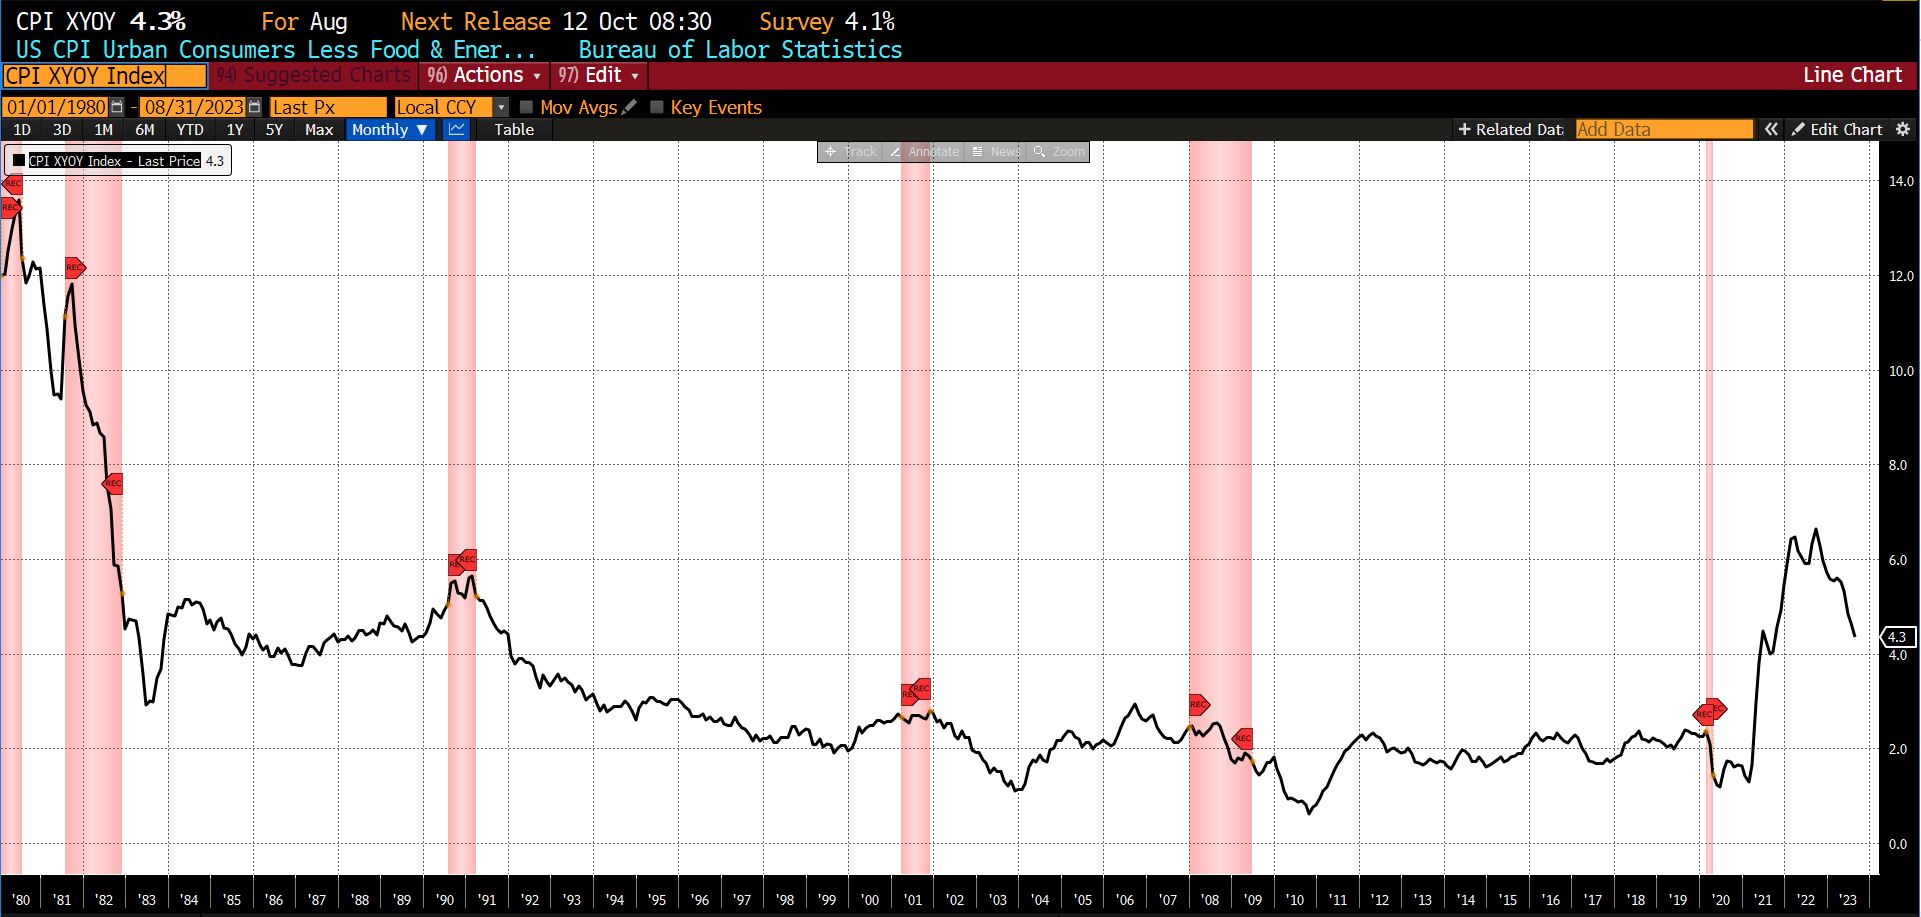
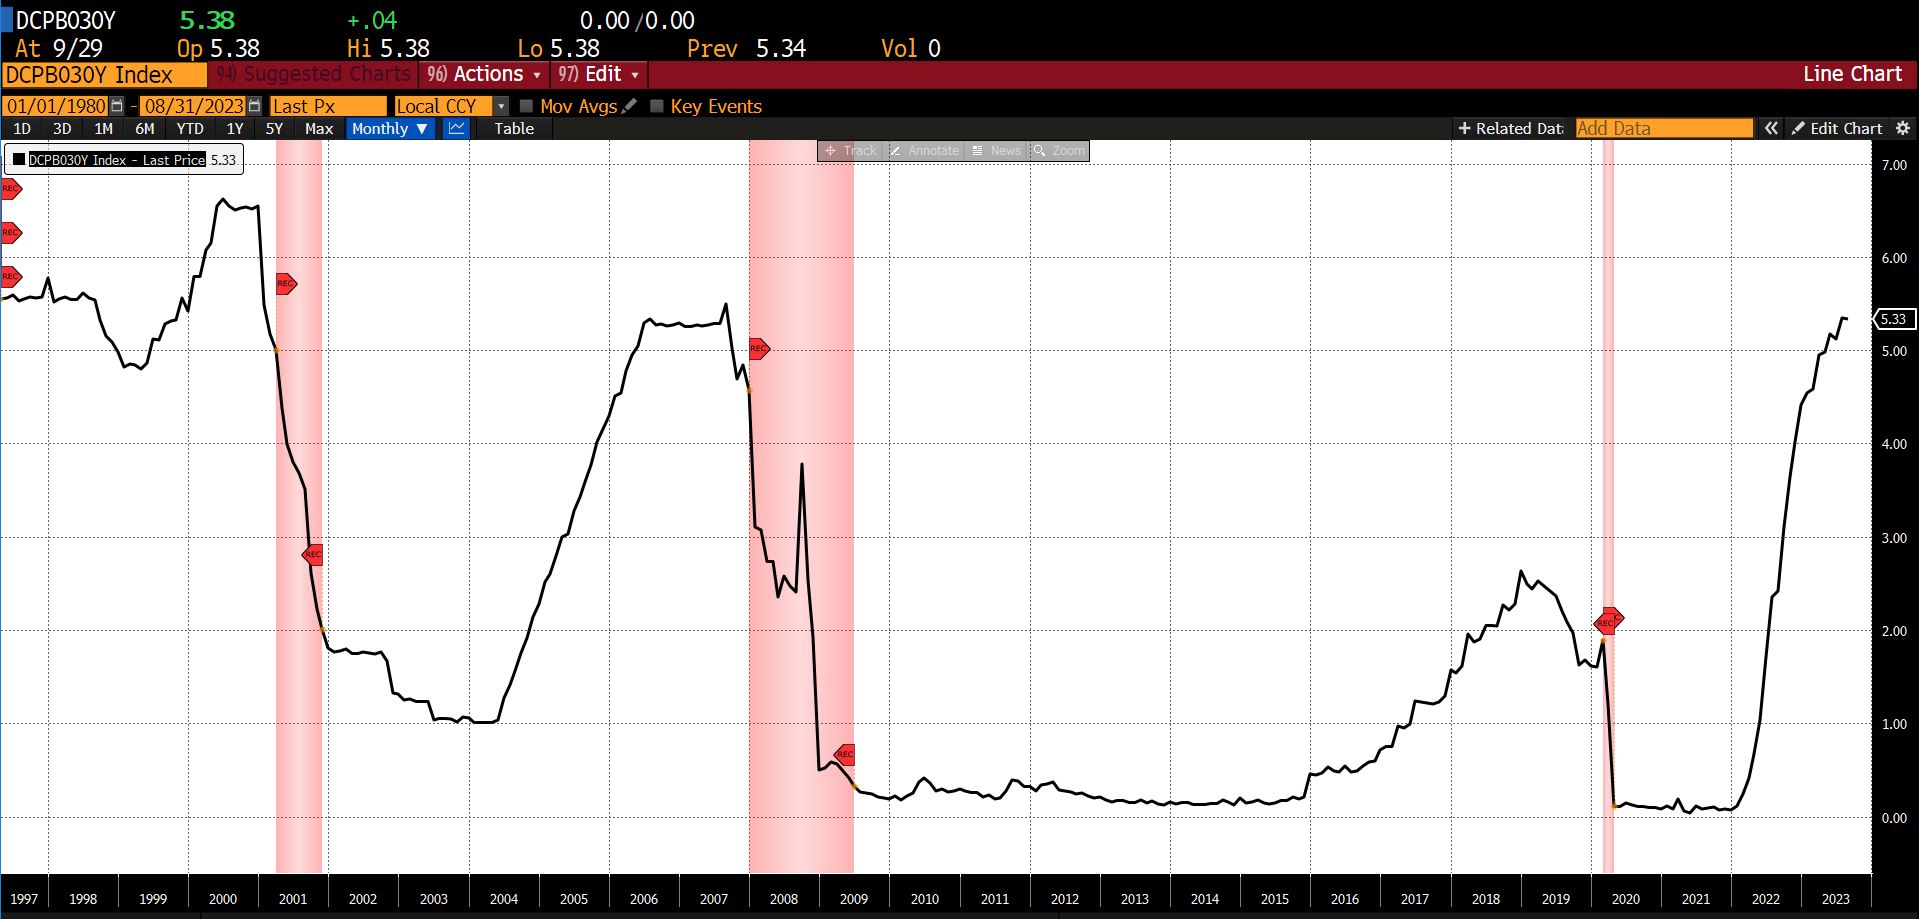
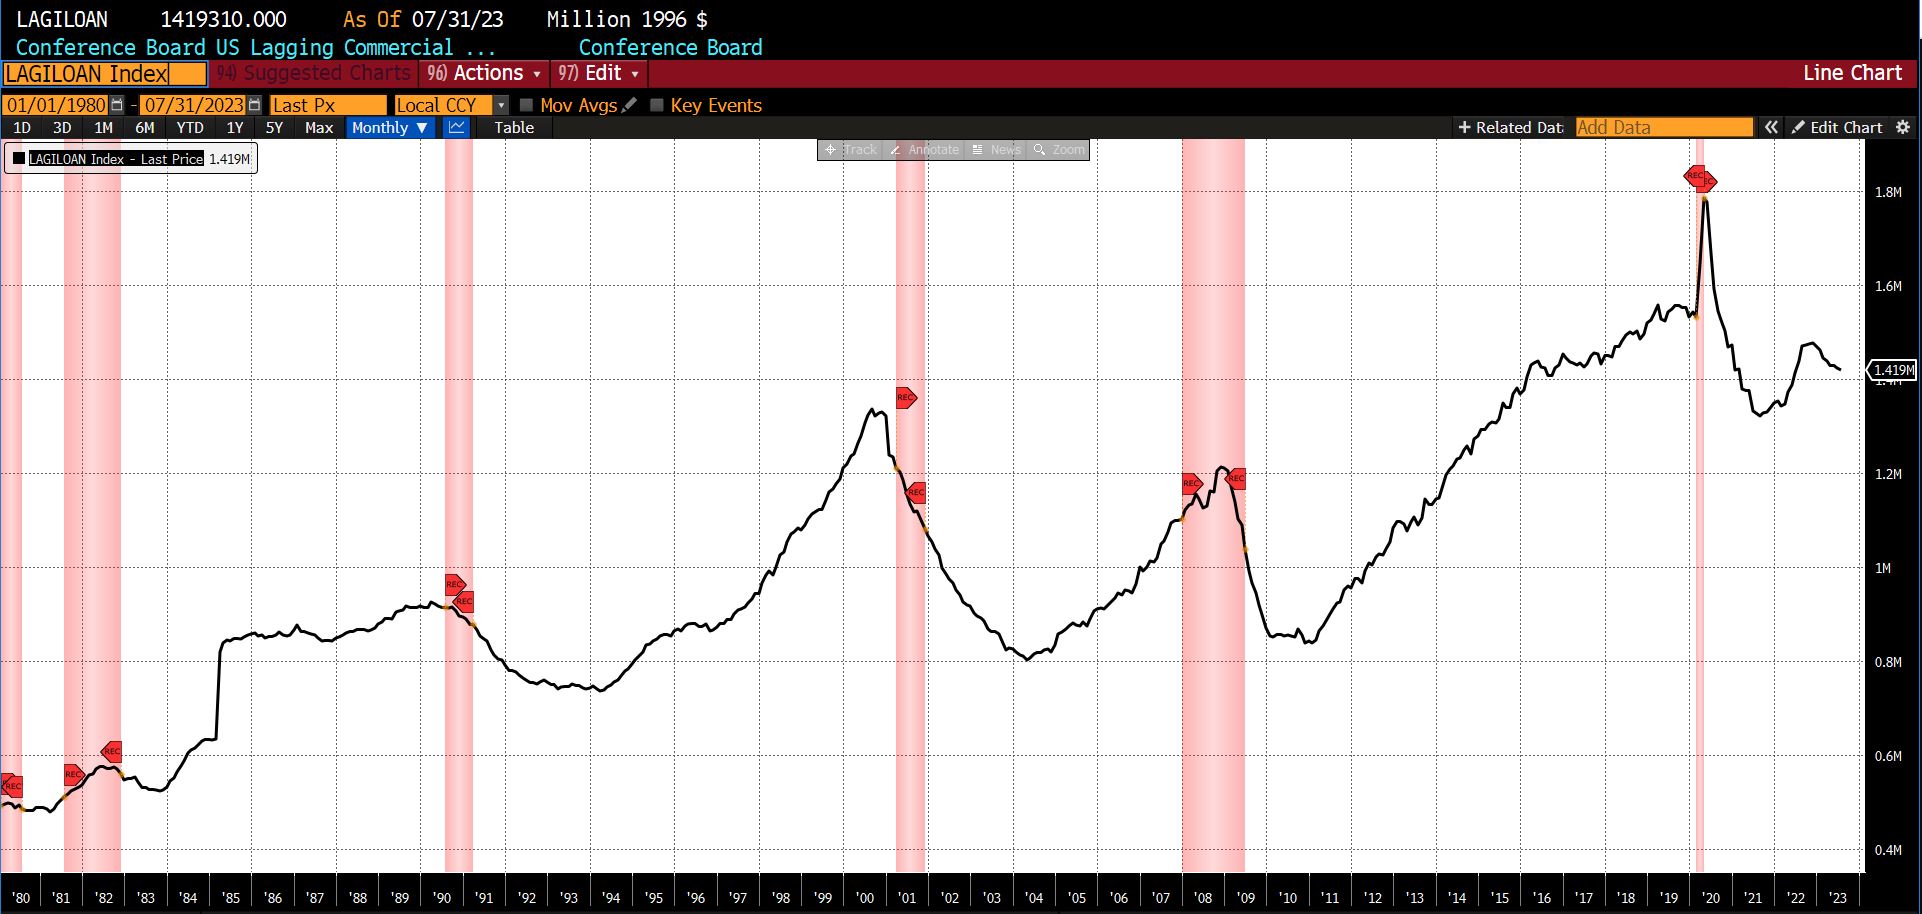
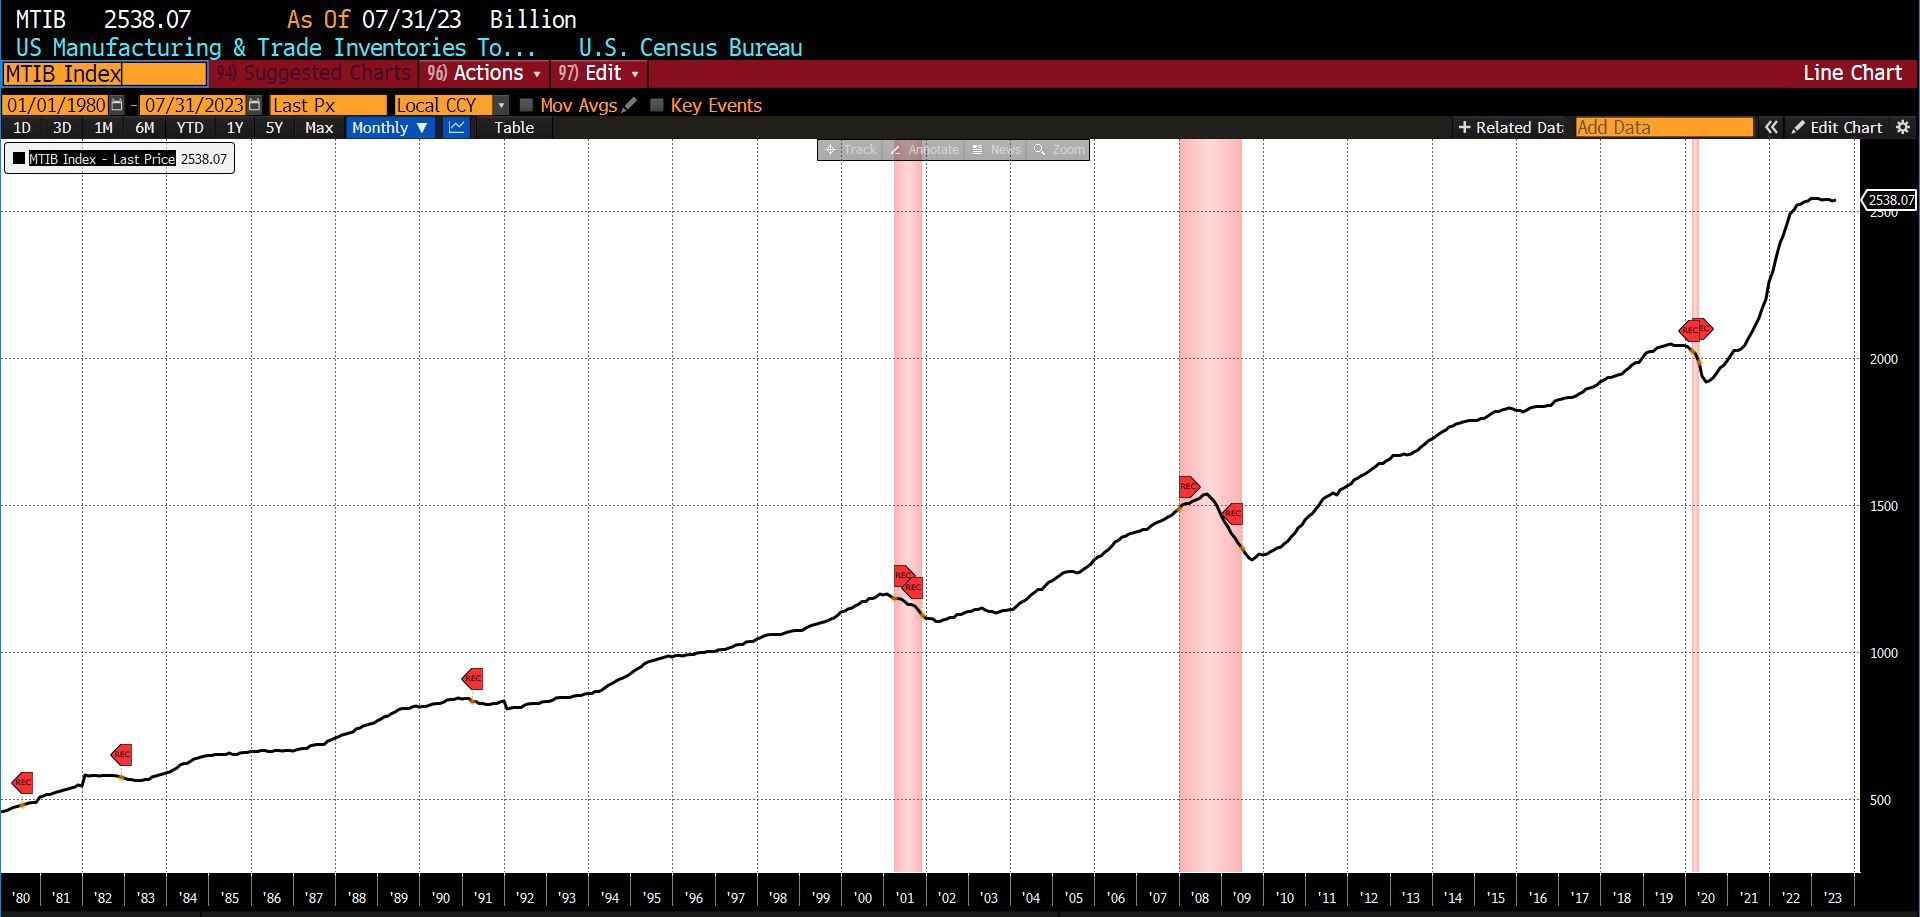
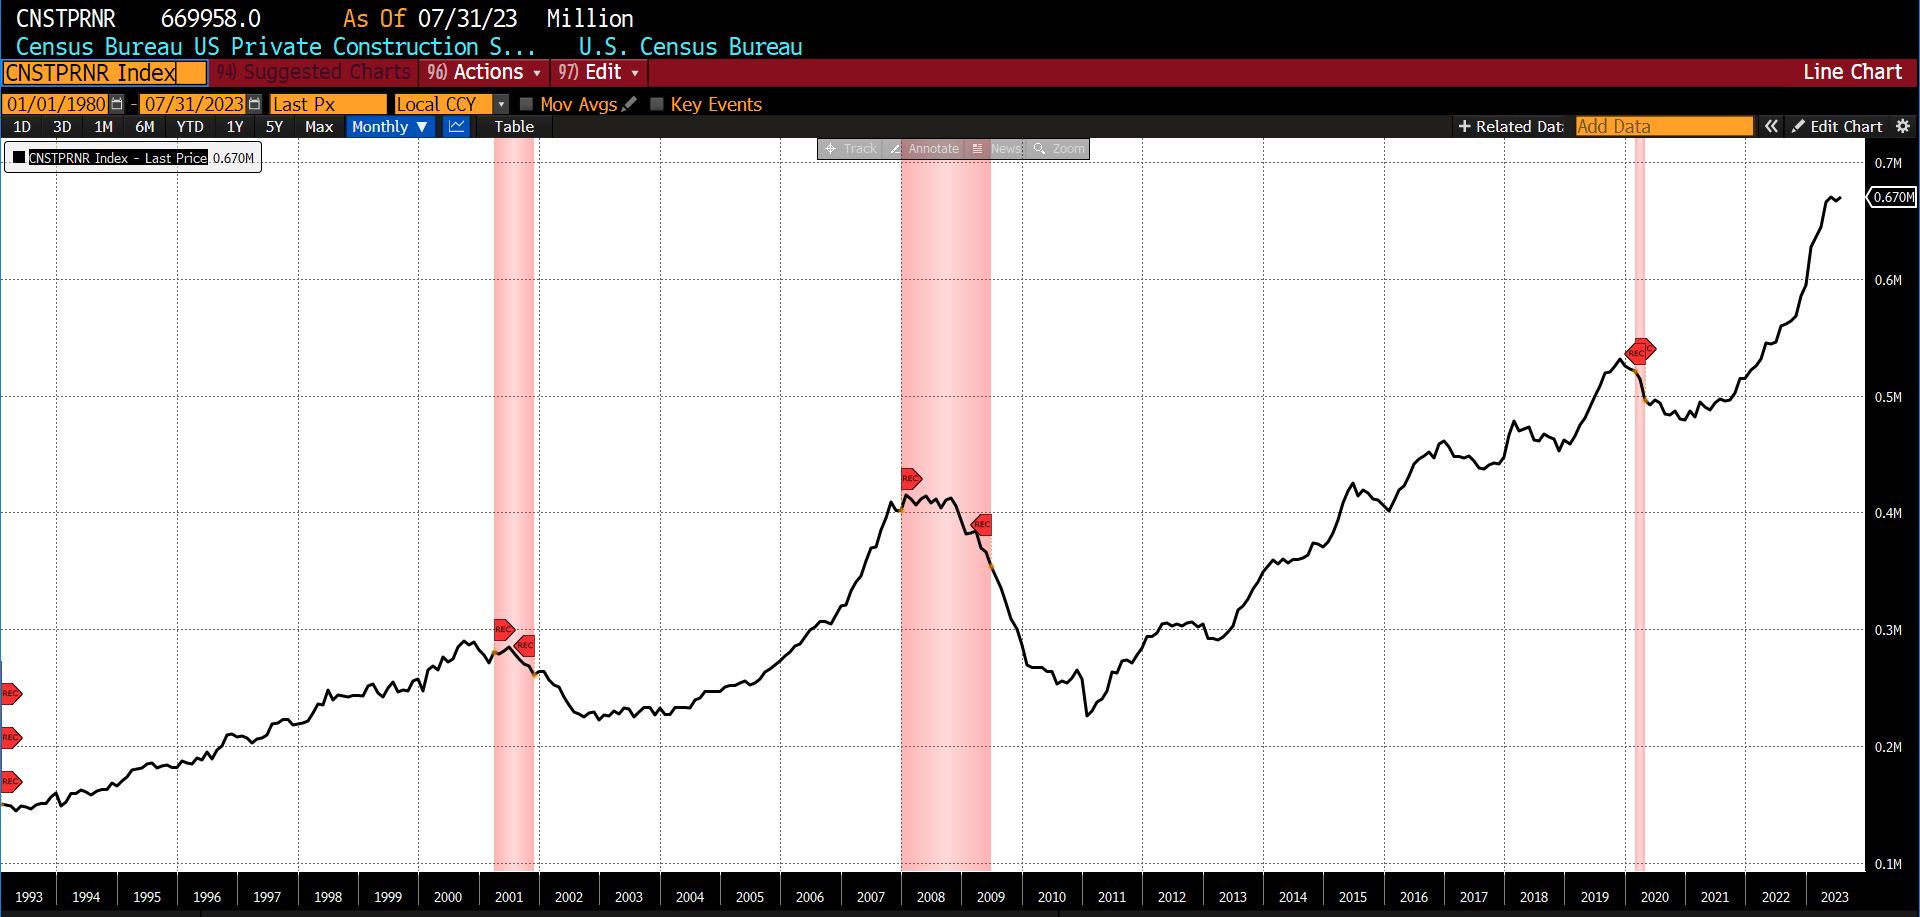
The Lagging Indicator also climbed from a neutral 50 to a slightly expansionary 58. Three of its constituents rose, two fell, and one was neutral from July to August. Average 30-day yields rose 0.38 percent, the Conference Board’s US Lagging Average Duration of Unemployment increased by 0.97 percent, and the US Census Bureau’s US Private Construction Spending (Nonresidential) climbed 0.45 percent. Core CPI fell 8.51 percent, the Conference Board’s Lagging Commercial and Industrial Loans declined 0.35 percent, and US Manufacturing and Trade Inventories (Total) remained unchanged.
Discussion
In August and September, consumer confidence data registered a warning regarding economic growth through the remainder of the year.
The Conference Board’s consumer confidence index fell sharply from 108.7 to 103.0, below consensus estimates of 105.5. Although consumers’ views of the present circumstances improved slightly (146.7 to 147.1), both future expectations fell (83.3 to 73.7) and recession fears rose. In addition, consumer views of the current state of the labor market were generally positive, but expectations pertaining to the next six months continue to sour. Respondents expecting more jobs to be available in six months than are available now fell to 15.5 percent (from 17.5 percent the prior month) with those expecting the number of available jobs to decline rising from 18 percent to 18.9 percent. The broad decline in confidence was seen across all income levels, with the highest income brackets evincing the largest sag.
Polls of entrepreneurs show the same trend. The American Bankruptcy Institute reported just 1500 Subchapter V filings by the start of September 2023, more than the entire number of filings in 2022. Among a Vistage Worldwide poll of 750 small business owners, 52 percent reported thinking that the United States is approaching or already in a recession. And in a Goldman Sachs survey of 1500 small firms in late August, 73 percent of respondents named currently high/rising interest rates as detrimental to their businesses. This data, however, likely underestimates the level of commercial distress as an estimated 90 percent of small business wind-downs occur outside of court.
On top of the ongoing credit contraction, declining consumer and business confidence, and the fragile state of consumption, five potential shocks face the US economy in the coming several months. Three pose a direct threat to consumers.
First, tens of millions of Americans will be required to resume student loan payments in October, a siphoning off of consumption which one estimate holds could cut 0.3 percent from 4th quarter US Gross Domestic Product. A second is rising oil prices, and consequently rising prices at the pump. West Texas Intermediate prices have lifted from the high $60s/low $70s per barrel (bbl) in June 2023 to over $90 bbl in mid-September. A recent high of $93.68 on September 27th was the highest price since November 2022. Commensurately, gasoline has risen. The average price per gallon at US pumps has risen from roughly $3.80 to $4.00 per gallon to over $4.30 per gallon in mid-September. The third are rising interest rates, which of course make borrowing more costly. Since January 2023 the 6-month US Treasury bill yield has risen from 4.75 to 5.56 percent with the one-year US Treasury bill yield rising from 4.71 to 5.46 percent. Out on the long end, the 20-year US Treasury bill yield has risen from 4.14 percent to 4.90 percent.
The epicenter of a fourth potential shock is in Detroit, Michigan. The United Auto Worker strike which began on September 15th marks the first time in history that all of the Big Three automakers (General Motors, Ford Motor Company, and Stellantis) have been hit at once. Because automotive supply chains are global and the production of a single automobile requires upward of 15,000 parts from scores of firms of various sizes, the strike may have a substantial impact on employment and economic growth. The 54-day strike of between 9,000 and 10,000 General Motors workers in 1998 resulted in 150,000 jobs lost. Although the structure of the auto industry and production methods have changed in the last quarter century, the expansion of the strikes to 25,000 additional workers in the last week of September is likely to generate knock-on effects. It may be that, seeing the vulnerable state of the economy, union officials think the current administration’s worrisome polling is likely to prompt intervention on their behalf.
Finally, although a government shutdown was averted in a 45 day deal, it seems unlikely that between now and mid-November the hyperpartisan character of US political discourse will diminish. Risks may resurface at that time. Although estimates of the macroeconomic losses attributable to a shutdown are small (estimated at a reduction of 0.2 percent of GDP for each week of closure), a greater risk resides in the likelihood of severe financial market volatility. Since early August the S&P 500 index has lost just under 7 percent of its value amid a backdrop of political stagecraft. But lest we dismiss the capers in Washington D.C. as so much rank theater and regardless of the sincerity of either side, on June 16, 2023 the US Treasury total public debt outstanding surpassed $32 trillion for the first time. On September 28, 2023, the US public debt surpassed $33 trillion, an astonishing $1 trillion of new debt incurred by the United States in a mere 94 days. In the 13 days between September 28th and October 1st, 2023 an additional $126 billion has been taken on with nary an indication of moderation in sight.
It is in the extremes that forecasts tend to find a quick and silent but rarely painless demise. We must consider the possibility that the extraordinary nature of fiscal, monetary, and other interventions during the COVID pandemic and subsequent upsurge in inflation have warped and perhaps destroyed long-observed relationships between consumption, sentiment, and other economic indicators. This may account for conflicting trends in recent economic data releases and even the seemingly random gyrations within AIER’s Business Conditions Monthly indicators.
There remains the distinct possibility that Friedman’s ‘long and variable lags’ are much longer and more variable than expected. The polls and surveys upon which so many data series rely may have tipped into ineffectuality. It may well be that accurate means of measuring aspects of the post-COVID US economy require the identification of new variables or the determination of new or improved sources of statistics and information. As social scientists, we remain alert for and open to cogent, economically sound and well-reasoned hypotheses pertaining to the current state of the economy. Presently, though, our expectation of a US recession on or before August 2024 remains undeterred.
LEADING INDICATORS

ROUGHLY COINCIDENT INDICATORS
LAGGING INDICATORS

CAPITAL MARKET PERFORMANCE
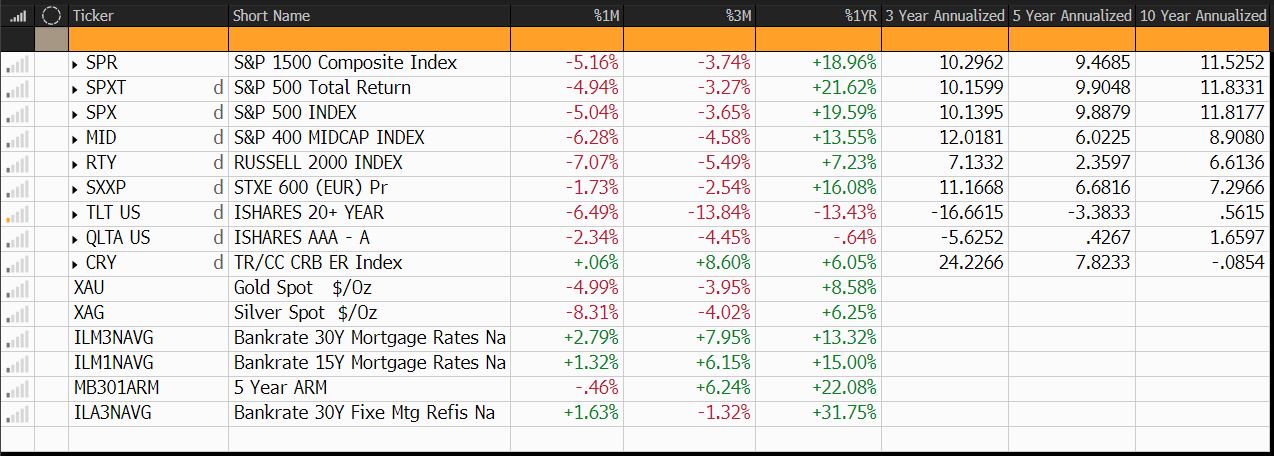
(All charts and data sourced via Bloomberg Finance, LP)