AIER’s Leading Indicators Index Improves Again in October


The U.S. economy continued to recover in October from the historic plunge in economic activity in the first half of the year. However, the pace of recovery in some areas has slowed. Furthermore, fallout from continuing restrictions (small business and personal bankruptcies) as well as the potential for renewed lockdown policies remain ongoing threats to future growth.
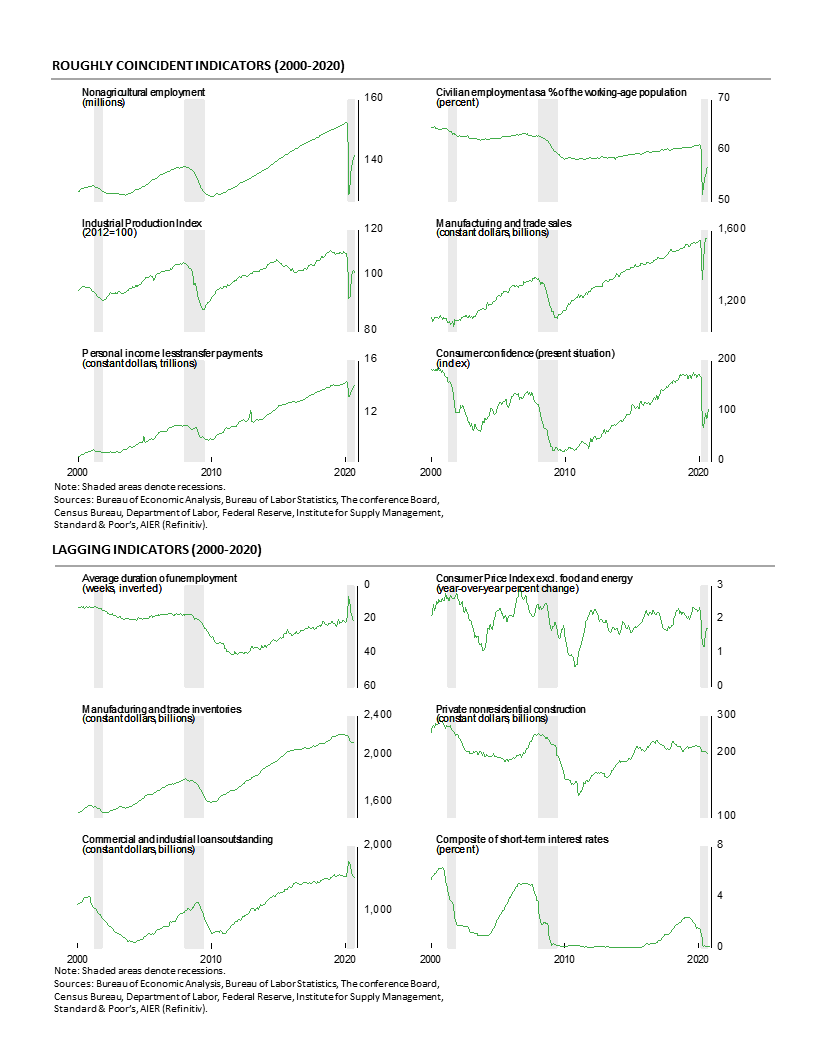
AIER’s leading and coincident indexes rose again in October with the Leading Indicators index rising to 75 and the Roughly Coincident Indicators index increasing to 58; the Lagging Indicators index, however, remained at zero for the second consecutive month. Four consecutive increases in the leading index suggest the recovery continues to broaden and may signal the end of the recession (see chart).
Real gross domestic product grew at a record pace in the third quarter rebounding from a historic plunge in the second quarter. While the economy has begun to expand again, measures of economic health vary widely, with some areas fully retracing or exceeding prior peaks and others remaining well below. Furthermore, there are a number of areas that continue to experience disruption, suggesting that while the recession may be over, some areas remain weak.
AIER Leading Indicators index points to expansion
The AIER Leading Indicators index rose to a reading of 75 (on a scale of 0 to 100) in October, up from 67 in September and 21 in August; the September increase was the second largest monthly gain on record. The October result is the highest reading since November 2018.
One leading indicator changed signals in October. Total heavy-truck unit sales improved from a negative trend to a positive trend. The overall results among the 12 leading indicators show nine indicators in uptrends, three indicators still in downtrends, and none in neutral trends compared to eight indicators in a positive trend, four in negative trends and none with neutral trends last month.
The Roughly Coincident Indicators index increased to 58 in October, up from 33 in September and following four consecutive months at the lower bound of zero from May through August. The last time the coincident indicators index spent multiple months at zero was in 2008-09 when the index spent a total of 11 consecutive months at the bottom. The index spent five months at zero in 1991 and four months there in 1981-82. The Roughly Coincident Indicators index is now at the highest level since March 2020.
Two roughly coincident indicators changed signs in September: real personal income excluding transfers and the Consumer Confidence index for the present situation from The Conference Board. Real personal income excluding transfers improved from a negative trend to a positive in the latest month while the consumer confidence indicator improved from a negative trend to a neutral trend.
Overall, three roughly coincident indicators had positive trends in October while two remained in negative trends and one was in a neutral trend versus two indicators trending favorably, four trending unfavorably and none with a neutral trend last month.
AIER’s Lagging Indicators index held at 0 in October, the second month at the lower bound. The last time the index held at the lower bound was a seven-month run from November 2009 through May 2010.
Overall, consecutive gains for both the Leading Indicators index (four consecutive gains) and the Roughly Coincident Indicators index (two consecutive gains) suggest that the end of the recession may have occurred or is imminent. However, the National Bureau of Economic Research is unlikely to declare an official end to the recession for some time as the risk of a double dip recession remains. Some areas of the economy benefited from the initial push to reopen and posted sharp rebounds in recent months following massive drops in March and April. However, the latest data indicate that growth may be starting to falter in some areas. Furthermore, with Covid-19 on the rise again, the potential for renewed restrictive policies as well as the potential for a rise in personal and business bankruptcies suggest the outlook for the economy remains highly uncertain.
Third quarter gross domestic product sets a record
Real gross domestic product surged at a historic 33.1 percent annualized rate in the third quarter, up sharply from a historic 31.4 percent pace of decline in the second quarter. Over the past four quarters, real gross domestic product is still down 2.9 percent, and 3.4 percent, or $659 billion, below the previous expansion trend. On a nominal basis, gross domestic product rose 38.0 percent in the third quarter, putting the change from a year ago at -1.8 percent.
Real final sales to private domestic purchasers, a key measure of private domestic demand, jumped at a 38.1 percent annualized rate in the third quarter, versus a 32.4 percent pace of decline in the second quarter. The rebound still leaves this important measure 4.2 percent below trend.
Gains were widespread across the economy
Real consumer spending rose sharply in the third quarter, increasing at a 40.7 percent pace compared to a -33.2 percent rate in the second quarter. The gain was the result of rises in spending on durable-goods (up 82.2 percent) nondurable-goods (28.8 percent), and services (38.4 percent).
Business fixed investment increased at a 28.5 percent annualized rate in the third quarter of 2020. That gain was led by a 70.1 percent surge in spending on equipment while spending on structures fell 14.6 percent, the fourth consecutive decline, and Intellectual-property investment fell at a 1.0 percent pace.
Residential investment, or housing, jumped at a 59.7 percent annual rate in the third quarter compared to a 64.4 percent drop in the prior quarter. Housing has shown resilience in the current environment as extremely low interest rates combined with the desire by some people to move away from virus epicenters have created demand.
Businesses liquidated inventory at a $1.0 billion annual rate (in real terms) in the third quarter versus liquidation at a $287.0 billion rate in the second quarter, adding 6.62 percentage points to third-quarter growth after subtracting 3.5 percentage points in the prior quarter.
Exports rose at a 59.7 percent pace while imports rocketed at a higher at a 91.1 percent rate. Since imports count as a negative in the calculation of gross domestic product, a gain in imports is a negative for GDP growth, subtracting 7.99 percentage points. Net trade, as used in the calculation of gross domestic product, subtracted 3.09 percentage points from overall growth.
Government spending fell at a 4.5 percent annualized rate in the third quarter compared to a 2.5 percent gain in the second quarter, subtracting 0.68 percentage points from growth versus a 0.77-point contribution in the second quarter of the year.
Uneven recoveries
Despite the rebounds in the third quarter, several key components of domestic demand remain well below their fourth-quarter 2019 level. Consumer spending on durable goods and on nondurable goods as well as new home construction are the three areas that are above prior peaks while consumer services, all three major components of business fixed investment, and exports are all well below the fourth quarter. High levels of uncertainty, especially regarding policy, are likely to sustain an elevated level of caution among businesses, resulting in weak investment and slow recovery for the labor market.
The U.S. economy suffered a historic contraction in the second quarter as government shutdowns intended to fight the Covid-19 outbreak sent economic activity plunging and unemployment soaring. Reopening has spurred a historic rebound in the third quarter, but some areas of the economy remain below pre-pandemic levels. A resurgence of new cases and deaths attributed to Covid-19 as well as extreme partisanship in the governing process is sustaining a very high level of uncertainty, confusion, and risk aversion among consumers and businesses.
Early Fourth quarter data are mixed
Initial claims for regular state unemployment insurance totaled 751,000 for the week ending October 31, down 7,000 from the previous week’s revised tally of 758,000. Claims have posted a third consecutive week below 800,000 though the level is still high by historical comparison. The four-week average was 787,000, down 4,000 from the prior average. The latest week is the 33rd week of historically massive claims. Prior to the lockdowns, initial claims were running around 230,000. Persistent initial claims at such a historically high level remain a troubling sign for the labor market recovery and the economy.
The number of ongoing claims for state unemployment programs totaled 7.436 million for the week ending October 17, down 601,929 from the prior week. For the same week in 2019, ongoing claims were 1.417 million. Continuing claims from state programs have trended lower since the peak in early March. Over the same period, continuing claims in all federal programs have trended higher, reaching 14.092 million for the week ending October 17.
The total number of people claiming benefits in all unemployment programs including all emergency programs was 21.509 million for the week ended October 17, down 1.153 million from the prior week. While there has been improvement from the catastrophic results in March and April, the current levels of weekly initial claims and continuing claims in all programs are still very high.
Unit auto sales slowed slightly in October
Sales of light vehicles totaled 16.2 million at an annual rate in October, slightly below the 16.3 million pace in September but the second month in a row back in the 16 to 18 million range following plunges in March and April. The pace of sales in April was the lowest on record since this data series began in 1976 and follows a run of 72 months in the 16 to 18 million range from March 2014 through February 2020.
For the month of October, light-truck sales totaled 12.4 million at an annual rate versus a 12.6 million rate in September but well ahead of the 6.7 million rate in April. Car sales posted a modest gain, rising to a 3.8 annual rate versus 3.7 in September and 2.0 in April.
The light-truck share stood at 76.5 percent for October, below the 77.9 percent record high in May, but still completely dominating the car share of 23.5 percent. The dominant share of light-trucks continues a long-term trend. As recently as February 2013, the split between cars and light-trucks (SUVs and pick-up trucks) was about even, with both segments selling about 7.8 million at an annual rate. Breaking down sales by origin of assembly, sales of domestic vehicles fell to 12.7 million units versus 12.8 million in September while imports were essentially unchanged at 3.5 million.
Consumer Sentiment Remains Subdued in October
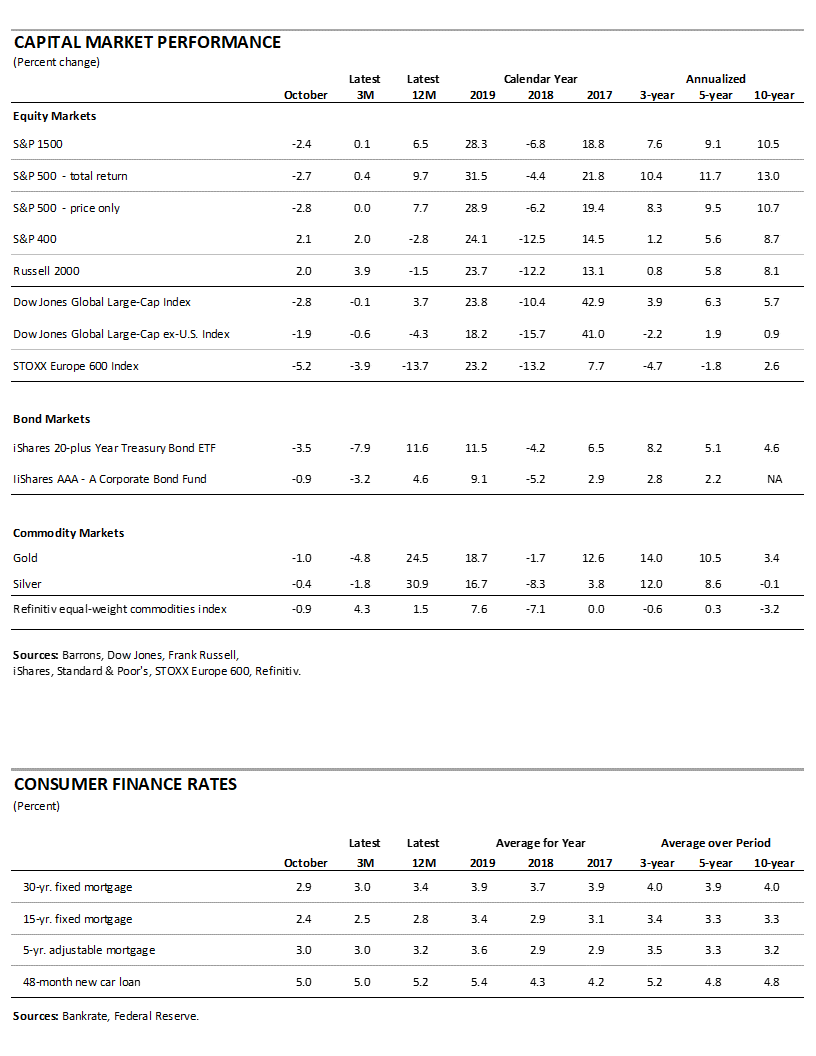
The latest results from the University of Michigan Surveys of Consumers show overall consumer sentiment was little changed in October and remains well below pre-pandemic levels. Consumer sentiment increased to 81.8 in October, up from 80.4 in September, a 1.7 percent gain. From a year ago, the index is still down 14.3 percent and is 15.8 percent below the average level from 2018 through 2019.
The sub-indexes posted mixed results in October. The current-economic-conditions index fell to 85.9 from 87.8 in September. That is a 2.2 percent drop and still leaves the index with a 24.1 percent decrease from October 2019 and 23.7 percent below the pre-pandemic two-year average. The second sub-index — that of consumer expectations, one of the AIER leading indicators — rose 3.6 points or 4.8 percent for the month but is 5.9 percent below the prior year and 9.3 percent below the pre-pandemic average.
According to the report, “Fear and loathing produced this false sense of stability. Fears were generated by rising covid infection and death rates, and loathing was generated by the hyper-partisanship that has driven the election to ideological extremes.”
The report goes on to add, “Moreover, the impact of the covid virus and the extremes of hyper-partisanship will continue long past next week’s election, with the potential to permanently alter the economic and political landscape. As noted when Trump won over Clinton in 2016, the economic expectations of Republicans and Democrats shifted in opposite directions and by large amounts given that two-thirds of all consumers incorrectly anticipated a Clinton victory. Since a Biden win over Trump (53% vs. 42%) was anticipated in the October survey, it should be no surprise that optimism among Democrats about their future finances rose substantially compared with Republicans. Importantly, for the first time in nearly four years, the financial expectations of Republicans and Democrats were nearly equal. Compared with three months ago, the Expectations Index rose by 50% among Democrats but just 7% among Republicans.”
The path of recovery may ultimately depend on progress understanding the virus that causes Covid-19 and the ability to develop and deploy a vaccine. The survey notes, “The outcome of the election can accelerate or narrow these partisan shifts, but unlike the 2016 election, renewed optimism now requires progress against the coronavirus and mitigating its uneven impact on families, firms, and local governments.”

Robert Hughes

Robert Hughes joined AIER in 2013 following more than 25 years in economic and financial markets research on Wall Street. Bob was formerly the head of Global Equity Strategy for Brown Brothers Harriman, where he developed equity investment strategy combining top-down macro analysis with bottom-up fundamentals. Prior to BBH, Bob was a Senior Equity Strategist for State Street Global Markets, Senior Economic Strategist with Prudential Equity Group and Senior Economist and Financial Markets Analyst for Citicorp Investment Services. Bob has a MA in economics from Fordham University and a BS in business from Lehigh University.


