The Consumer Lags Behind


The recovery does not benefit all parts of the economy equally. Business is gaining an outsized share of the growth, while households and individuals are not benefiting much.
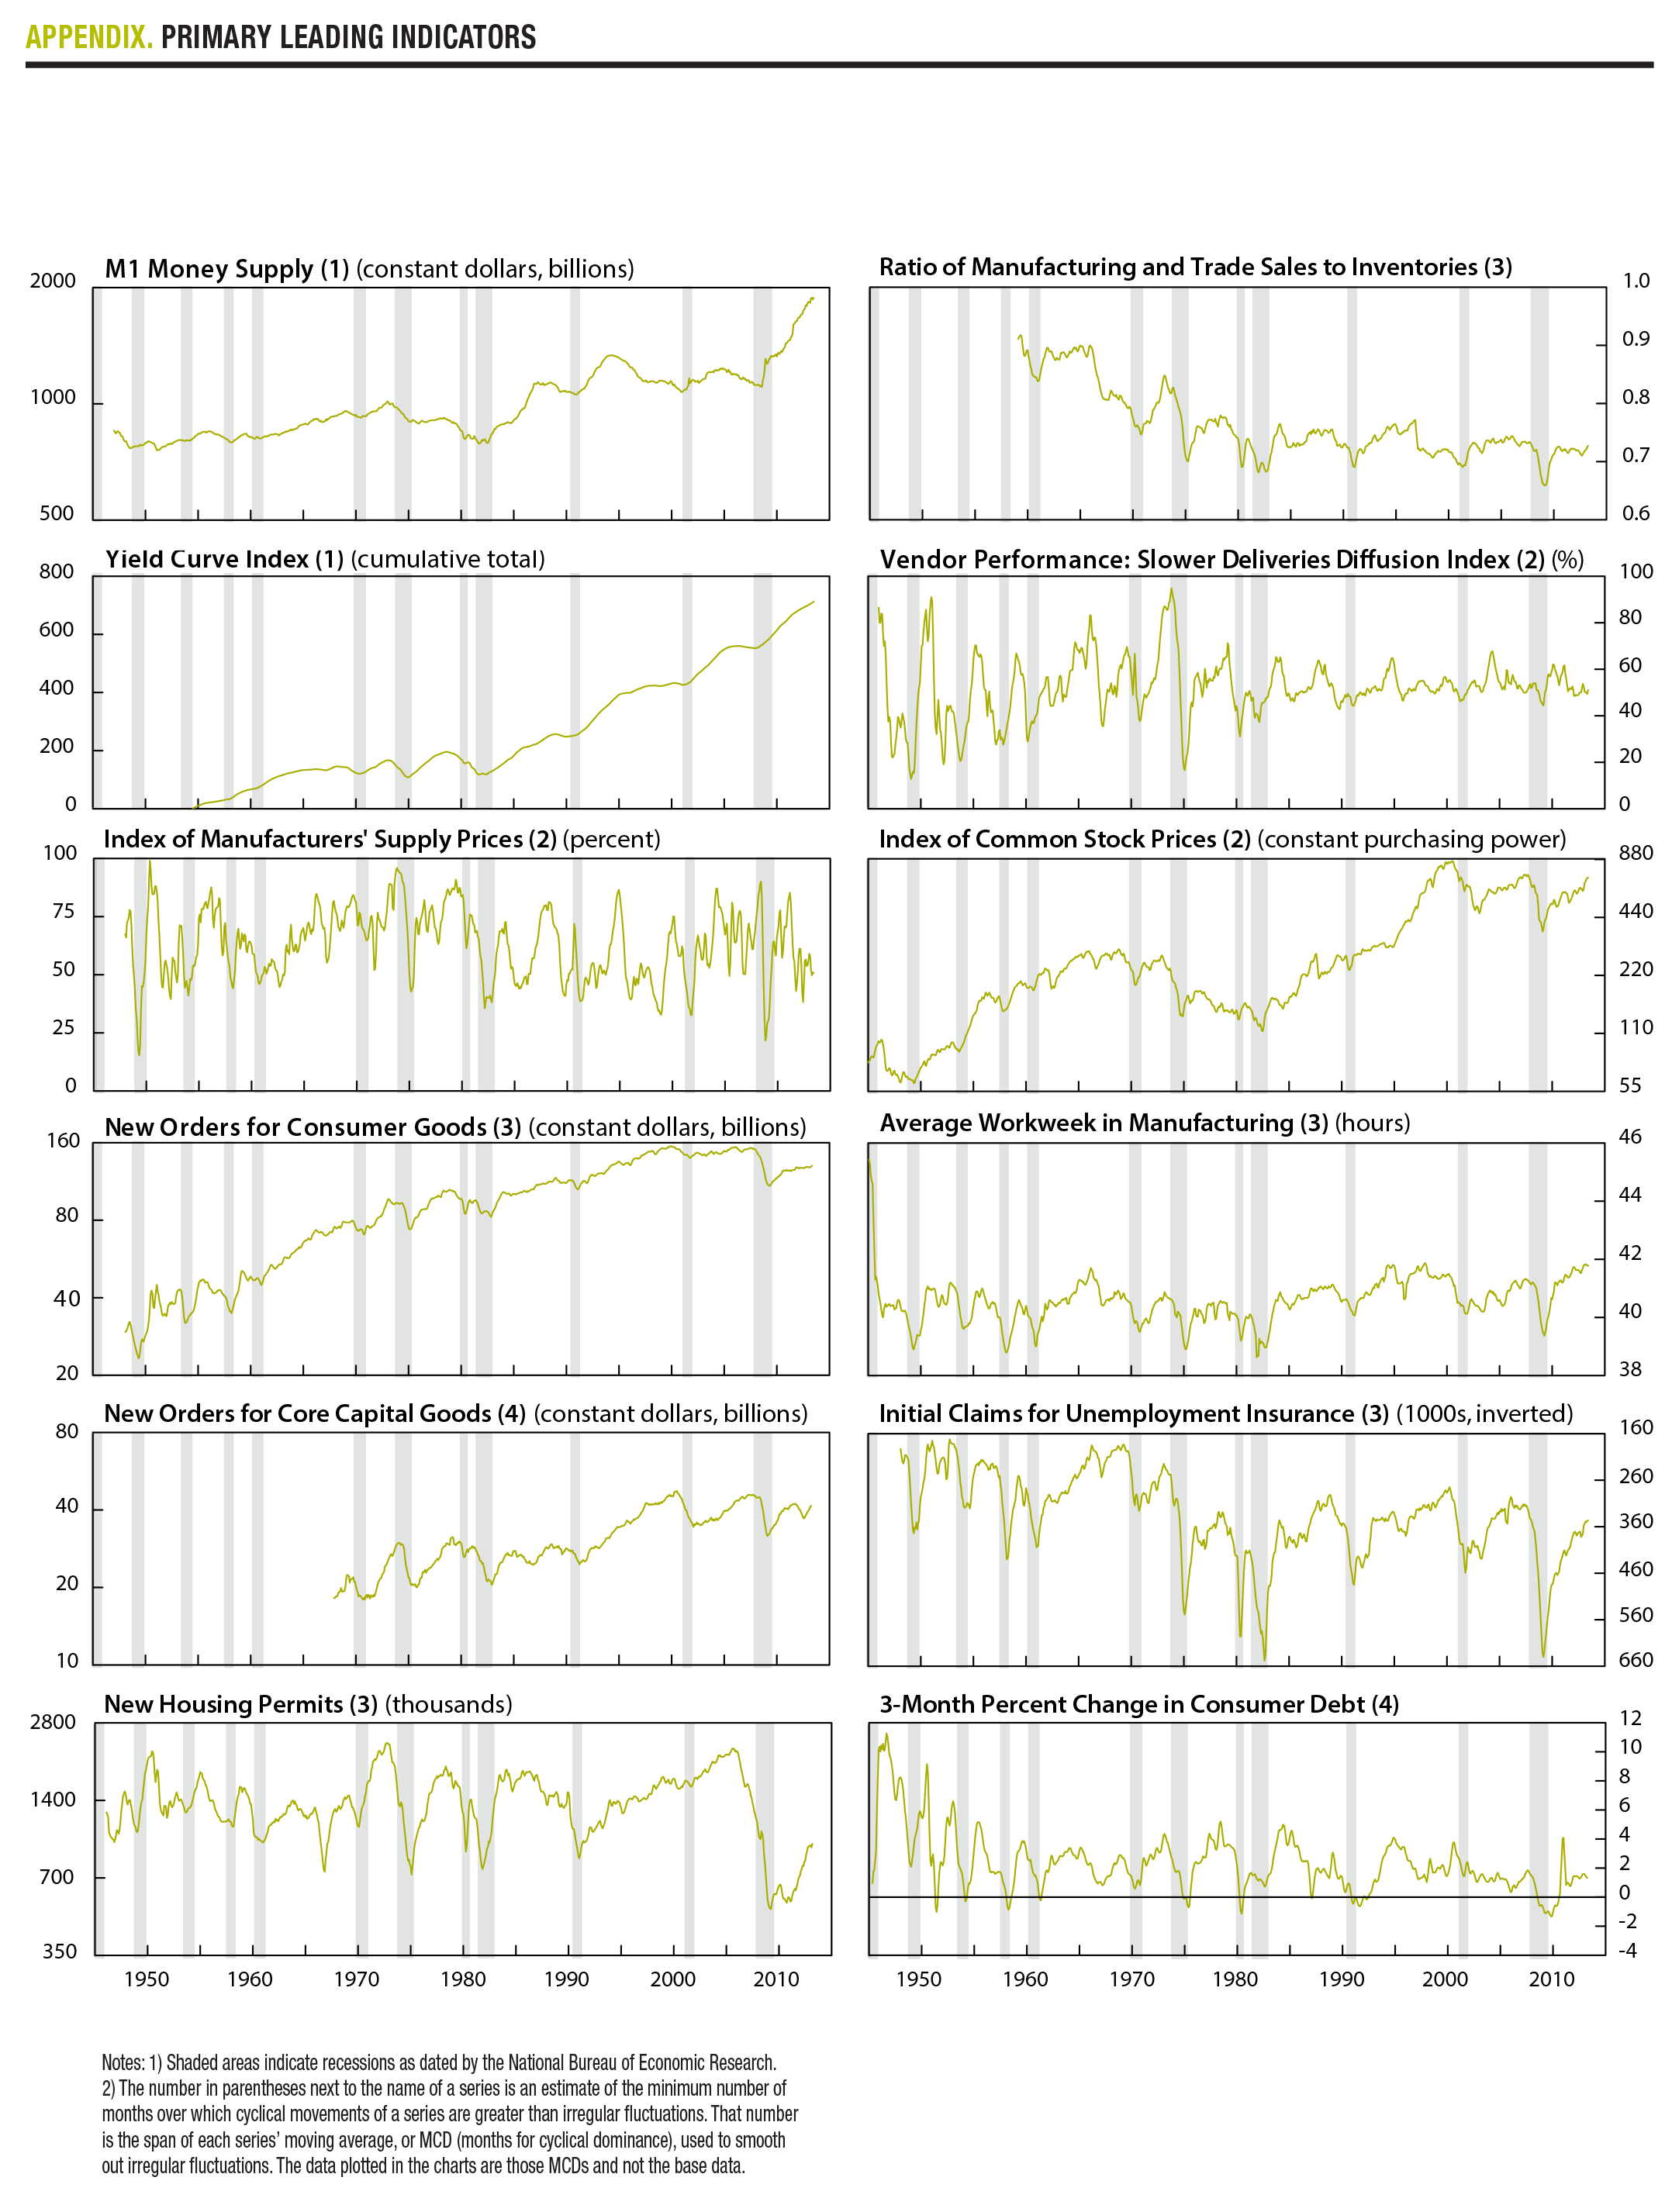
Overall, 91 percent of AIER’s primary leading indicators are appraised as expanding (10 out of 11 indicators for which a trend is apparent) up from 82 last month. The cyclical score of leaders, which is based on a separate, mathematical analysis, has edged up to 90 from 88 last month. With both measures comfortably above 50, the leading indicators suggest that the recovery is likely to continue.
AIER’s coincident and lagging indicators, all of which are appraised as expanding, with many reaching new highs, confirm that the economy has been growing for some time.
The biggest change among the leading indicators this month is the substantial increase in the ratio of manufacturing and trade sales to inventories.
A jump in manufacturing and trade sales, one of our coincident indicators, is responsible for the increase. In the 12 months to May, the latest month for which data are available, sales increased an inflation-adjusted 4.6 percent and reached the highest level in more than 50 years that the data had been collected.
The level of sales surpassed the previous peak reached in October 2007, two months before the Great Recession started.
But there are disparate trends for the sales of consumer-oriented products versus products that are more likely to be purchased by businesses, with business taking the lead.
This disparity is most visible in the sales of durable goods. Increases are concentrated in machinery, equipment, supplies and professional and commercial equipment. These products are likely to be purchased by businesses rather than people.
Sales of durable consumer goods, such as appliances, furniture, and computers, are stagnating. The types of consumer goods that are posting sales increases tend to be nondurable necessities, such as groceries and fuel.
One exception is the increase in sales of motor vehicles and parts, which are difficult to divide into purchases by businesses and purchases by people.
All this adds up to a picture of an economy where businesses are doing fairly well, while consumers are focusing on meeting everyday needs.
These trends are echoed in other indicators. New orders for core capital goods, a leading indicator, has been rising steadily for a year. Since July 2012, it has increased by 8.4 percent and currently stands only an inflation-adjusted 10 percent below its pre-recession value.
In contrast, growth in new orders for consumer goods, also a leading indicator, has slowed. Over the past year, new orders for consumer goods rose only 3.3 percent and remain more than 15 percent below the pre-recession peak.
The value of manufacturers’ shipments of consumer goods has been falling for four months and currently stands at about the same level it was in July 2012.
The value of unfilled consumer goods orders is close to the lowest level in more than 20 years. It has been stuck in the narrow range of $3.7-$4.4 billion ever since the recovery officially began in June 2009. (See Chart 1 on page 4.)
When unfilled orders are high, it means that demand is growing faster than manufacturers can expand supply, and some orders go unfilled for a while. When unfilled orders are low, it means that demand is slack and manufacturers can easily fill almost all orders that come their way. That is what is happening now with consumer goods.
Another sign of slack in consumer demand is the accumulation of inventories. Manufacturers’ inventories of consumer goods (part of manufacturing and trade inventories) have risen close to the level they gained in early 2008, as the economy was about to go into a tailspin.
The picture is different for the investment goods purchased by businesses. Demand for capital goods is sufficiently strong that the producers are falling behind on fulfilling orders.
Inventories of core capital goods have been falling since last October. Unfilled orders have been rising since last December. They currently stand close to the pre-recession peak. The value of manufacturers’ shipments of core capital goods has been rising steadily since last September.
A disparity in income growth mirrors the disparity in spending trends between businesses and people.
Corporate profits after taxes have grown almost continuously since the end of the recession, interrupted only by a brief decline at the end of 2010. In the first two quarters of 2013, after-tax corporate profits rose only about 2 percent, but that comes on top of a spectacular 16 percent increase in 2012.
Profits reflect the resources companies have available once all costs and taxes have been covered. Some of that money may be paid to shareholders as dividends. A lot of it is retained to finance business expansions or investments.
With profits at healthy levels and growing, companies should have no difficulty financing investment spending, if they deem such spending desirable.
People, however, are not faring as well as businesses.
The rate of growth in real disposable personal income has been slowing for more than two years. Except for a 5.9 percent increase in income in December 2012 that reflected a one-time response to anticipated tax changes, growth of disposable income peaked early in 2011 at a 4 percent annual rate. It has been steadily falling since then.
In June 2013, disposable personal income grew so slowly that, once adjusted for inflation, the purchasing power of that income was lower than the month before. The increase in July, the latest month of data, was just barely above zero. Overall, in the past 12 months, real disposable income increased only 0.8 percent. (Disposable income measures the money people have after taxes have been paid and transfers received.)
Wages and salaries, a subset of personal income, show a similar pattern. Growth peaked in early 2011 at 5.8 percent and has been trending down since then. In 12 months to July, this category of income rose only 3.4 percent.
Wages and salaries exclude types of income more likely to be received by the affluent, such as interest and dividends. As such, this subset of income better reflects the experience of most people.
Since population grows over time, income per person is a measure that matters more to families than aggregate income. Per person income fared even worse than the aggregates would suggest. In the past 12 months, real disposable income per capita grew a meager 0.06 percent.
Aggregate income is what supports aggregate economic activity. Since the recovery began a little over four years ago, real disposable personal income increased 5.9 percent. This contrasts sharply with the experience of the earlier business-cycle recoveries.
Four years after the previous recovery, which began in November 2001, real disposable personal income had increased 12.4 percent. Following the recession that ended in March 1991, the increase was 12.8 percent. Following the deep recession that ended in November 1982, the increase was even larger, 18.5 percent.
As a share of national income, compensation of employees has been falling since the end of the current recession. At the same time, corporate profits have been rising, both in total and as a share of national income. (See Chart 2 above.)
What we see in the data are businesses investing in equipment and machinery at a fairly decent pace, but not expanding hiring or raising workers’ pay much.
Every month this year, private employers added less than 200,000 workers to their payrolls, with a single exception of February, when 319,000 jobs were added. This is barely enough to absorb the population increase.
The growth of average weekly earnings of production and nonsupervisory workers in the private sector has been stuck below a 2 percent annual rate for the past 12 months.
Such a slow pace of earnings growth was seen only a handful of times in the 50 years that the data were collected—in 2009, at the end of the most recent recession, in late-2003, in late-1995, and in 1986. Each of these episodes was accompanied by a slowing of GDP growth to below a 3 percent annual rate, sometimes far below.
All this leaves people with stagnating incomes, which explains the pattern of consumer purchases. The demand for nondurable necessities, such as groceries, grows reasonably well, but the demand for most things people can do without, such as appliances and computers, is slacking.
The economy’s engine is running unevenly, posing a potential danger to sustained growth.
Business spending and the everyday spending by consumers have been enough so far to pull the recovery along. But consumer durable goods industries, which are more cyclically sensitive, seem to be running out of steam. Without an improvement in people’s incomes, the situation is not likely to change.
People may have increased their spending as far as their incomes would allow. This year, the personal saving rate has fallen to an average of 4.3 percent of disposable income, down from more than 5.5 percent in each of the previous three years.
The saving rate today is higher than it was during the credit-happy years leading up to the recession. In 2005-2007, it hovered around 3 percent. But given that today banks are much less willing to lend than they were during the boom, we would not expect, nor would we want, the saving rate to fall much further.
Without an unhealthy expansion of borrowing, people will only be able to increase demand for consumer goods when they see their incomes grow. Businesses, with healthy profits and cash reserves, can continue spending.
Ultimately, however, the only reason businesses spend is because they expect consumer demand to grow. Anticipation of future consumer demand has to justify continued business investment. If growth of consumer demand does not materialize, businesses will be quick to cut back on spending.
Consumer spending accounts for a much bigger part of the overall economy than does business spending, Unless its growth accelerates, GDP is unlikely to grow much faster than it has been. Businesses cannot be the sole driver of economic growth for long.
[pdf-embedder url=”https://www.aier.org/wp-content/uploads/2014/01/AIER_SeptBCC.pdf“]

