The Federal Deficit and Debt: Trouble Ahead?
Until recently, the rest of the world has been willing to purchase Treasury securities despite low interest rates. Foreign purchasers of Treasury securities were not deterred by a debt-to-GDP ratio close to an all-time high. But they have changed their outlook. Over the last year, foreigners have become net sellers of Treasury securities. If they continue to be net sellers of Treasury securities, the federal government may face trouble financing budget deficits.
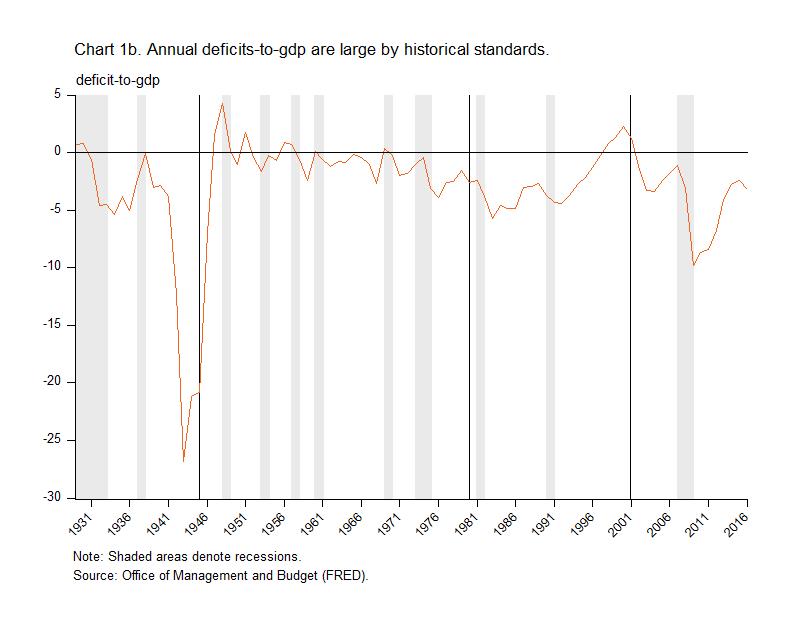
Since the Great Depression, the federal government has typically run a deficit. From 1929 to 2016, the average deficit was 3.1 percent of GDP. The deficit peaked during the Second World War at 26.8 percent of GDP. From 1946 to the end of the 1970s, a strong postwar economy boosted tax payments and reduced the deficit to an average of just 1 percent of GDP. The deficit increased in the 1980s when President Reagan cut taxes and increased government spending on defense. The economic boom in the 1990s created a budget surplus for the first time since the late 1960s. The bursting of the tech bubble, President George W. Bush’s tax cuts, and spending on the wars in Iraq and Afghanistan caused the budget surplus to return to a deficit. During the Great Recession and subsequent weak recovery, the deficit has averaged 5.5 percent of GDP. Each year since 2001, in fact, the federal government has spent more than the tax revenue it has taken in.
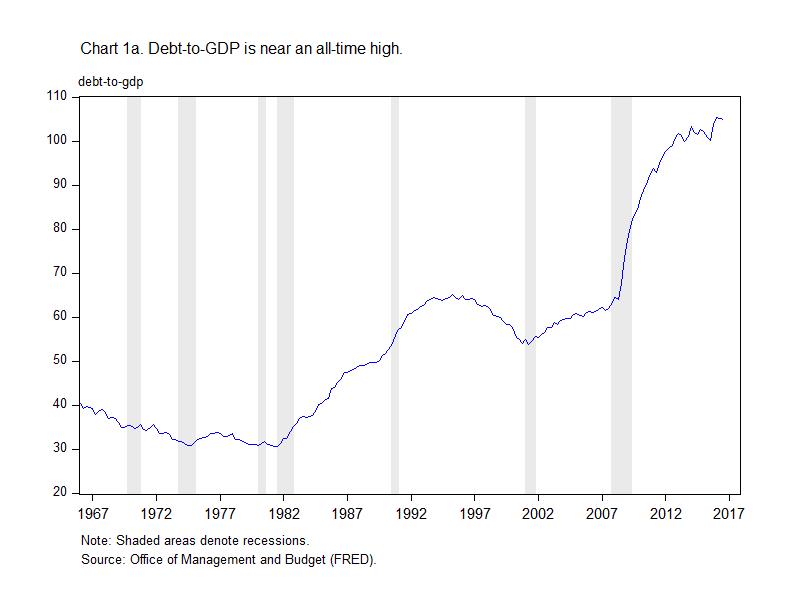
Ongoing federal budget deficits have caused a large run-up in federal debt. The federal government debt-to-GDP ratio reached an all-time high at the beginning of 2016: 105.4 percent of GDP. To put that figure in perspective, from the mid-1960s until the start of the Great Recession the average federal debt-to-GDP ratio was 46.8 percent. Most of the increase in federal debt has accumulated following the onset of the Great Recession. In the first quarter of 2008, the federal debt-to-GDP ratio was 64.3 percent. At the end of 2016, the federal debt-to-GDP ratio remained near the all-time high at 104.8 percent of GDP.
How does the federal government spend its tax revenue and borrowed funds? Federal spending can be broken into three categories: mandatory spending, interest on the national debt, and discretionary spending. According to the Congressional Budget Office, in 2016 mandatory spending accounted for the largest share of federal spending at $1.9 trillion, or 10.1 percent of GDP. Mandatory spending includes entitlement programs such as Medicare, Medicaid, and Social Security.
In 2016, interest on the national debt was $241 billion, or nearly 2 percent of GDP. Despite a record level of debt and ongoing deficits, federal spending to cover interest on the national debt has been lower compared with recent decades. During the 1980s and 1990s, interest payments as a share of the national debt averaged 2.7 percent of GDP. Lower interest expense has been the result of lower interest rates. During the early 1980s, the 10-year Treasury yield reached over 15 percent. Interest rates were high during the early 1980s because Federal Reserve chairman Paul Volcker was pursuing a high interest rate policy in response to high inflation. After the early 1980s, interest rates began a consistent and gradual decline. Today the yield on the 10-year Treasury is closer to 2 percent. But historically high debt-to-GDP levels risk higher interest expense for the federal government.
Discretionary spending, which includes nondefense and defense spending, came to $1.2 trillion in 2016, or 6.5 percent of GDP. Nondefense discretionary spending—which includes spending on research, education, transportation, and diplomacy, among other categories—was $600 billion in 2016, or 3.3 percent of GDP. Defense spending was $584 billion in 2016, or 3.2 percent of GDP. Other spending, which covers such items as unemployment insurance and nutrition programs, was $563 billion in 2016, or 3.1 percent of GDP.
Since the early 2000s, federal spending has exceeded tax revenues. The largest source of federal revenue is income taxes. In 2016, income taxes accounted for $1.5 trillion, or 8.4 percent of GDP. A strong labor market—with the U.S. economy adding over 2 million jobs over the last year—has given income-tax collection a boost. The next-largest source of federal revenue is payroll taxes for social-insurance programs such as Social Security and Medicare. In 2016, payroll taxes for social insurance equaled $1.1 trillion, or 6.1 percent of GDP. Corporate taxes are the third-largest source of federal revenue, but are much smaller than income taxes and payroll taxes. Corporate-tax revenue accounted for 1.6 percent of GDP last year.
President Trump’s recently released 2018 budget blueprint calls for a $52 billion increase in the Department of Defense budget compared to 2017. That amounts to a 10 percent increase in defense spending. The increase would go toward improving readiness across in all branches of the military. The 2018 increase in defense spending would be one of the largest in American history. In constant (inflation-adjusted) dollars, the boost in defense spending would only be exceeded by increases during the Reagan administration and during active conflicts.
President Trump plans to increase military spending without increasing the deficit or debt by making broad cuts to nonmilitary government agencies. This includes a 28 percent cut to the Department of State budget. On the domestic side, the Environmental Protection Agency budget would be cut by 31 percent, while spending on the Department of Health and Human Services would be cut by 17.9 percent. The Department of Energy would see a 5.9 percent cut. The proposed budget would end federal funding for many independent agencies well-known independent agencies such as the National Endowment for the Arts and the Corporation for Public Broadcasting would be eliminated.
The details of President Trump’s tax plan have yet to be released. However, analysis of President Trump’s tax cuts has shown they will likely increase the deficit and debt. During the presidential campaign, Trump ran on tax cuts for individuals and businesses. What might Trump’s tax plan look like? The Tax Foundation estimates that individual tax brackets would be reduced from seven to three. For single-filers, the highest tax bracket would likely be lowered to 33 percent from nearly 40 percent. The middle tax bracket would likely be 25 percent and the lowest bracket close to 12 percent. The capital-gains rate would be reduced across tax brackets as well. Important deductions would be adjusted. For example, the standard deduction would be doubled and child-care expenses made deductible from taxable income, according to the foundation.
Lower income taxes would mean a higher return for labor. In other words, workers would take home more of their paycheck. In response, they might work more hours. In addition, lower taxes might attract new entrants to the labor force. With more money in their pockets, Americans could spend more. This would be positive news for an economy driven by consumer spending. It is possible that a higher return to labor would lead to some workers working less. However, an elevated underemployment rate suggests the higher take home pay will incentivize more labor.
In 2016, the United States had the third-highest corporate tax rate in the world. President Trump plans to more than halve corporate taxes from 39 percent to 15 percent. Under Trump’s plan, corporations could completely depreciate new investments in plant and equipment in the first tax year. These reforms should spur business investment and raise worker productivity. Multinational U.S. companies have avoided paying relatively high corporate tax rates by keeping more than $2 trillion of their profits overseas. President Trump plans to offer a one-time tax break of 10 percent of repatriated earnings. Based on previous tax breaks for repatriation, money may find its way into a variety of productive investments. Some of the cash may go to stock buybacks. Cash may also go towards business investment.
The Tax Foundation estimates that President Trump’s tax cuts would increase gross domestic product by a cumulative 7 to 8 percent over the next 10 years. The foundation says tax cuts would help grow the capital stock by 20 percent and would create 1.8 million jobs. The Tax Foundation estimates that job creation will come from tax-cut-related incentives to work and invest. On the downside, the Tax Policy Center points out that cuts would likely cause larger deficits and add to the national debt, unless offsetting spending cuts are made. A higher debt could lead to higher interest rates crowding out private investment.
Borrowing fills the difference between federal spending and federal revenue. Who is loaning the federal government all this money? Foreigners are the largest holders of Treasury securities. Foreign ownership of Treasury securities began to rise in the late 1970s. During the 1980s, the United States began to run a current account deficit. The current account deficit grew as once-agrarian countries industrialized because the United States could now import consumer goods at low cost from abroad. When the United States imports goods, other countries receive dollars. The foreign countries use the dollars to buy U.S. assets such as equities, real estate, and Treasury securities.
The share of Treasury securities owned by foreigners grew from the 1970s until the Great Recession. Prior to the 1970s, foreigners held an average 4.7 percent of marketable Treasury securities. During the 1970s, foreign ownership averaged 19.5 percent. By the 1990s, it had jumped to 25.6 percent. Foreign ownership peaked in 2008 at 56.5 percent. Since the Great Recession, foreigners have been reducing their purchases. In 2016, they became net sellers of Treasury securities for the first time since the early 2000s. In the third quarter of 2016, foreigners held just 45.2 percent of marketable Treasury securities. A large deficit and debt will be difficult to sustain if foreigners continue to reduce their holdings.
It remains unclear whether the two largest domestic holders of Treasury securities can increase purchases. U.S. household ownership of Treasury securities peaked at 43.1 percent in the first quarter of 1970. The share of Treasury securities owned by households declined from the early 1970s until the end of the Great Recession. During the 1970s, household ownership of Treasury securities averaged 30 percent of marketable Treasury debt outstanding. During the 1980s and 1990s, U.S. household ownership ranged from 22 percent to 24 percent. Between 2001 when the dot-com burst and 2007 when the housing-market bubbles burst, U.S. household ownership averaged 10.1 percent. Toward the end of the Great Recession, U.S. households owned just 2.7 percent of the marketable Treasury securities outstanding. Since the fourth quarter of 2008, though, U.S. household ownership has risen gradually to 8.6 percent in the third quarter of 2016.
The Federal Reserve is another holder of Treasury debt. It plans to eventually shrink its holdings of Treasury securities but is currently reinvesting principal payments from those securities. However, history is full of examples of central banks printing money to cover government spending. Should the U.S. government find itself in a funding crisis, the Fed could increase purchases of Treasury securities to make up for deficient foreign and private domestic demand.
The Federal Reserve will create problems if it prints money to purchase Treasury securities. First, by stepping in and buying Treasury securities, it might disincentivize Congress from putting the budget on a sustainable path. Second, monetizing the government debt will likely cause inflation. The government receives the new money first, spending it and pushing up prices. International investors will see the Fed buying Treasury securities. This will likely cause them to demand higher interest rates. Since many consumer interest rates are linked to Treasury rates, interest rates would rise across the economy.