Rents Augur Inflation
One such source is housing, the largest monthly expense for most Americans. Shelter is the single largest component of the Consumer Price Index (CPI), comprising 32 percent of the total. To measure month-to-month increases in all shelter costs, the Bureau of Labor Statistics (BLS) looks at rent and rent equivalents. As of February, year-over-year shelter costs are up 2.6 percent, the largest such annual increase since mid-2008.
For retirees living on a fixed budget and banking on Social Security cost of living adjustments (COLAs), this measurement is critical. But there is some discussion about whether the CPI accurately reflects the true cost of housing.
BLS breaks down the cost of shelter into “cost of rent” and “owners’ equivalent rent.” The cost of rent is easily measured and is meant to simply reflect monthly apartment rental costs. Owners’ equivalent rent, which comprises about 24 percent of the total CPI, is more difficult to measure. To do so, BLS estimates the rent that a permanent residence would command.
In other words, owner’s equivalent rent is estimated based on local rental prices. Rental prices, not home values, are the critical underlying factor in determining the CPI Shelter Index. This means that rental prices have a potentially outsized contribution to CPI inflation.
The result is fewer dramatic shifts in the overall CPI-W and CPI Shelter indices than would be otherwise predicted based on more volatile home prices (CPI-W is the index for wage earners and is the basis for Social Security COLAs).
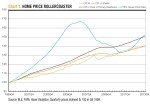
During the housing bubble, national home prices rose 67 percent according to the Federal Housing Finance Agency Housing Index. CPI Rent and CPI Shelter increases were much more modest at 29 and 26 percent (See Chart 1 on the left). The Great Recession has since brought home prices back in line with rents and slightly above the CPI Shelter measure.
Whether or not the CPI should more accurately reflect home prices is a subject of debate. Proponents of adjusting the current measurement cite the need for accurate CPI data for use in policy making. On the other hand, the recent volatility in home prices was likely not felt by housing market bystanders. As home prices dramatically rose and fell throughout the past decade, many folks, including most retirees, rode out the price changes on the sidelines. Had massive home price increases been used in Social Security COLAs, benefits would have jumped during the housing boom. This may have further threatened Social Security’s already tenuous financial position, although current retirees would have reaped the benefits.
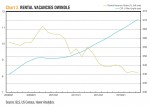
Inflation affects everyone differently and a single metric, even one as pervasive as shelter costs, cannot capture its nuances. When it comes to housing, for example, renters and owners often have very different experiences. Since 2009, rental vacancies have plummeted, resulting in national rental price increases of about 10 percent (See Chart 2). Americans who have decided to rent housing have likely seen significant cost increases. Homeowners, on the other hand, have likely not been subjected to this price increase since mortgages are contractually fixed over longer terms than rental agreements.
There may be continued downward pressure on rental vacancies. In the wake of the housing crisis, homeownership rates already have fallen from a 2005 peak of 69.2 percent to a current level of 65.1 percent.
Rising rental prices driven by increased demand stimulate a divide between renters and homeowners. Inflation as measured by the CPI does not capture this dichotomy. Rental costs and owners’ equivalent costs should both rise as a result of decreased rental vacancies, encouraging inflation as measured by the CPI upward.
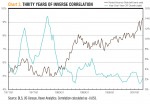
From the 1970’s through the early 2000’s, the correlation between rental vacancies and inflation was strongly negative. When vacancies went down, inflation went up (See Chart 3). Based on quarterly data from Q1 1971 through Q4 2002, the statistical correlation was about -0.65 (a correlation of negative 1 indicates that two data series are perfectly inversely correlated). From Q1 2003 through Q4 2013, however, the correlation has been nearly non-existent, calculated at -0.11.
Should this historical correlation re-appear and the pattern of decreased rental vacancies persist, we should expect higher inflation in the coming quarters. The effect on your household may depend on whether you’ve chosen to rent or buy.
Monthly Inflation Measures
Retail and Wholesale
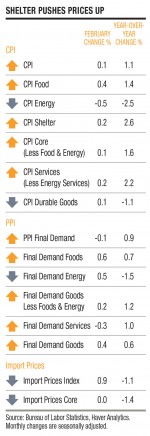
Inflation remains stubbornly low despite a number of factors in the economy that point to potential acceleration of price increases. The broad-based Consumer Price Index (CPI) was up 0.1 percent for February. The year-over-year increase fell from 1.6 to 1.1 percent.
Banks are not finding the incentives to lend at the pace that they have historically. Although the monetary base rose again in February, money supply is not growing to the degree that would stimulate inflation. Rather, bank reserves reached a new record high at $2.65 trillion, the bulk of which are excess reserves.
Reduced rental vacancy rates manifested in increased shelter prices, which moved upward and stood at a year-over-year gain of 2.6 percent. Among the major components of inflation, shelter trails only energy services in recent cost increases. Even medical care services, which have regularly outpaced other components over the last decade, have increased only 2.4 percent during the last 12 months.
Global food prices as measured by the UN food agency also jumped during February. Global increases were highest in sugar and oils. These increases were mirrored in the CPI, where food prices accounted for more than half of total price increases during February. Food and shelter alone drove over 90 percent of the total monthly CPI increase. With these prices and health care prices increasing, those that will feel the changes most will tend to be people in lower income brackets. Lower-income Americans spend a larger portion of income on basic services.
The Core CPI, which excludes food and energy, maintained stable, modest growth of 0.1 percent, the same as the broader CPI. The largest components of the Core CPI are shelter prices, medical care services, transportation services, and items such as apparel and vehicles. Considering shelter prices and medical care costs have seen annual increases greater than 2 percent, this means that the remainder of the Core CPI has had very low inflation. In fact, categories such as apparel and airline fares have decreased over the last year.
Import prices are also keeping inflation in check. Although they jumped 0.9 percent in January, the year-over-year change remained down 1.1 percent. The downward trend may reflect the relative strength of the dollar compared with U.S. trading partners, and the relative weaknesses of much of the global economy. Recent data have revealed softness in the Chinese economy. This is the third consecutive year in which China has disappointed early in the calendar year.
At the wholesale level, there’s not much indication of accelerated inflation. The Producer Price Index (PPI) decreased 0.1 percent for February and was up only 0.9 percent on a year-over-year basis. The PPI indicates inflation at a more rudimentary level than the CPI, and can often provide a short-term warning for increased consumer inflation. The current low reading does not imply such a warning.
Demand and Supply
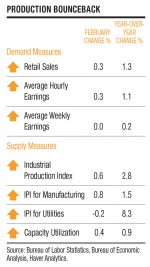
Retail sales figures for February reversed course from January and rose 0.3 percent. The January figures were revised downward, and it now looks like the weakness caused by weather in December and January will be felt in the annual figures for several months. Retail sales were still relatively weak on a year-over-year basis, up only 1.3 percent, the weakest reading since November 2009.
Short-term unemployment has fallen below its historical average, a positive sign for the economy. As more of these unemployed return to work, they should have more money to spend, a potential trigger for increased inflation. But real earnings are not increasing as typically expected. They ticked upward for hourly employees in February, but remained flat for weekly paid employees. Without more growth, average consumers may be discouraged from increasing spending and borrowing.
This may also help explain why consumer confidence has not been soaring despite indicators pointing toward an expanding economy. The Conference Board’s Consumer Confidence Index reading was 78.1 for February. This level is a measurable improvement from the depths of 2008, but still remained below the long-term average of about 92.6.
On the supply side, signs continue to point to modest inflation. The industrial production index (IPI) returned to growth in February, posting an increase of 0.6 percent. The January drop in the IPI was also revised upward. Although extreme weather affected production, it seems that effects were not as severe as first measured, and production has ramped up again. The IPI now stands at its all-time highest measure. When production is able to meet increased demand, inflationary pressures remain subdued.
Increased IPI measures were coupled with increased capacity utilization, which returned to its December level of 78.8 percent. Traditional capacity utilization rates above 80 percent may signal that supply could have difficulty keeping up with demand. But the current level indicates that manufacturing still has room for continued expansion.
Steady for Now
Rental vacancies and short-term unemployment are dwindling. Housing prices are recovering, equity prices are soaring. The monetary base and excess bank reserves are swelling. All the pieces are in place for inflation to rear its head, and yet it continues to plod along at a low level.
Inflation has proven to be persistent. In the current case, it is persistently low. If and when it starts to increase, it may be difficult to override it’s persistence at a higher level. Federal Reserve Chair Janet Yellen recently began outlining a strategy that could tamper inflation by increasing interest rates in the near future. Next month, we’ll look at the policy tools that the Fed has in place to combat inflation.
In the meantime, choose not to adjust your views based on month-to-month fluctuations. When long-term thinking is employed, better financial and economic decisions are possible.
[pdf-embedder url=”https://www.aier.org/wp-content/uploads/2014/03/AIER_IR_April_2014.pdf“]