Oil Prices Neutralize Inflation
Consumer prices
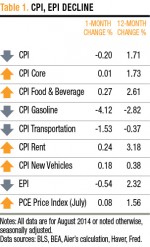
The headline Consumer Price Index for All Urban Consumers, a measure of the overall consumer price level, decreased in August 2014 at seasonally adjusted 0.2 percent. It’s the first monthly decline since April 2013. But on a year-over-year basis, the CPI advanced 1.71 percent, which is below the Federal Reserve’s 2 percent inflation target.
For Digital or Print Copies of AIER Research, Click Here
Look at the CPI breakdown in Table 1 to see the underlying factors responsible for the CPI decline. The CPI Core, excluding food and energy, barely changed from the last month. The dominant factor for the month was a big decline in gasoline prices. The CPI for gasoline dropped 4.12 percent in August, after falling 0.35 percent in July. It also decreased by 2.82 percent compared to the same month last year, meaning the decline is not only caused by seasonal factors.
CPI for transportation is another negative contributor, falling 1.53 percent over the last month and 0.37 percent over a year earlier. By contrast, the CPI indexes for food, rent and new vehicles all rose in August compared with last month, as well as compared to the same month in 2013.
Unlike the CPI, AIER’s Everyday Price Index (EPI) sheds light on frequently changing prices that consumers face every month. Monthly mortgage or rent payments, for instance, are excluded from EPI because they are contractually fixed for the short run. But food and energy are weighted more heavily. As a result, the EPI fell by 0.54 percent in August, more than the decline in the CPI.
Both the CPI and EPI are price indexes based on a selected market basket of consumer goods and services. The fixed market basket of goods and the weights assigned to the items in the basket are revised or updated quite infrequently. But the consumer’s buying habits and decisions made in response to price changes can change dramatically within a couple of years.
The Personal Consumption Expenditure (PCE) Price Index, published by the Bureau of Economic Analysis, measures price changes based on the actual consumer expenditures. It takes into account changes in consumers’ month-to-month spending patterns. Inflation measured by CPI and PCE shows slightly different trends of movement (see Chart 1).
Overall, the PCE price index shows more moderate price changes than the CPI because consumers change what they buy when prices of individual goods go up or down. For example, when apples are more expensive in the summer, consumers may substitute in-season peaches. The PCE price index measures price changes that are actually experienced by consumers who change what they put into their basket based on current prices, while CPI misleads. The PCE price index is favored by the Federal Reserve for taking the inflationary pulse of the economy as actually experienced by consumers, while the CPI is more commonly used by businesses for their decision making.
Wholesale prices
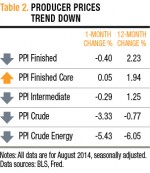
On the wholesale front, the Producer Price Index (PPI)measures prices experienced by producers at the various stages of the production process. The PPI Finished Goods, PPI Intermediate Goods, and PPI Crude Materials Indexes all trended down in August from the last month, driven by the decline in oil prices (see Table 2). But the PPI Finished Goods Index rose 2.23 percent over the past 12 months, a greater increase than the overall CPI for the same time period, foreshadowing future upward price pressures for consumers.
There are reasons to expect that producer price changes will transfer to consumer prices. While changes in production costs are likely to be passed along to consumers, this is not always true. Businesses are slower to lower retail prices than they are to raise them in the face of changing production costs (see AIER’s Inflation Report in March 2014).
Furthermore, while businesses would like to pass higher costs on to consumers, doing so comes at a risk. Raising retail prices normally results in reducing sales. Another reason for businesses’ reluctance to change prices is the costs of doing so. Menu costs is a concept economists use to describe the cost to businesses when they change their prices. The term comes from all the hidden costs a restaurant bears when it raises prices on the menu: the costs of printing new menus, advertising new prices, the labor cost for working on the new pricing strategies, and all the other hidden costs the business must accept to institute the price change.
Overall, wholesale prices fell month-to-month in August, but rose year-to-year. Either way, we don’t see an immediate linkage between changes in wholesale prices and consumer prices. But if the fall of wholesale prices continues, we will expect to see this downward pressure on consumer prices down the line.
Demand
So far we have reviewed the current price changes on both consumer side and the producer side. What drives future inflation beneath the surface? In the near term, changes in demand and supply are a major source of price changes. But it takes time for prices to react to such changes. The current demand and supply situation provides insight into the inflation climate in the foreseeable future.
Table 3 provides several important indicators of aggregate demand. Real Gross Domestic Product, the broadest measure of the total demand in the economy, advanced 4.2 percent in the second quarter. The important Real Retail Sales indicator is up by a monthly rate of 0.78 percent in August and 3.23 percent year-over-year. The annual growth of real retail sales in August was the highest level in 12 months.
Consumer spending makes up more than two-thirds of total demand. The most important determinant of consumer spending is people’s income after taxes and government payments such as Social Security, farm commodity subsidies, or disaster relief. This after-tax income is called Real Personal Disposable Income. It takes into account not only income that people receive but also taxes people need to pay, indicating how much cash is remaining in people’s hands for making purchases. Real disposable income grew for the seventh consecutive month in July.
Consumer credit also directly reflects consumer demand, which results in spending. People borrow money from banks and other lenders to buy things, especially durables such as cars, boats, furniture, or appliances. As a result, consumer credit is highly correlated with core consumer prices.
But, again, prices lag behind changes in other economic variables. We found a high positive correlation of 0.76 (out of 1) between consumer credit and four-month lagged CPI Core inflation for the period of January 2000 to the present. This means that more than 75 percent of the change in CPI Core Inflation can be accounted for by changes in consumer credit.
Consumer credit in July advanced a seasonally adjusted 0.81 percent on a monthly basis. Over the last 12 months, it trended up by 7.02 percent, a record high since November 2011, indicating a high likelihood of CPI Core inflation in coming months.
Supply
Demand is only one side of the inflation story. Supply is the other side. Demand and supply work together to determine the price.
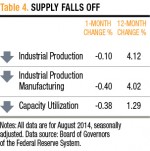
The Industrial Production Index published by the Board of Governors of the Federal Reserve System, measures real output from manufacturing, mining, and electric and gas utilities. This index fell by 0.1 percent in August after six consecutive months of growth. The drop in industrial production this month is mainly driven by a big decline in manufacturing. (See Table 4.)
The increase in demand from consumers and the decrease in supply from the drop in manufacturing, point in the same direction, suggesting a scenario of increased inflation in the future.
However, supply could catch up with the increased demand as the nation’s factories are not currently operating at full capacity. The Capacity Utilization Rate is the measure that gives us an insight into the extent to which the nation’s capacity of production is used. In August, the capacity utilization rate in the U.S. edged down 0.38 percent from July to 78.8, which is lower than the past 25 years’ average of 79.7. The low capacity utilization shows room for supply to improve, indicating possibilities that the temporary demand-driven inflation, if it happens, won’t last long.
Besides the effect of demand and supply on core inflation, oil prices could have a dominant impact on the future overall price level as it did in this month. Increased oil production in the U.S. and sluggish demand for oil are helping to create an oil surplus. The monthly average WTI crude oil spot price (West Texas Intermediate, a benchmark grade of crude oil for oil pricing) fell from a high of $106 a barrel in June to $97 a barrel in August. The U.S. Energy Information Administration (EIA) projects that WTI crude oil prices will continue falling to an average of $93 a barrel in the fourth quarter of 2014 and $95 a barrel in 2015.
If the EIA’s projection is accurate, a decrease in oil prices in the months ahead will directly result in a decline in gasoline prices, which would offset the upward inflationary pressures created by the increased consumer demand and the decreased production. Consequently, even with an up-trending core price index, we would expect the continuation of only moderate price changes.
Money
Changes in demand and supply affect prices in the near term. But in the longer run, money is the only factor that creates inflation. When abundant money in the economy chases an inadequate amount of goods and services, inflation occurs.
Money-supply growth may be restrained by the rising interest rates and the new liquidity rules for banks in the medium term. Based on the Federal Reserve’s public announcements, it is widely expected that the Fed will raise short-term interest rates in mid-2015. Higher interest rates make borrowing more expensive, hurting bank lending, and reducing the amount of money in circulation.
The coming new liquidity rules (really illiquidity rules) will require banks to hold more safe assets, such as cash and government bonds. These new liquidity rules will restrain banks from making loans at the pace they had prior to the financial crisis. Depressed bank lending slows the money transmission mechanism and puts a downward pressure on inflation.
Working in the opposite direction are excess reserves. These have reached $2.7 trillion, creating a ready pool of cash for banks to lend when the economy fully recovers and demand increases.
All in all, higher interest rates and more liquidity requirements should restrain the money supply from growing as fast as it could as the economy recovers, limiting signs of high inflation in the medium term. But in the long run, if the massive free reserves are poured into the economy and transform to the money supply, runaway inflation, in the absence of the same level of growth in the supply of goods and services, will be on the way.
Conclusions
Falling oil prices played an important role in the inflation landscape in August. Consumers as well as producers experienced lower prices.
Going forward, higher demand due to the increases in disposable personal income and consumer credit, and a temporary decrease in supply due to the drop in production, point to a likely inflationary climate in coming months, especially for core goods and services. But a likely continuing fall of oil prices should offset these pressures. Overall, moderate price inflation is expected to continue.
Over the longer term, the new liquidity rules for banks and rising interest rates will likely restrain money supply growth, putting downward pressures on inflation. However, the massive excess reserves sitting in the banking system are still a big concern. When the free reserves are converted into loans, the money supply will expand, and prices will move along with it.


