Inflation

Scorecard
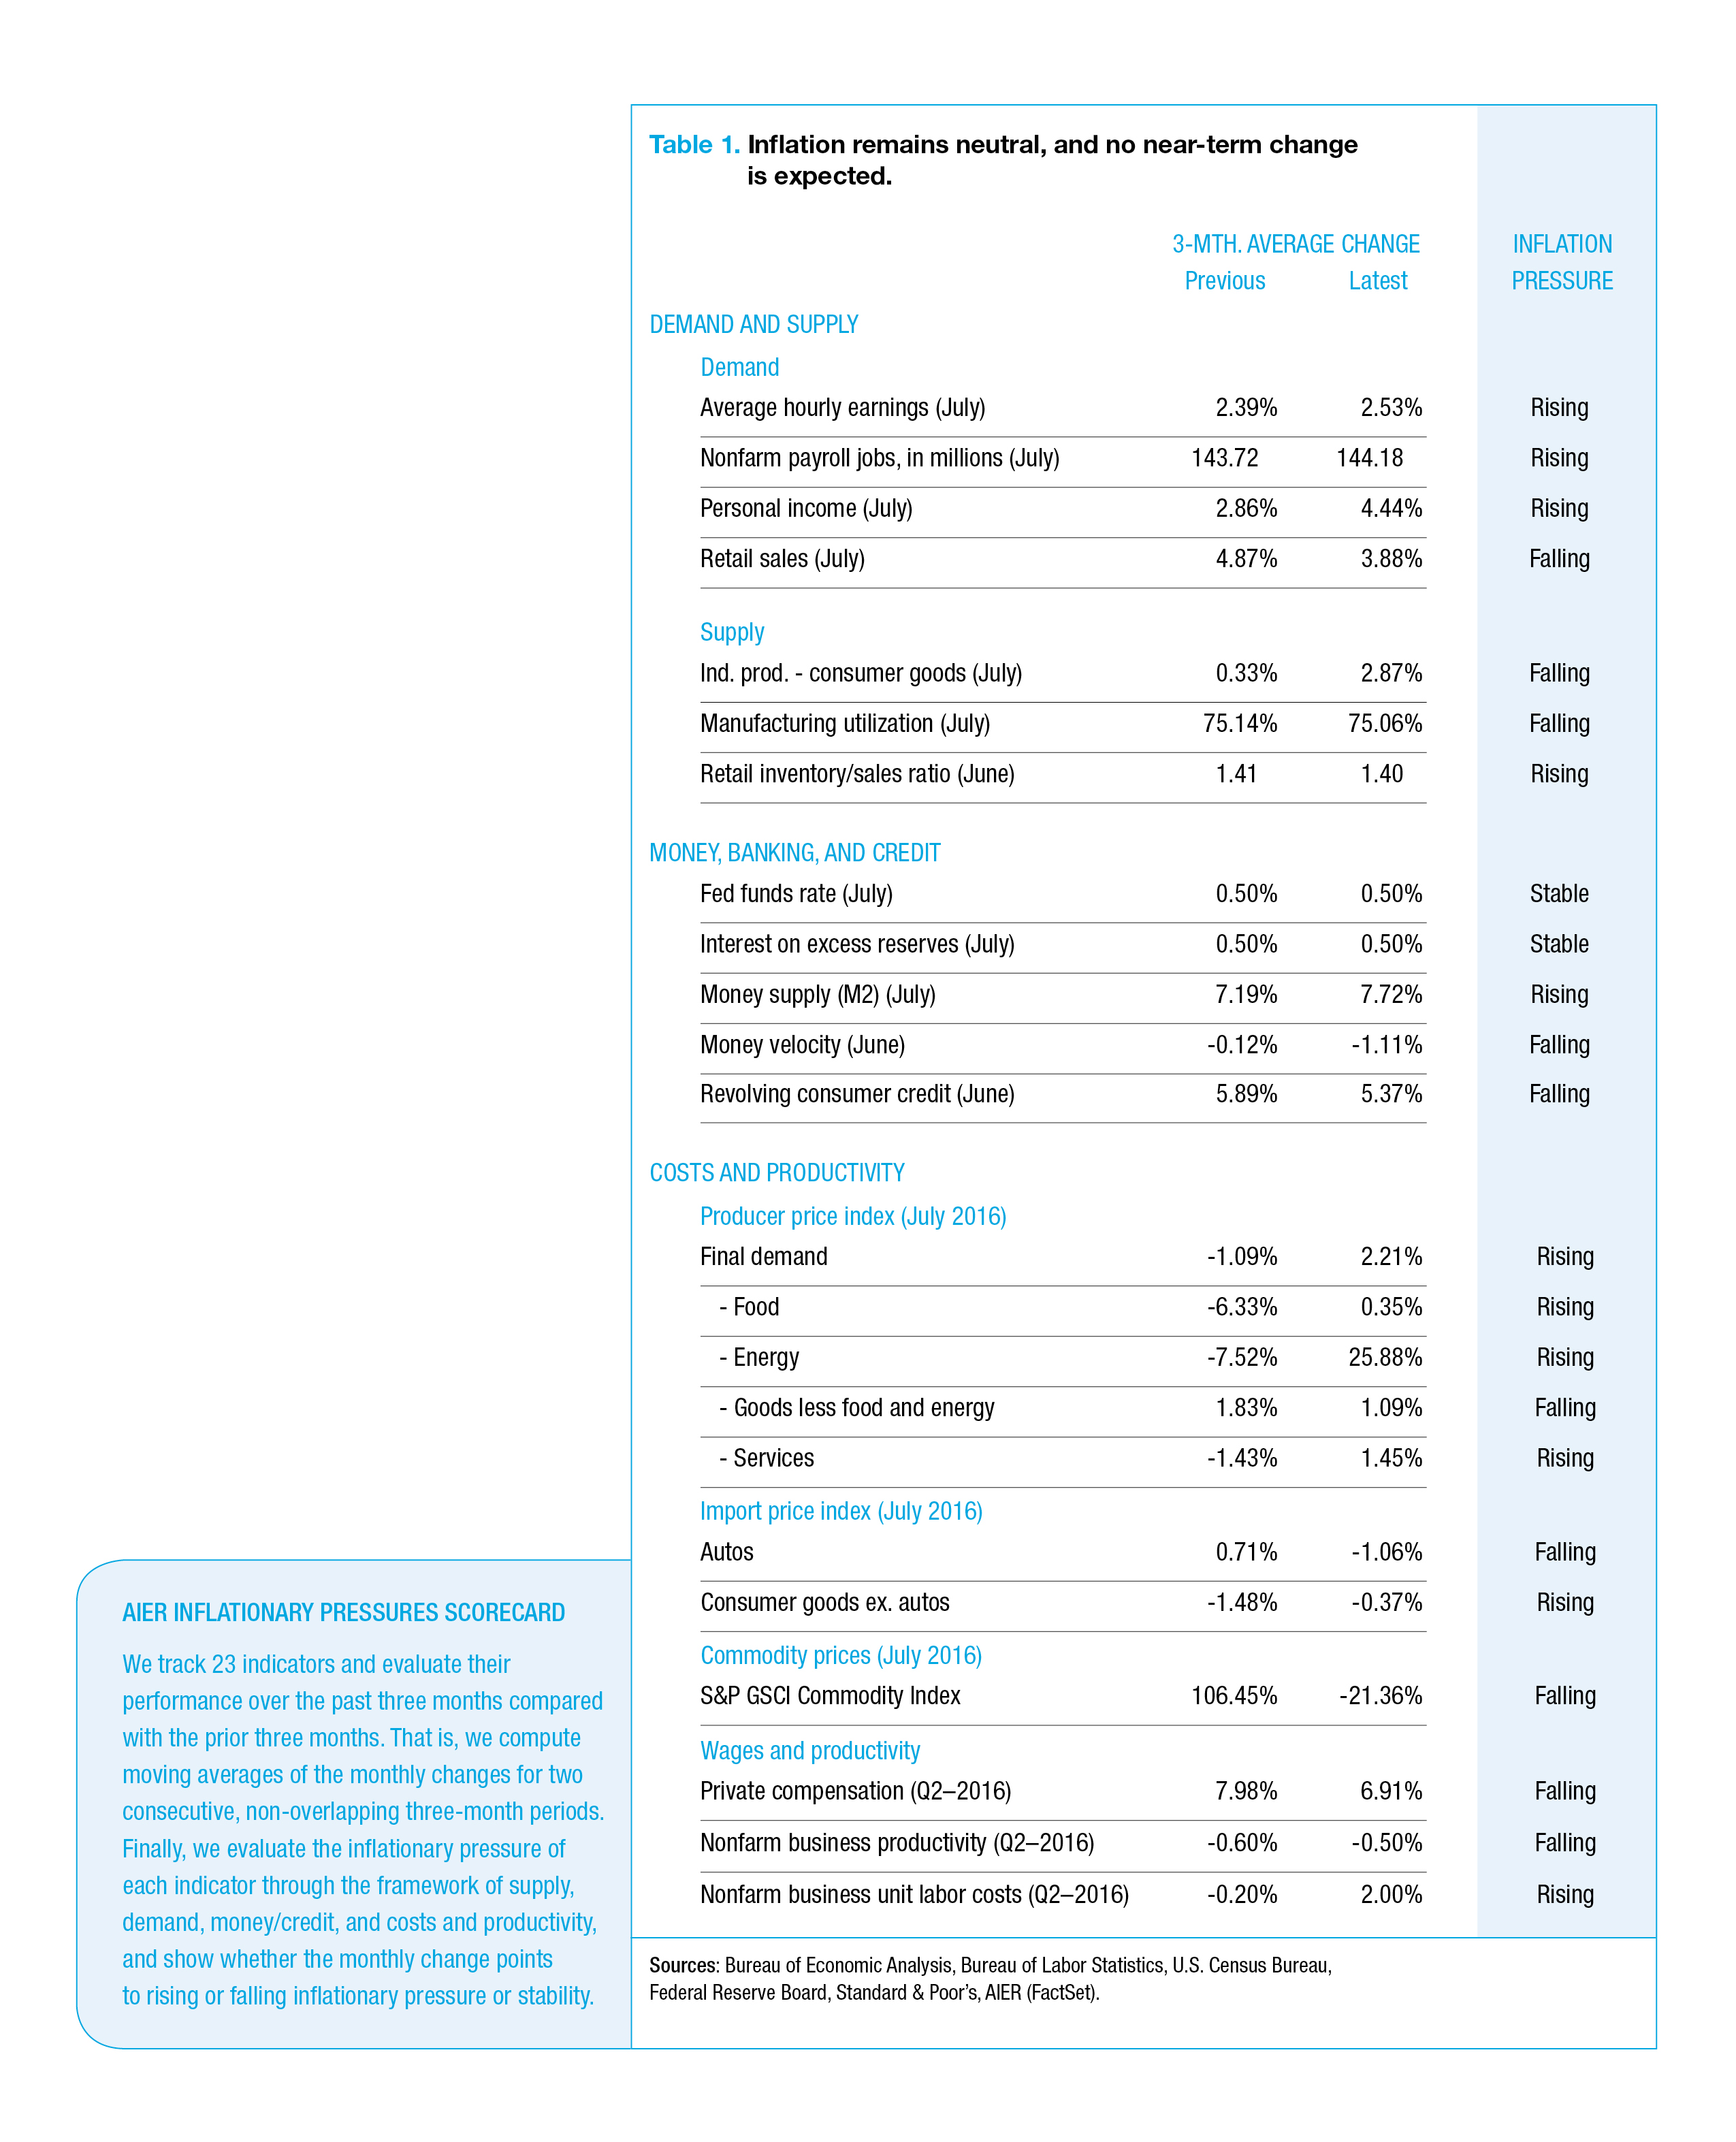
The outlook for inflation remains neutral overall based on data through July. Out of 23 indicators tracked by the AIER’s Inflationary Pressures Scorecard, 11 point to rising inflationary pressure, down from the 13 rising indicators we reported two months ago. Of the remaining indicators, 10 point to falling pressure, and two are neutral.
Indicators of consumer demand mostly point to rising inflationary pressure, but they are largely offset by the supply indicators, suggesting an easing of price pressures.
Monetary policy does not push inflation one way or another, as both the federal funds rate and the interest on excess reserves are stable. But the credit markets suggest an easing of inflationary pressures, with falling money velocity and slowing consumer credit.
Within cost trends, producer prices suggest mostly rising inflationary pressure for the near future. This is offset by the falling inflationary pressure coming from a slowdown in wages and commodity prices as well as somewhat better productivity.
Absent unexpected developments, inflation is unlikely to change significantly in the upcoming months.
Consumer Price Index Analysis
Energy prices, an important part of the Consumer Price Index, reversed direction in July and fell after rising for four months. Food prices, another major component of overall consumer prices, were unchanged, as was the CPI. Declining energy prices also contributed to a drop in AIER’s Everyday Price Index. (See Table 2.)
Over the past 12 months, the CPI rose only 0.9 percent, the smallest annual increase since January’s reading and much below its past long-term average growth of 2.1 percent a year. Slow growth in food prices and falling energy costs over the past year are major contributors to the slow CPI growth.
Core CPI, which excludes the volatile prices of food and energy, posted a 0.1 percent increase in July and a 2.2 percent increase in the past 12 months, in line with its long-term trends. There are a few notable recent reversals in price trends in addition to those in energy. Prices for education and for transportation services, which tend to rise, fell in July. On the other hand, new vehicle prices rose, reversing a downward trend since March.
Other price trends continued on their historical path. Core goods prices (which exclude food and energy) are falling slowly, in line with the average trend seen in the past five years. Core services prices (which exclude energy services) are rising. In the past 12 months they rose 3.1 percent, a bit faster than the historical long-term average of 2.8 percent a year and significantly faster than the prices of core goods, which fell 0.7 percent in the past 12 months. This faster growth of services compared with goods prices has been a long-standing phenomenon of consumer prices.
Everyday Price Index
AIER’s Everyday Price Index fell 0.4 percent in July from June, driven by the first drop in energy prices in five months. The EPI measures price changes that people see in monthly purchases such as groceries, gasoline, and utilities.
The more widely known price gauge, the Consumer Price Index reported by the Bureau of Labor Statistics, fell 0.2 percent for the month on a seasonally unadjusted basis and 1 percent over the past 12 months. The EPI is not seasonally adjusted, so we compare it with the unadjusted CPI.
The EPI’s decline was driven by a 5.5 percent drop in gasoline prices, which offset an increase in other energy prices. Dropping gas prices are partially due to increased domestic production, which is 42 percent above 2012 levels.
Prices for prescription drugs have risen 4.4 percent over the past year, while consumer spending on prescription drugs slowed to 0.8 percent annual growth in June. The drop in prescription drug spending is part of a slowdown in health-care spending, which fell to 4.1 percent in June from a record high of 6.6 percent annual growth in 2015.
https://www.aier.org/epi
Next/Previous Section:
1. Overview
2. Economy
3. Inflation
4. Policy
5. Investing
6. Pulling It All Together/Appendix