Economy


Consumers remain king, and most data suggest their reign will continue.
The U.S. economy is diverse and complex. Not all segments follow the same growth path. Private domestic demand, consisting of consumer spending, business fixed investment, and residential investment, accounts for about 85 percent of GDP. The dynamic between consumer spending and business investment is generally symbiotic: One reinforces the other. Not so with other components of GDP, such as net trade, which depends on exchange rates and the business cycles in other economies; or government spending, which is a function of the legislative process. While these contribute to economic growth and are worthy of analysis, domestic demand remains the key to overall economic performance.
Critical to domestic demand is the consumer. Since the end of the Great Recession, the consumer sector has improved dramatically, though the pace has been slow and erratic at times. More than 15.6 million jobs have been created since the low of 129.7 million in 2010, putting total nonfarm employment at a record 145.3 million. Despite new jobs being created, about 5 million positions remain unfilled. At the same time, the pool of available workers, that is, the number of unemployed plus people who want a job but are not looking, has dwindled. Those two trends have reduced the number of available workers per opening to just 2.4 from a high of more than nine at the end of the recession (Chart 2). This tightening labor market has resulted in more workers changing jobs, presumably for better paying ones, as well as a faster gain in average hourly earnings for private-sector workers. Average hourly earnings have risen about 2.9 percent over the past year through December 2016 compared with an average pace of about 2 percent between 2010 and 2014 (Chart 2).
Trends suggest consumer spending will support further economic gains.
In addition to better job prospects and accelerating wage gains, consumers are also benefiting from falling energy prices, rising equity prices, and an improving real estate market. Total assets for the household sector rose to $105.1 trillion as of the third quarter of 2016, a gain of $5.6 trillion from the third quarter of 2015. Households increased their liabilities by just $469.3 billion, pushing total net worth up to $90.2 trillion.
Total liabilities have increased at just a 0.27 percent annualized pace since the third quarter of 2008, the peak before consumers began cutting back on their debt. This deleveraging combined with low interest rates and gains in personal income have driven the household-debt service ratio to near all-time lows. Finally, households have also managed to boost saving rates to about 10 percent from a low of just over 4 percent in 2007, though the 10 percent rate is still well below the peak of about 18 percent in the early 1970s.
Taken together, these trends have helped boost consumer expectations about the economy, a positive sign for future consumer spending. According to data from the University of Michigan Survey of Consumer Sentiment, the expectations index (a component of our Leaders index) rose to 90.3 in January. That is just the second time since 2005 that the index has surpassed 90.
Over the past 30 years or so, the trend in the expectations index has been a good indicator for the direction of consumer spending, leading personal consumption expenditures by about eight months (Chart 3). If that relationship holds, it would suggest a generally positive outlook for consumer demand and the economy overall.
Economic Outlook
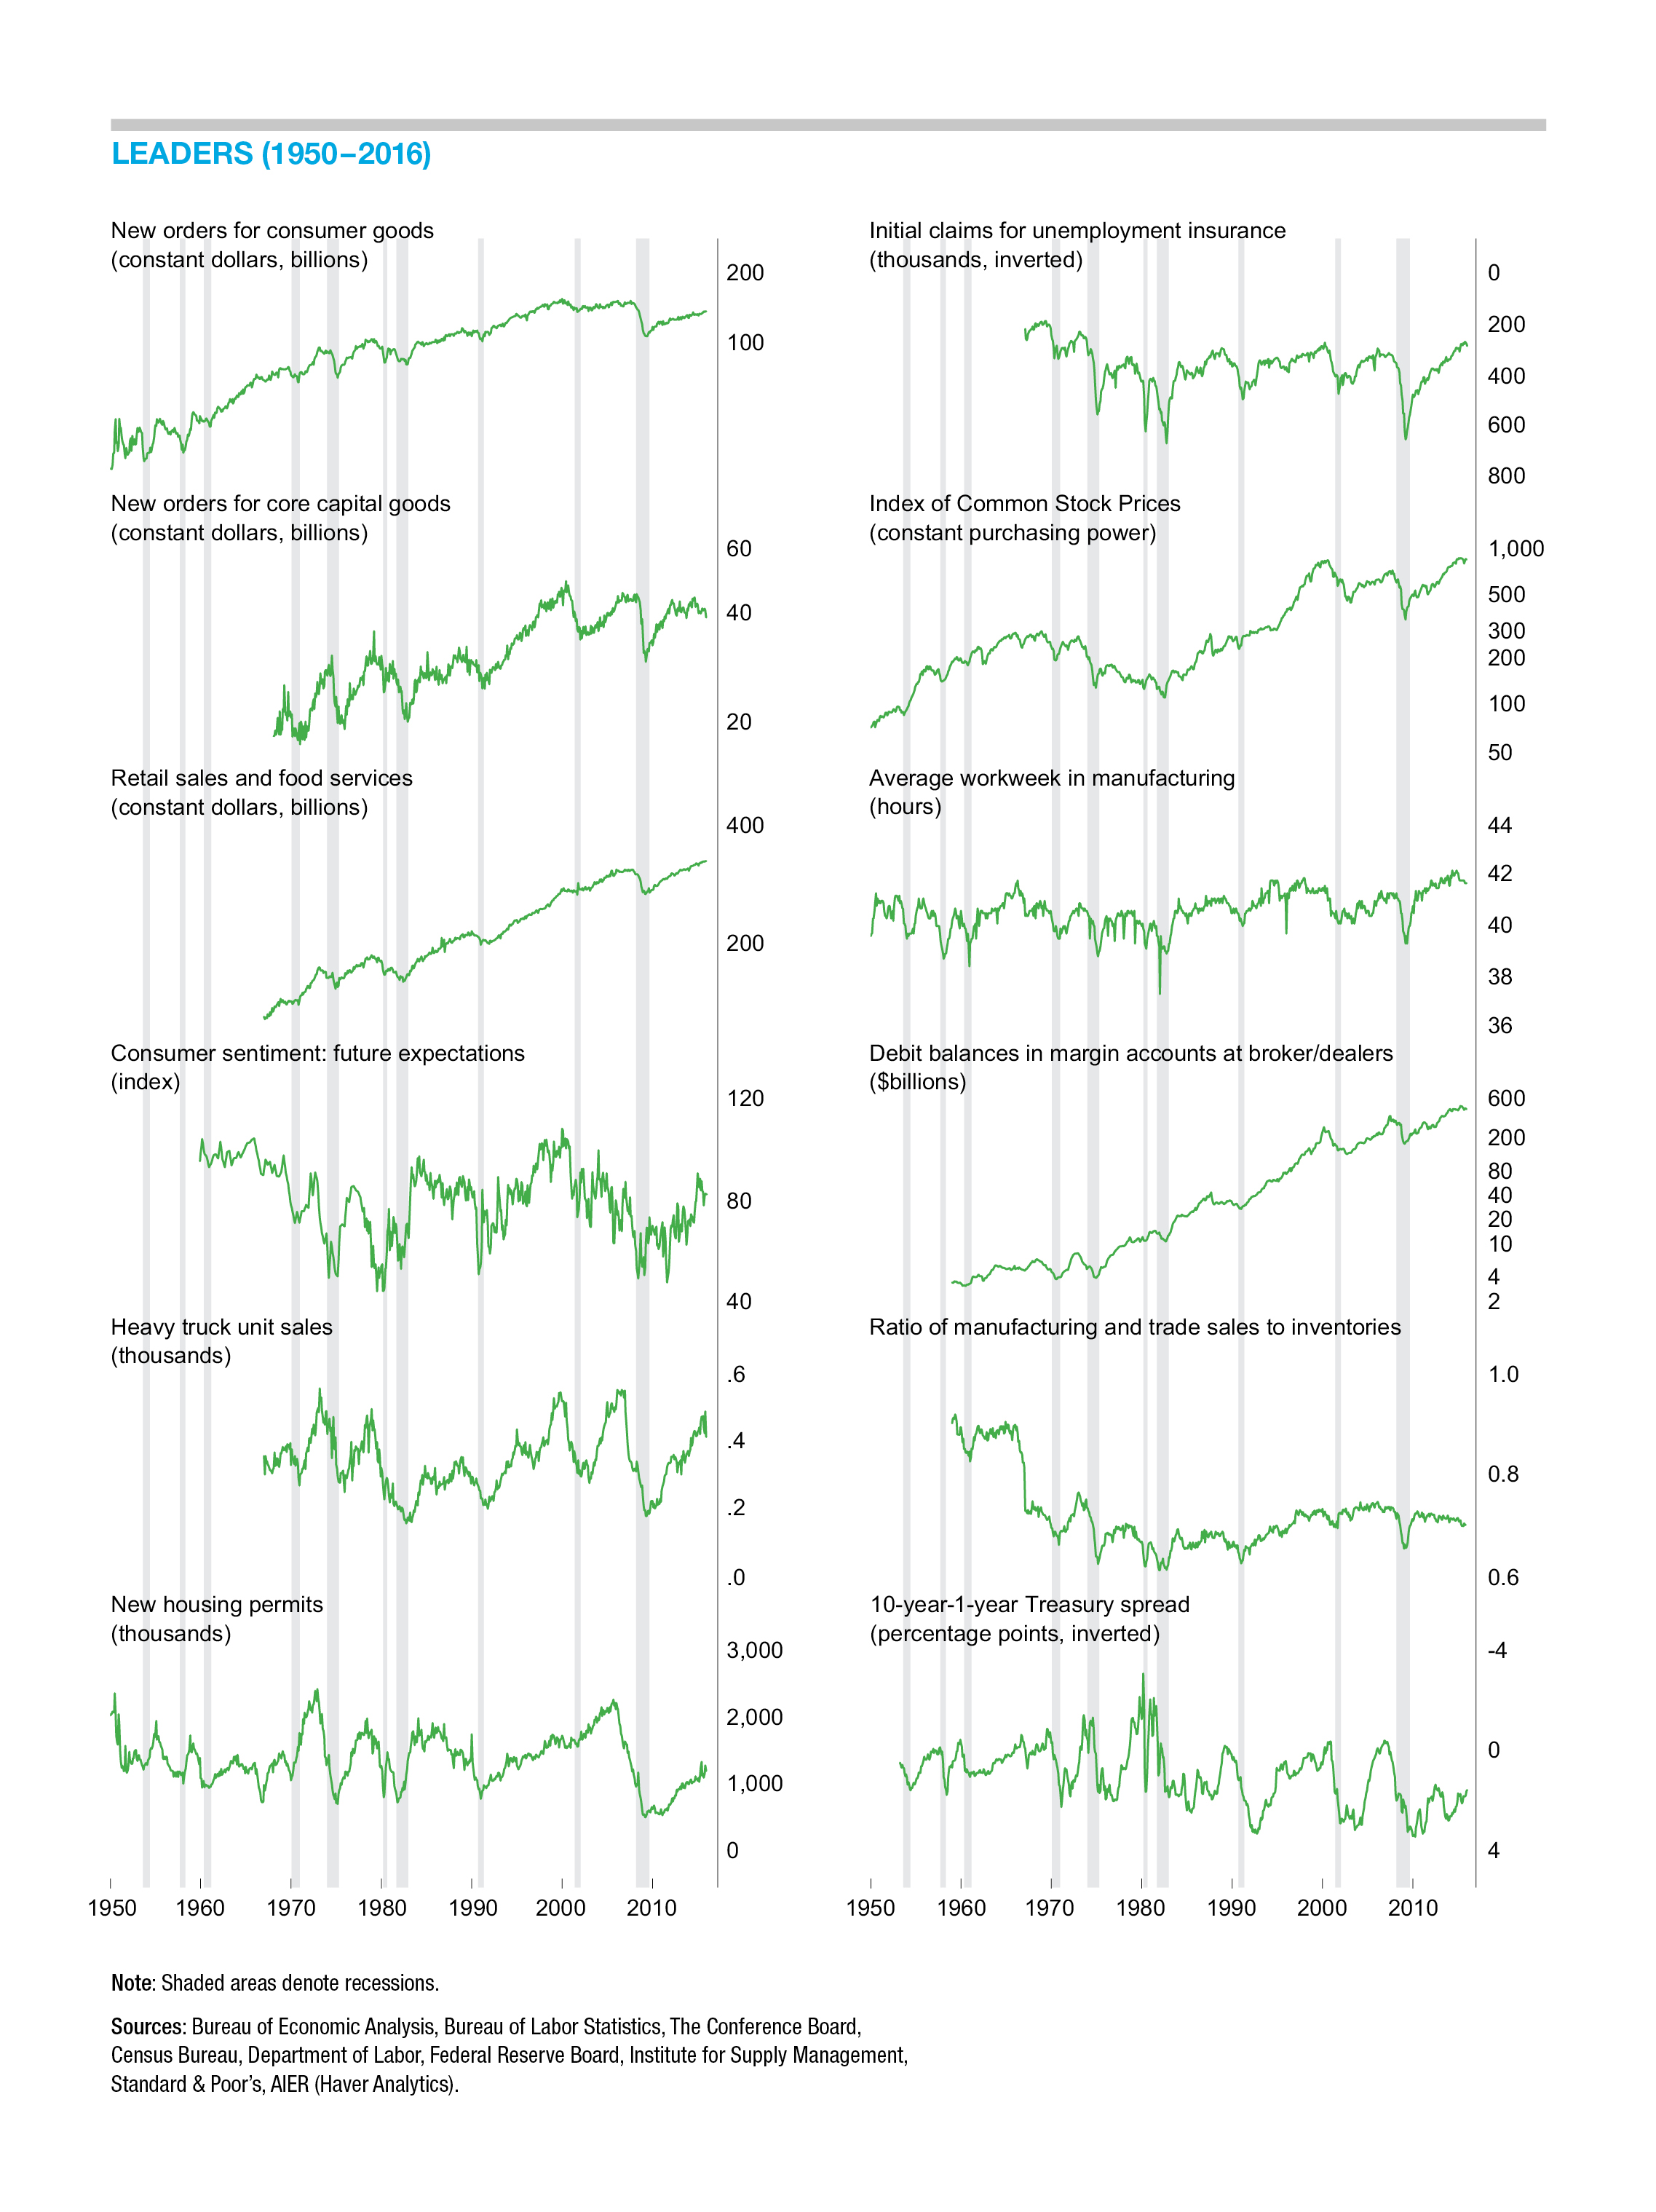
Our Business-Cycle Conditions Leaders index was unchanged at 75 in the latest month, following four consecutive monthly increases. The index is holding at its highest level since December 2014 and is well above neutral 50 (Chart 4).
Among our 12 Leaders, eight are trending higher, two are flat, and two are trending lower. Those trending higher are initial claims for unemployment insurance, real retail sales, manufacturing and trade sales-to-inventories, real new orders for capital goods, consumer expectations, residential housing permits, real stock prices, and real debit balances in margin accounts. Flat trends have been identified in real new orders for consumer goods and the average workweek in manufacturing. The decliners include real heavy-truck unit sales and the Treasury-yield spread.
While the improvement in our Leaders index provides further evidence that the risk of recession in the near term has diminished significantly, we do not expect a sharply different pace of growth. Headwinds persist, such as unfavorable demographics, low productivity growth, a strong dollar, and weak global growth. In addition, it is impossible to evaluate any potential impact on the economy from the as-yet undefined polices of the new Trump administration.
Among our other indexes, the Coinciders held at 83 in January, while the Laggers jumped to 92 from 75 in the prior month.
Next/Previous Section:
1. Overview
2. Economy
3. Inflation
4. Policy
5. Investing