Focus on the Covid-19 Death Rate


In the saga of the virus and the lockdown, the wisdom of the crowds, that is the wisdom of each of us, was thwarted by bad data, perhaps intentionally bad. On the other hand, the ersatz wisdom of the collective bureaucracy in federal, state and local health agencies was based on crafted data. In the end data didn’t matter, as the bureaucracies were more concerned with their natural territorial imperative, which is to rule and control.
The most frightening aspect of the coronavirus-19 (COVID-19) epidemic in the US is that it brought about exaggeratedly heightened fear of death. That fear, once magnified to proportions which become palpable to the individual, became the basis for dreadful economic and medical policies from governments and crushed the natural optimism of the public.
In early days, we were caught in a squeeze of conflicting information. Was COVID-19 a bioweapon gone rogue and destined to indiscriminately wipe out young and old? Or, was it another bad flu or perhaps an extremely bad flu? After all, initial information showed the victims were concentrated in a nursing home in Kirkland, Washington.
No cases were reported amongst the homeless on West Coast streets. No deaths among children were reported. And in the closed world of cruise liners and later a military ship, there were lots of early cases and some deaths. As time passed, there was little more bad news. We should have been suspicious of the data.
We were mainly focused on the case fatality rate (CFR: deaths as a percent of diagnosed cases) which were frighteningly high. We worried about the infection fatality rate (IFR), but there was too little data and testing available to have any idea how many people were or ultimately would be infected.
But those concepts – CFR and IFR – are not the most important strategic measures of the severity of the disease. It is the death rate, properly defined and understood, that should matter for long-term policy makers, our erstwhile more level-headed thinkers, in determining policy.
In the past few weeks, we have obtained more useful data in the US. There were secrets lurking in the data, waiting to be uncovered, that could help ascertain what was really happening. The purpose of this report is to do just that – to ascertain what the data are telling us. It also gives us the basis for judging the appropriateness of past and present policies
So, let’s begin with a simple question: what is the relevant death rate due to COVID-19? There are many definitions in the epidemiological world such as the CFR and IFR mentioned above. My focus is on the overall death rate – actual and projected. Until we have more widespread testing for COVID-19, we cannot know with any accuracy how many people were infected by the virus. We cannot know what proportion of the population has some sort of natural or acquired immunity.
We do not even have accurate data on how many people have died from COVID-19 alone versus COVID-19 plus some other complications that were already present such as diabetes, morbid obesity and prior respiratory complications, any one of which might equally have been the proximate cause of death. There is ample evidence, especially in the Northeast region that there has been “over classification” (a euphemism for data bias). We do not have the demographic details for those infected and those who died. But we do have death data, and it is more accurate than the number of cases and the number of infections.
To understand how our minds have been misdirected in understanding the real risks associated with COVID-19, let’s begin with a brain teaser. It will awaken our numerate minds in preparation for understanding the data deception and misunderstandings that prevail.
When is 1.7% greater than 98.3%?
In the bizarro world of COVID-19 reporting that is the case – 1.7% is greater than 98.3%. Specifically, deaths among a narrow 1.7% group of the population are greater than deaths from the other 98.3%. Numerically a death may be a death, but from a policy point of view, to be blunt about it, not all deaths are the same.
Fact #1: 1.7% of the population in the US resides in long-term medical care facilities (LTMCFs) and total 5.7 million.
Fact #2: The residents of LTMCFs accounted for 38,800 or 53% of all COVID-19 deaths (based on recent data). The rest of the country, the 98.3%, have experienced approximately 34,600 deaths, or 47% of the nation’s total COVID-19 deaths.
The Death Rate at LTMCFs Is Stunning
That means the death rate, deaths expressed as a percent of those living in medical care institutions, is 0.682%, more than 50 times the death rate of the rest of the population at 0.012%. The death rate for the overall populations is 0.022%.
That should leave you speechless.
We have a COVID-19 problem, but we have an even greater and more serious LTMCF problem that is clouding our understanding of the contagion and therefore what our best public health policies should be. Shutting down the economy, the world wherein the 98.3% live and prosper was too draconian. The feared overloading of the hospital system with emergency patients, which was short-lived, was disproportionately coming from the residents of LTMCFs, not the general public.
The data have been there all along, but they were not properly collected, catalogued and analyzed.
Much of the data in this report came from a landmark study by Gregg Girvan and Avik Roy of the Foundation for Research of Equal Opportunity. Their work was based on data collected through May 10th, 2020 for most states. Since their publication, revisions have been incorporated as states have corrected or updated their data since the original report. The calculations given above are imputations from the updated data.
At this point, we do not know what the ultimate count of deaths and the death rate will be, but what we have in hand are statistics that are very indicative and telling of the gross misunderstanding that the public and federal, state and local decision-makers have been working with on which to base their decisions.
Long-term medical care providers to the aged and medically infirm (per the Girvan-Roy study) consist of: Nursing homes and skilled nursing facilities; Assisted living facilities, i.e., residential care communities or personal care homes; Adult day service centers; Home health Agencies; and Hospices.
The first two medical care providers for seniors are referred to as long-term medical care facilities (LTMCF) and are the source of the data. Data for the other three elder care facilities are not collected or were not available for the Girvan-Roy study. In fact, it has been acknowledged that there continues to be underreporting of deaths related to LTMCFs. Some providers are just not reporting. In other cases, the residents die in hospitals and they are not categorized as LTMCF deaths. Nonetheless, the data are sufficient to draw some useful if not stark observations.
What about the Flu and Pneumonia Death Rates in Earlier Years?
To even better understand these death rate figures, it is useful to put them into the context of what we know about death rates from the flu before the arrival of COVID-19. Is the COVID-19 death rate worse, better or about the same as prior flu seasons? We should expect the rates to be worse because there is no vaccine whereas most people get a vaccine shot for the routine flus that are expected each year.
In 2017 the Centers for Disease Control (CDC) reported that annual deaths from all causes were 2.8 million or 0.866% of the population. The leading causes of death, in order of magnitude, were heart disease, cancer, accidents, respiratory disease, stroke, Alzheimer’s disease, diabetes, flu & pneumonia and suicide.
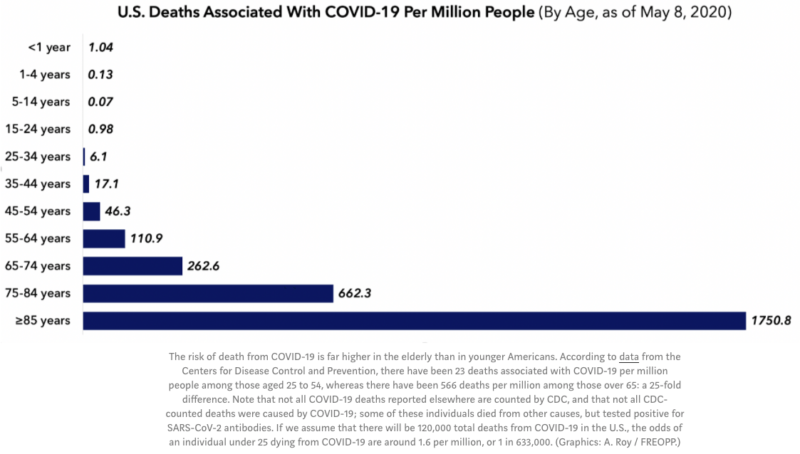
Just looking at the Flu & Pneumonia (FP) cause, in 2017 it accounted for 55,672 deaths or 0.017% for the population as a whole. Death from FP, as you would expect, fell hardest on people over 75 totaling 38,078 deaths. That translates into a FP death rate of 0.180% for those over-75 group, which is a little more than 10 times the death rate for the overall population. For the rest of the population under 75 the death rate was only 0.006%, or or 1/30th of those over 75 (0.006% vs 0.180%).
DEATH RATE FOR COVID-19 AND THE FLU FOR SELECTED DEMOGRAPHICS
| 2020 COVID-19 | 2017 Flu & Pneumonia | |
| Overall Death Rate | 0.022% | 0.017% |
| Over 75 DR | 0.161% | 0.180% |
| LTMCFs DR | 0.682% | |
| Non-LTMCFs DR | 0.011% | |
| Under 75 DR | 0.010% | 0.006% |
What this means at this point is that in the aggregate the overall COVID-19 death rate is slightly worse than the flu death rate in a prior year (0.022% vs 0.017%). However, for seniors in LTMCFs, the COVID-19 death rate is 100 times greater than the flu and pneumonia DR was for those under 75 in 2017 (0.682% vs 0.006%) and nearly 4 times greater than those over 75.
In summary the COVID-19 death rate is far more skewed to those older than 75 and those residents in medical care facilities for the aged.
What Does the Future Hold?
Looking ahead we obtained the most recent forecast from the Institute for Health Metrics and Evaluation (IHME) at the University of Washington. They are considered by many medical professionals as the most thorough modelers. On May 18, 2020 the IHME released the results of the third run of its new model. They predict that by August 4, 2020 a total of 143,357 Americans will die of COVID-19. That forecast nearly doubles the number of COVID-19 deaths. It is worth noting that each run of the model has produced lower forecasts for future deaths. There are detractors of their modeling procedures, but it is the best we have at the moment.
One interesting medical research report suggests that a significant portion of the population has natural immunity to COVID-19. In the May 14 edition of Cell, published by Elsevier, the researchers found:
T cell responses were detected in 40-60% of unexposed individuals. This may be reflective of some degree of cross-reactive, preexisting immunity to SARSCoV-2 in some, but not all, individuals… suggesting cross-reactive T cell recognition between circulating ‘common cold’ coronaviruses and SARS-CoV-2.
This might be why there are so many reports of asymptomatic cases of COVID-19. That also may mean the IHME forecast will be revised down even more.
However, COVID-19 has brutal consequences for people over 75. That detail cannot be minimized. But what policies would that suggest?
Did We Adopt the Right Policies?
What do these data suggest about the medical and economic policies that have been adopted by the federal, states and local governments?
The carnage of COVID-19 is concentrated in elder care facilities not in the population at large. The policies and procedures, including lockdowns and state-of-the-art personal protection practices for those facilities, should have been more thoroughly thought out based on useful data.
Keep in mind, about 70% of the elder care facilities are for-profit. Yet they are not free-market enterprises; enterprises free to do what they think is best. These for-profit facilities are licensed and regulated by the several Departments of Health of the states. They do what the state tells them to do.
The governors and mayors, and their medical and science advisers, made the decision to pack them in, force them to house and retain infected and returning infected patients. They chose to divert PPE supplies to hospitals, not the elder care facilities. This characterization is based on reports in the press. One certainly hopes there were some communities that did a better job. There is reason to believe that is the case because some assisted living facilities have reported no deaths.
As COVID-19 deaths mounted, not a word was officially spoken about where they were occurring. Fear was stoked that it was a population-wide epidemic. We should ALL lock down.
What a costly mistake, a mistake that continues to this day. Governors and mayors with fresh data insights into the truth still want to be central planners and determine which businesses can re-open and to what degree, who should still shelter or socially distance. They send out teams to draw circles in the grass defining where groups can camp out and place police monitors in all the parks to warn people to stay within the circles. At this point they are just imaginary prisons, but they are prisons.
Madness, sheer madness.
Though that is an easy and superficial observation to make, what is really unsaid, and not easy to admit, is that large numbers of politicians and bureaucrats have revealed their true nature. Speeches decorated with declarations of “better safe than sorry” and “planning is better than no planning” reveal they are authoritarians by nature; central planners of the worst kind.
In conclusion, the relevant death rate for policy purposes has been obscured. The consequence has been inappropriate policies. They have resulted in a bizarro world of highly restricted commercial functioning and immense economic destruction, alongside no evidence that lives were saved and growing evidence of second-tier loss of life resulting from lockdown.
Gregory van Kipnis