Gas Prices Rise, While Grocery Prices Ease
AIER’s Everyday Price Index rose 0.6 percent in May from April, led by a 6.6 percent jump in gasoline prices. The increase in gas prices was partially offset by a 0.5 percent drop in grocery prices from April to May. The EPI measures changes in prices that people see in their everyday purchases, such as groceries, restaurant meals, gasoline, and utilities.
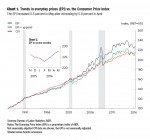
The EPI has dropped 1.3 percent over the past 12 months, reflecting falling energy prices from July 2015 to February 2016.
The EPI including apparel, a broader measure, posted a 0.6 percent increase in May and a 1.2 percent drop over the past 12 months. Both measures exclude prices of infrequently purchased, big-ticket items (such as cars, appliances, and furniture) and prices that are contractually fixed for prolonged periods (like housing).
The more widely known price gauge, the Consumer Price Index reported by the Bureau of Labor Statistics, increased 0.2 percent in May on a seasonally adjusted basis. The seasonally unadjusted CPI increased 0.4 percent for the month and 1.1 percent over the past 12 months. The EPI is not seasonally adjusted, so we compare it with the unadjusted CPI.
The EPI’s increase was driven by a 6.6 percent jump in gasoline prices. Gas prices have followed crude oil, rising higher in recent months. Crude oil prices were as low as the mid-$20s a barrel in early 2016, and domestic oil production slowed significantly. They have rebounded to around $50 a barrel, but that may not be enough incentive to spur significant new production. Should crude prices climb significantly higher, the possibility of renewed domestic production has the potential to dampen further gas price increases.
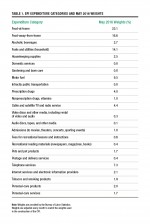
Grocery prices fell 0.5 percent in May, partially offsetting the price jump for gas. Groceries are the largest category within the EPI, accounting for 23.1 percent of everyday purchases, while gasoline accounts for only 9.5 percent. So a small decline in grocery prices can offset higher gasoline prices. Grocery prices declined across all major categories, including meat, dairy, and fresh fruits and vegetables. On the other hand, restaurant prices increased 0.2 percent in May.
Grocery prices have tended to grow more slowly than restaurant prices in recent years, rising at an annual rate of 1.8 percent over the past five years, while restaurant prices have increased at a rate of 2.6 percent. Grocery prices and restaurant prices grew at roughly the same rate until the end of the recession in 2009.
With gasoline prices resuming their upward trend, the relationship between the EPI and CPI is returning to its historical norm – the EPI is rising faster than the CPI. Over the past 20 years the EPI has grown about 2.5 percent a year, while the CPI has risen 2.2 percent. If gas prices continue to rise, gasoline will consume an increasing share of everyday purchases. When crude oil prices peaked in 2008, gasoline accounted for nearly 19 percent of everyday purchases.


