Economy


Healthy private-sector balance sheets contrast with growing government debt.
To understand the risks associated with debt growth since the Great Recession, debt levels must also be considered. There are numerous ways to measure them. For businesses and households, we measure debt relative to assets. For government, we measure debt relative to the gross domestic product, or GDP, the most common gauge of the economy’s output.
Within the private sector, both households and the corporate segments (we are excluding financial firms from this discussion) have debt-to-asset ratios below their long-term averages. Households have a ratio of 14.2 percent, compared with a long-term average of 15.4 percent. For corporations, the current debt-to-asset ratio is 43.6 percent, lower than the long-term average of 45.9 percent. The non-corporate segment – including small businesses, professional partnerships, and other legal structures – has a ratio of 38.6 percent, slightly above its long-term average of 35.7 percent. Overall, the three non-government segments of the economy have debt ratios that are reasonable by historical standards. These generally healthy balance sheets for the private sector should be considered positive for the economy.
Debt levels for the public sector are far less reassuring. The state and local government debt-to-GDP ratio is 32 percent, more than nine percentage points above the long-term average of 22.4 percent. Even more concerning is the debt-to-GDP ratio for the federal government, at 97.5 percent at the end of the second quarter of 2016, compared with a long-term average of 67.2 percent.
Adding further concern is the projected path of federal debt and deficits. The latest Congressional Budget Office projections show annual budget deficits widening over the next several years, exceeding 4 percent by 2022, compared with an estimated 3.2 percent for 2016.
As the presidential election approaches, greater attention needs to be paid to U.S. fiscal policy. Tax policy, spending policy, and the U.S. fiscal position are critical to the long-term health of the U.S. economy. Ever-increasing government debt will eventually become too big to service, and investors will eventually stop lending to a heavily-indebted borrower, causing a global financial crisis.
Economic Outlook
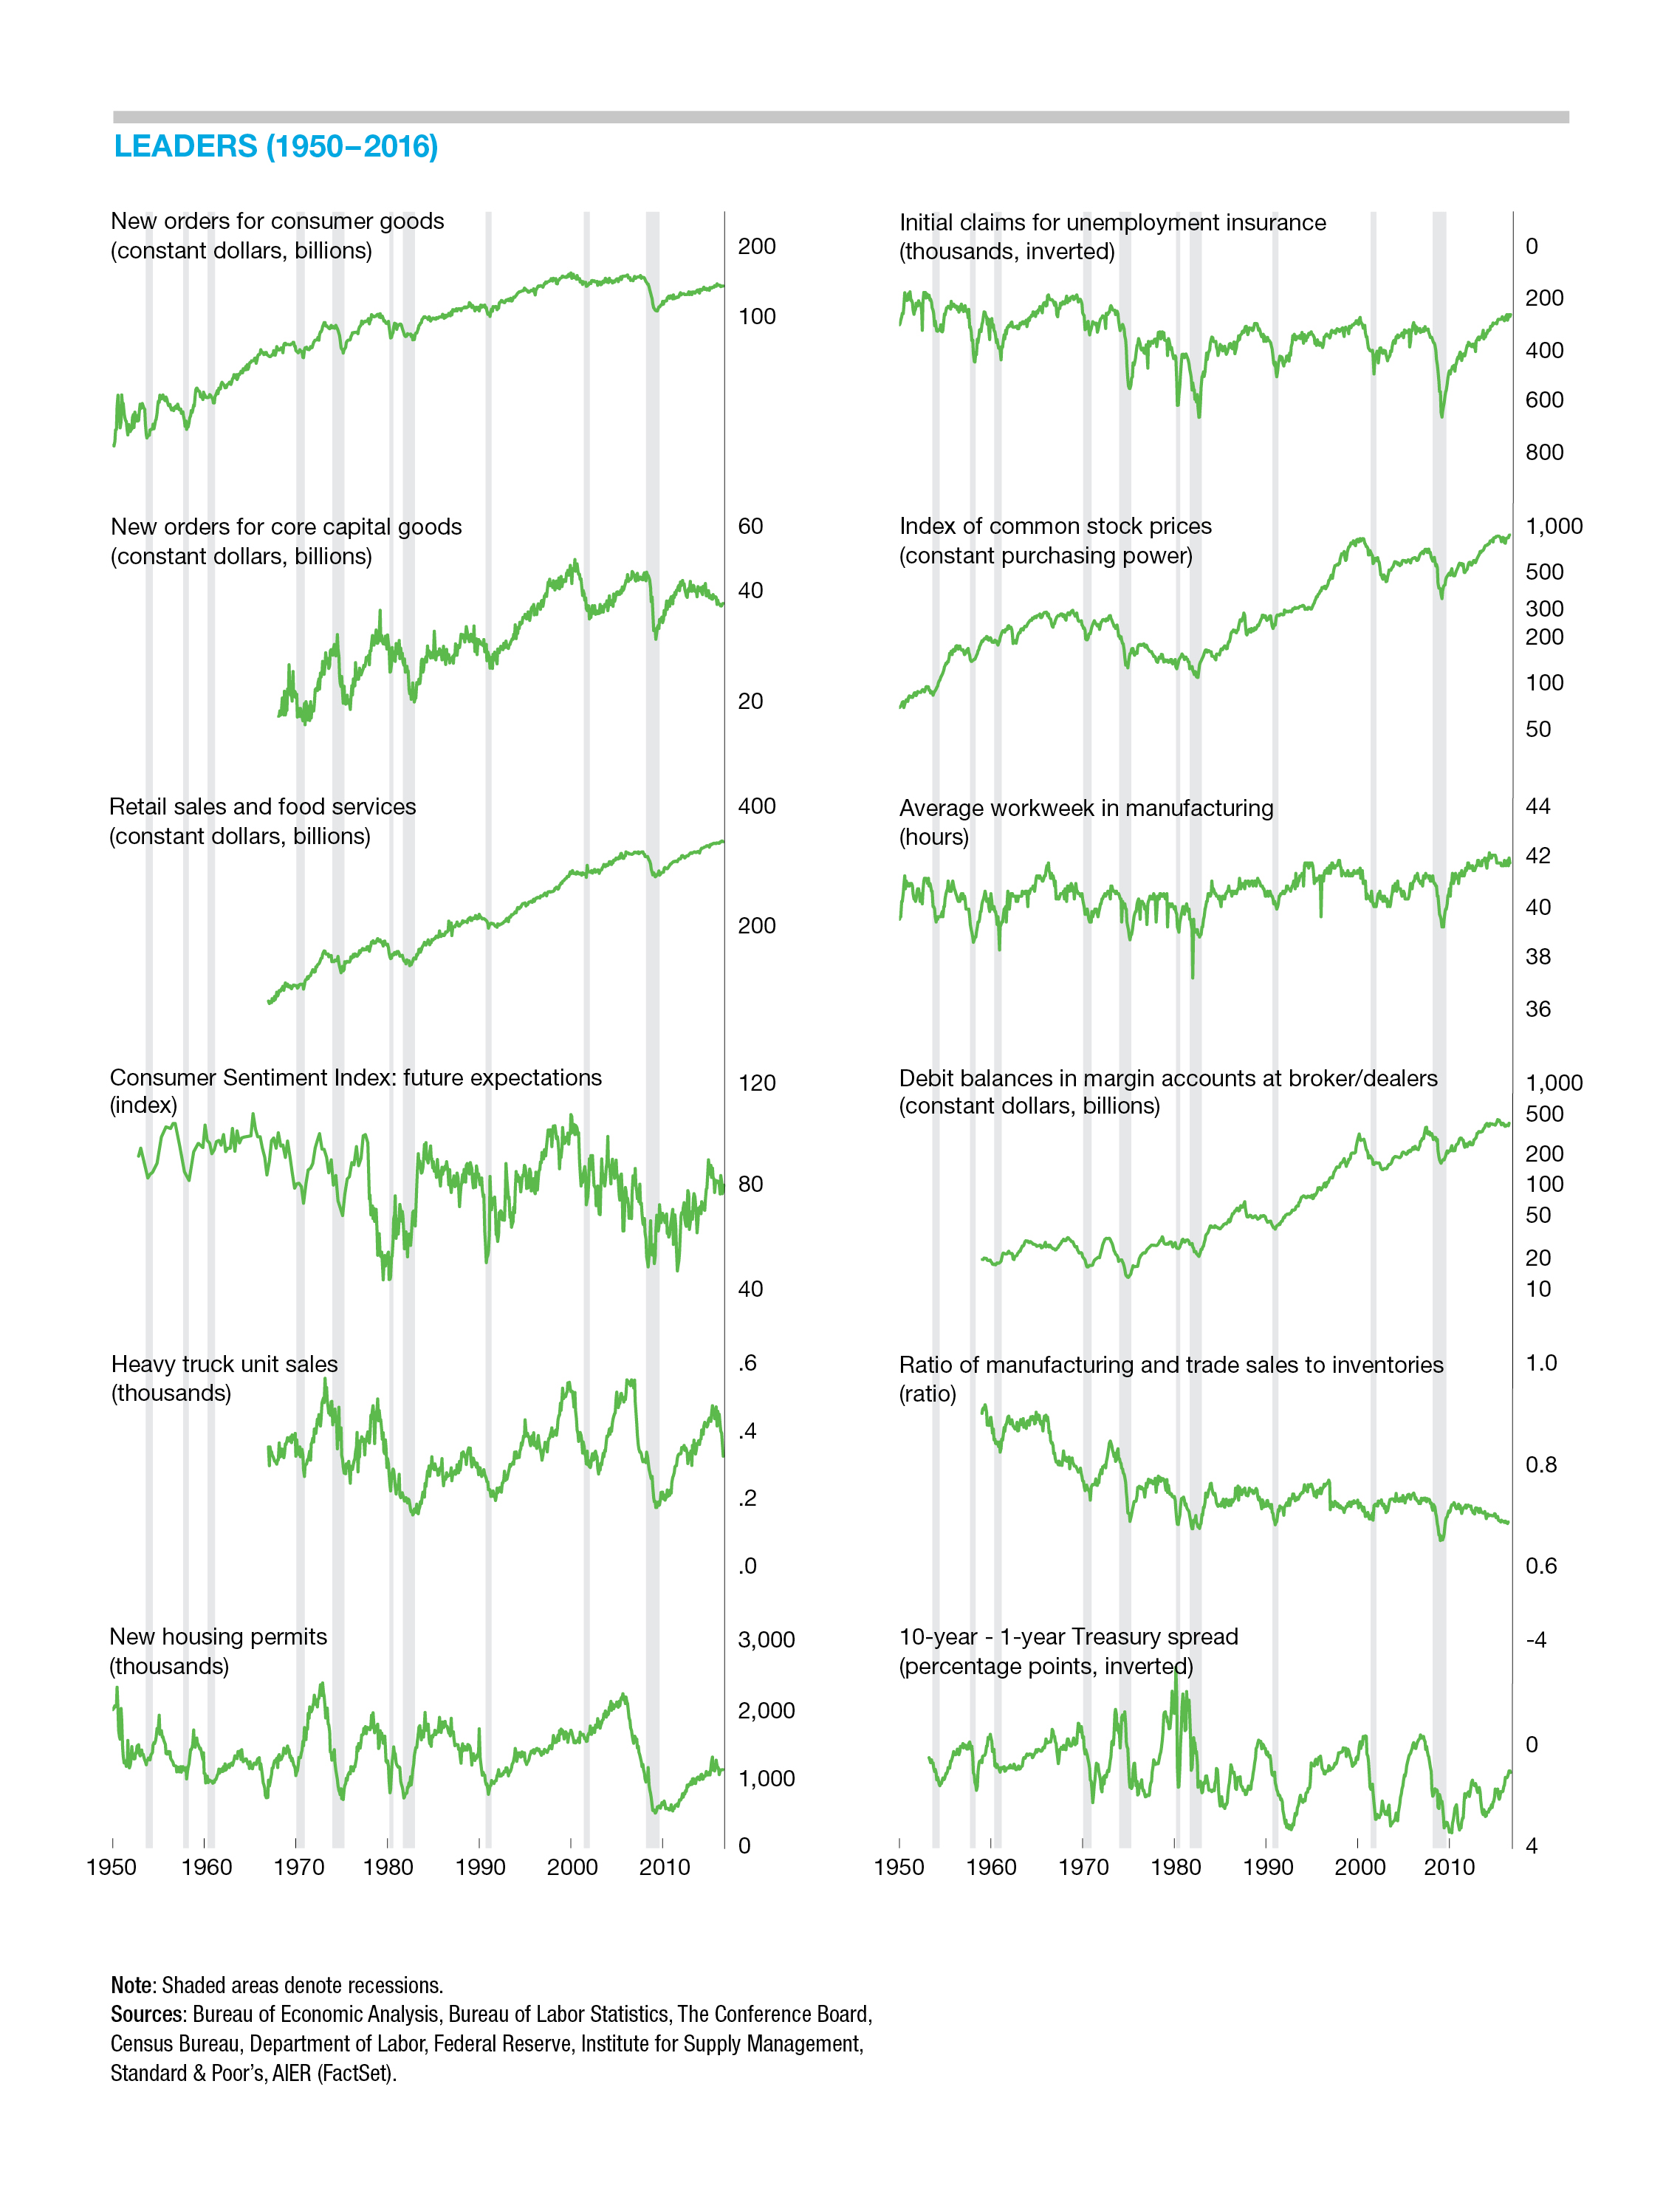
Our Business-Cycle Conditions Leaders index improved significantly in the latest month. The Leaders jumped to 54 in September from 42 in August (Chart 3). September marks their first month above the neutral 50 level since January and follows seven consecutive months in the 38-to-50 range. As we cautioned when our index first fell below 50, one month doesn’t make a trend. A single reading of 54 is not enough evidence to suggest the economy is significantly improving. However, we still believe the results over the past eight months are consistent with an overall slow-growth environment and continued economic expansion.
The improvement for September was a result of three indicators turning up, from negative to neutral. They were manufacturing and trade sales-to-inventories ratios; housing permits; and debit balances in margin accounts, amounts borrowed by investors to buy securities. These improvements in different areas of the economy are positive signs.
Among the remaining indicators, we continue to see a pattern consistent with our qualitative assessment of the economy. The labor market remains healthy (initial claims and the average workweek in manufacturing remained favorable) and supports the upward trend in real retail spending. However, consumer expectations and real new orders for consumer goods remain weak. Real stock prices and the yield curve have been favorable, while capital investment-related indicators are soft.
Among our other indexes, the Coinciders moved up to 92 in September from 83 in August while the Laggers index also rose to 92 from 75 in August.

Click for interactive Indicators at a Glance (on mobile device turn to landscape)
Next/Previous Section:
1. Overview
2. Economy
3. Policy
4. Investing