Business Conditions Monthly July 2023

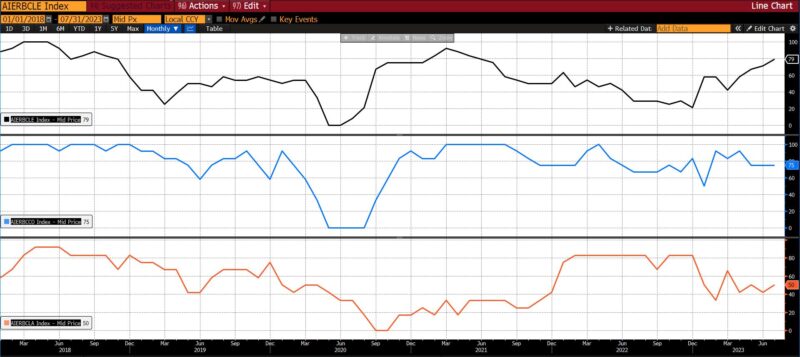
In July 2023, AIER’s Business Conditions Monthly took varied turns. While the Leading Indicator edged up from 71 to 79, the Roughly Coincident Indicator remained at its June 2023 level of 75. The Lagging Indicator turned from slightly contracting to neutral, rising from 42 to 50.
AIER Business Conditions Monthly (5 years)
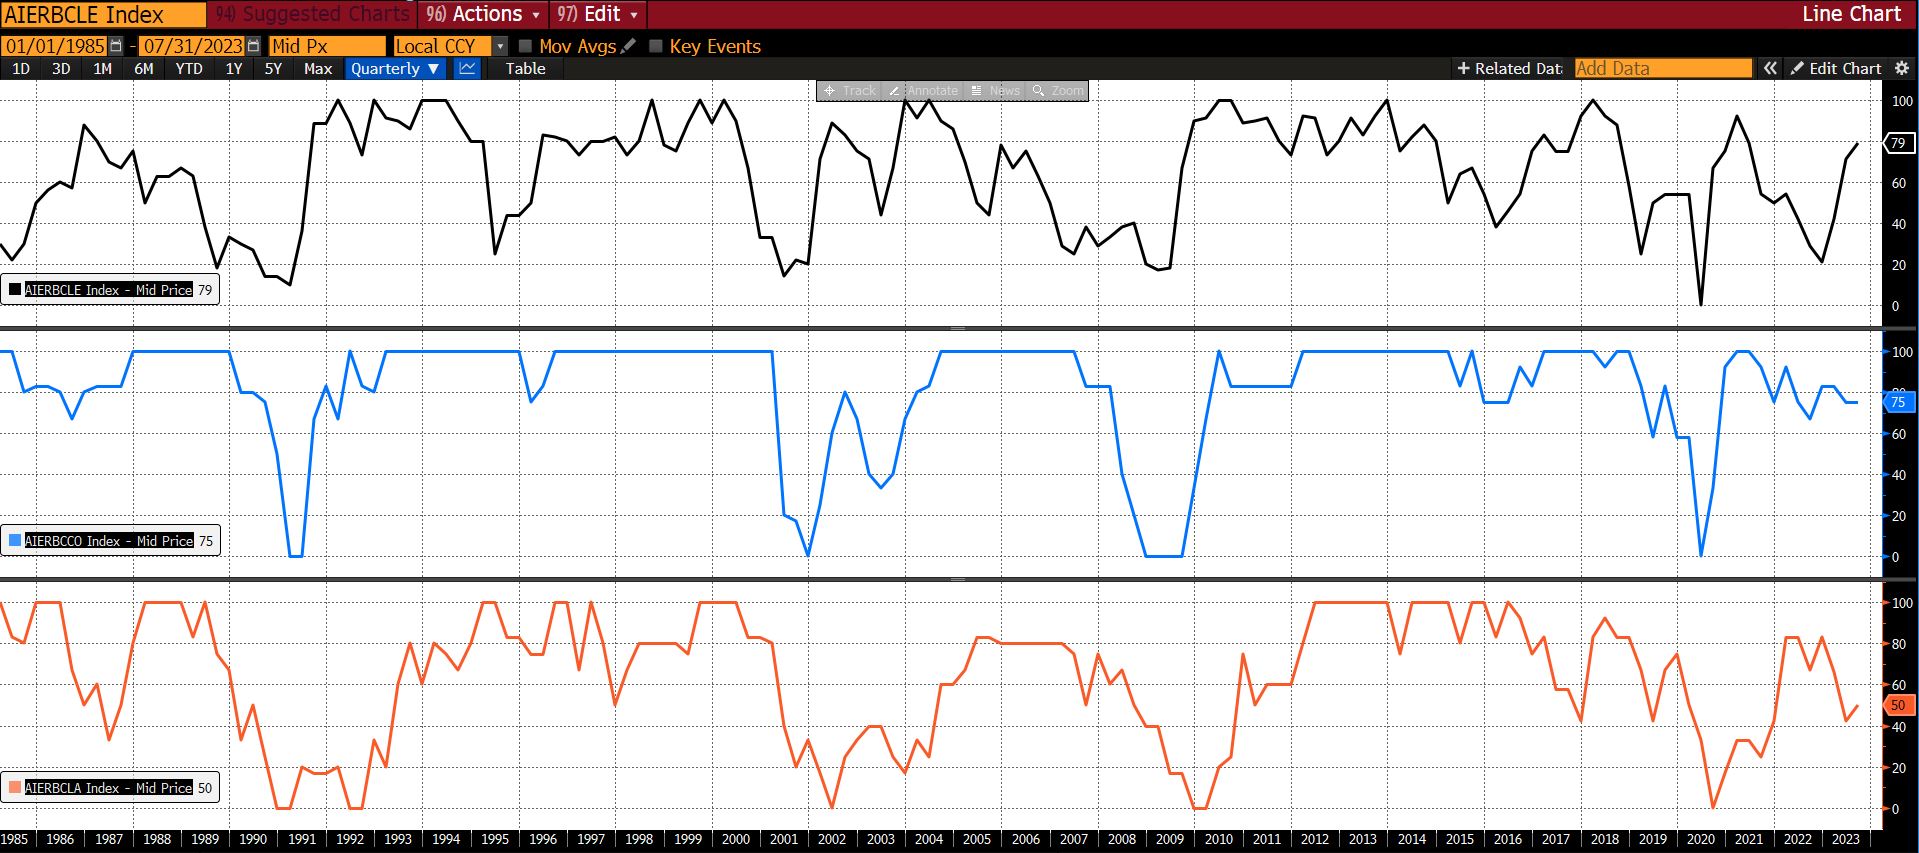
AIER Business Conditions Monthly (1985 – present)
Leading Indicators (79)
With the rise from 71 in June 2023 to 79 in July, the Leading Indicator Is at its highest level since June of 2021 (79).
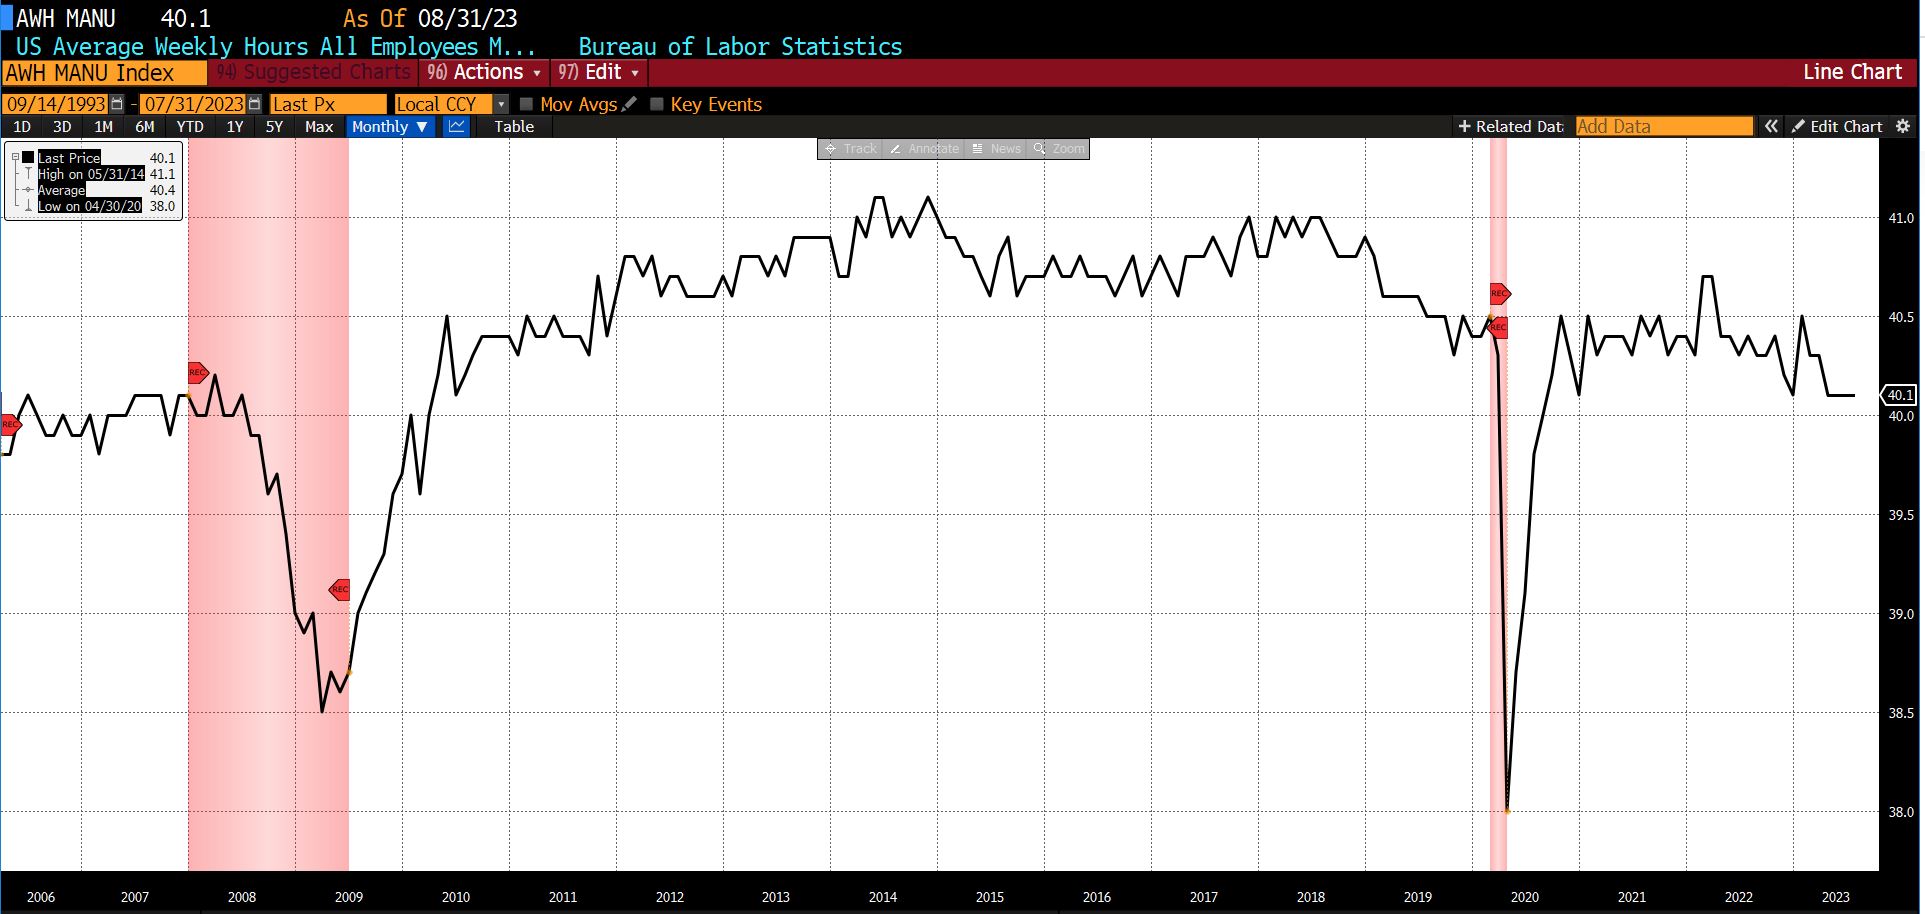
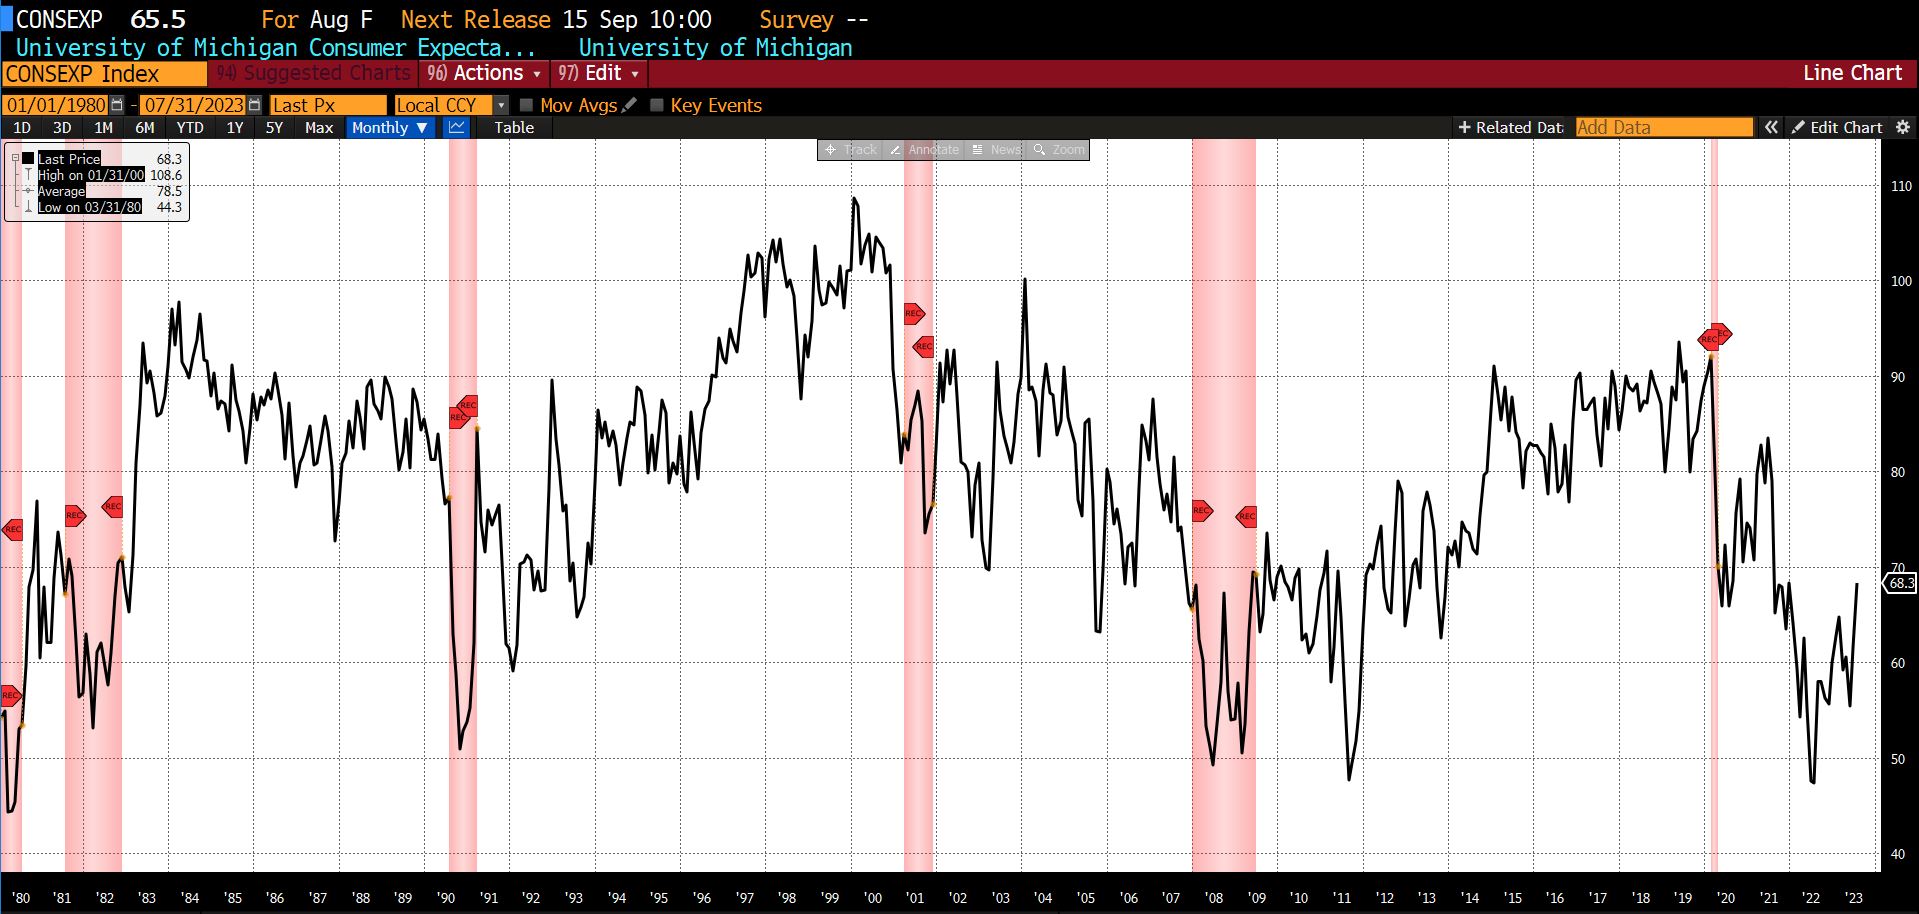
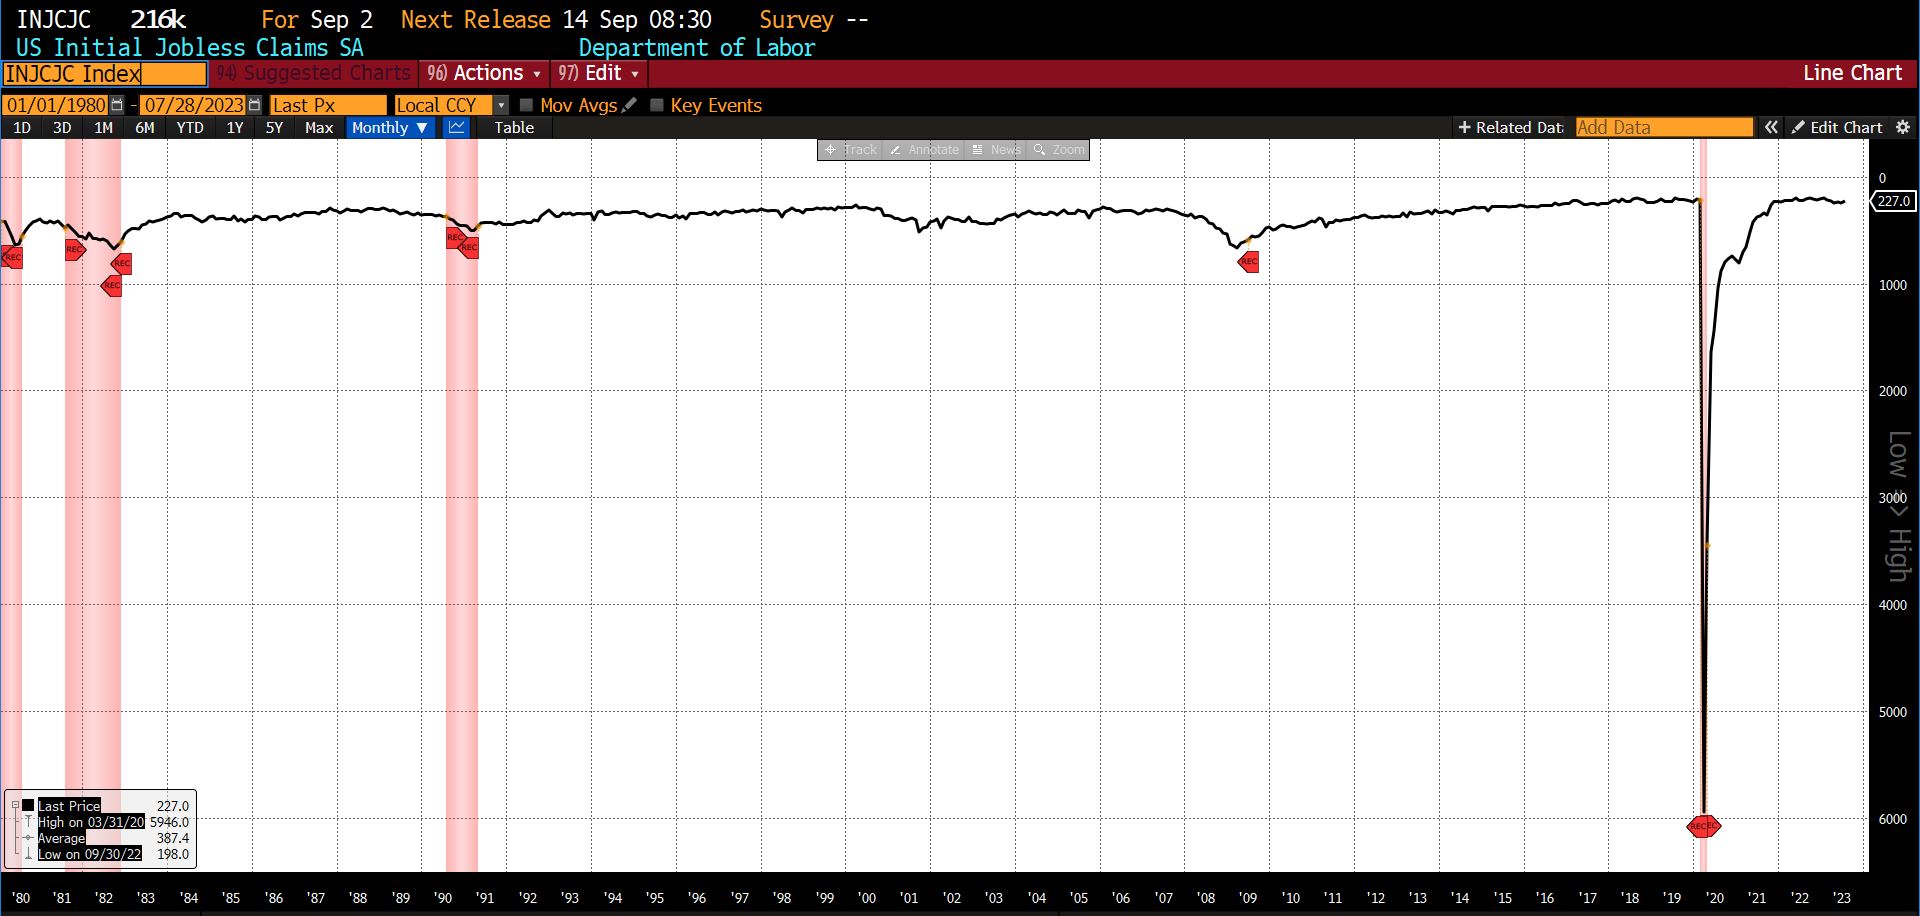
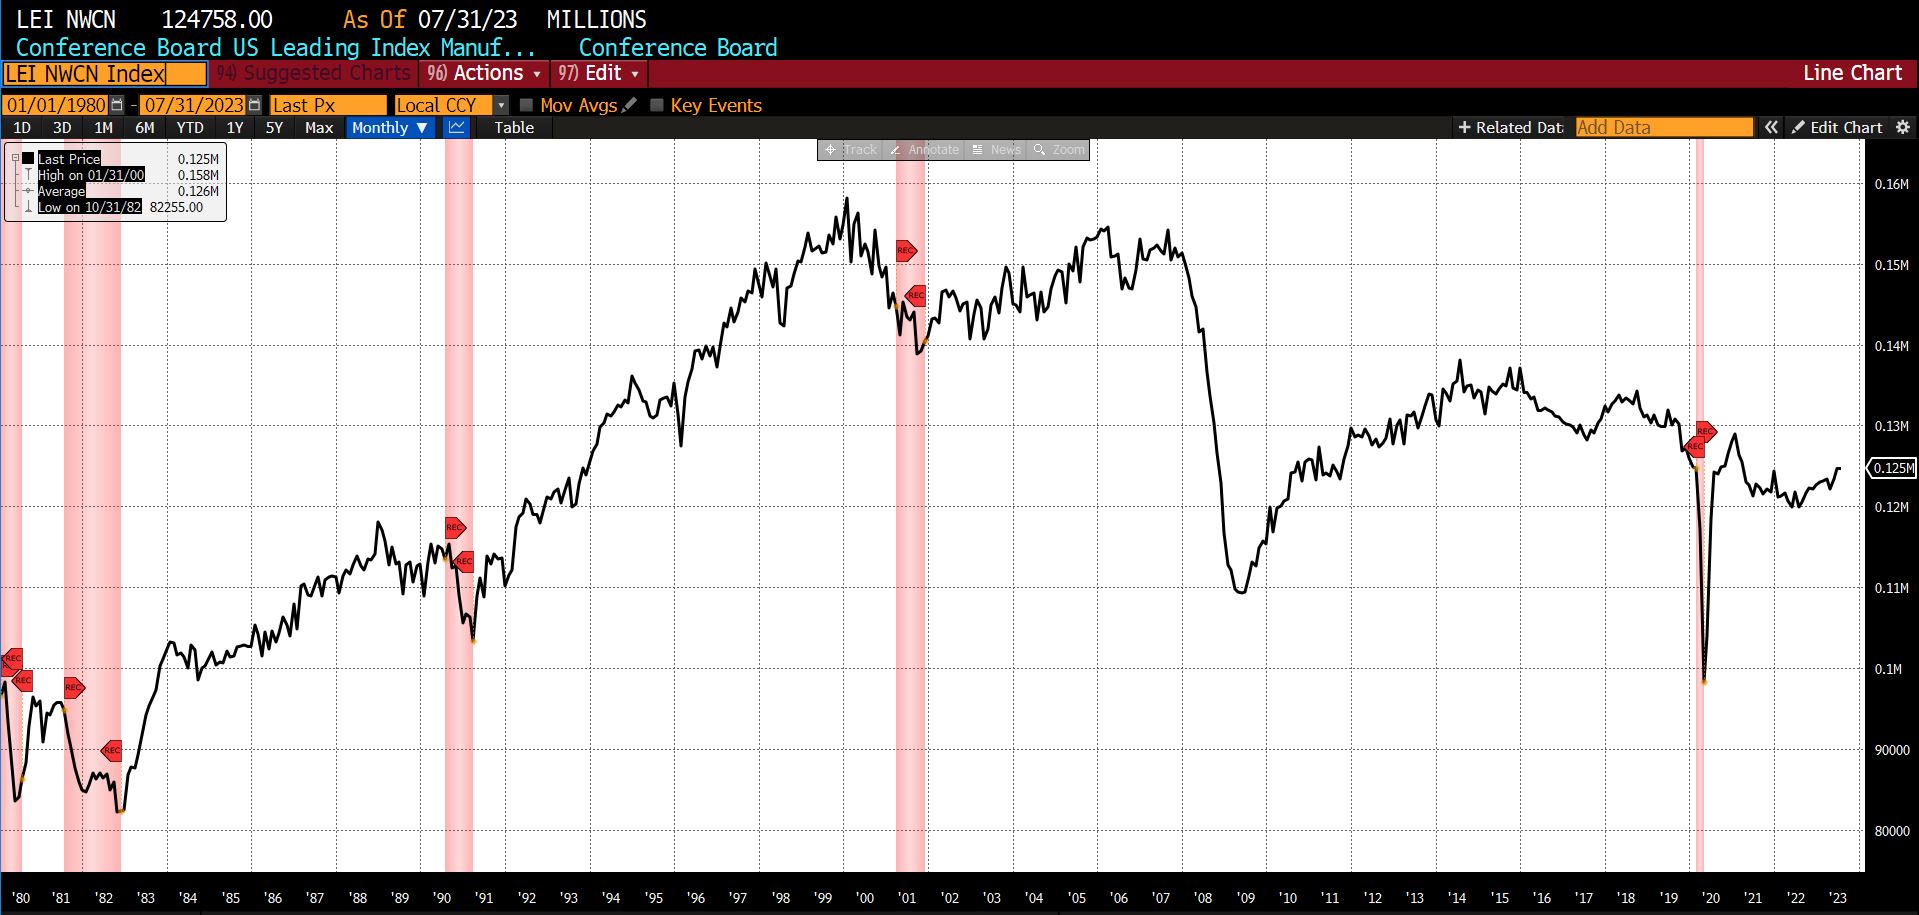
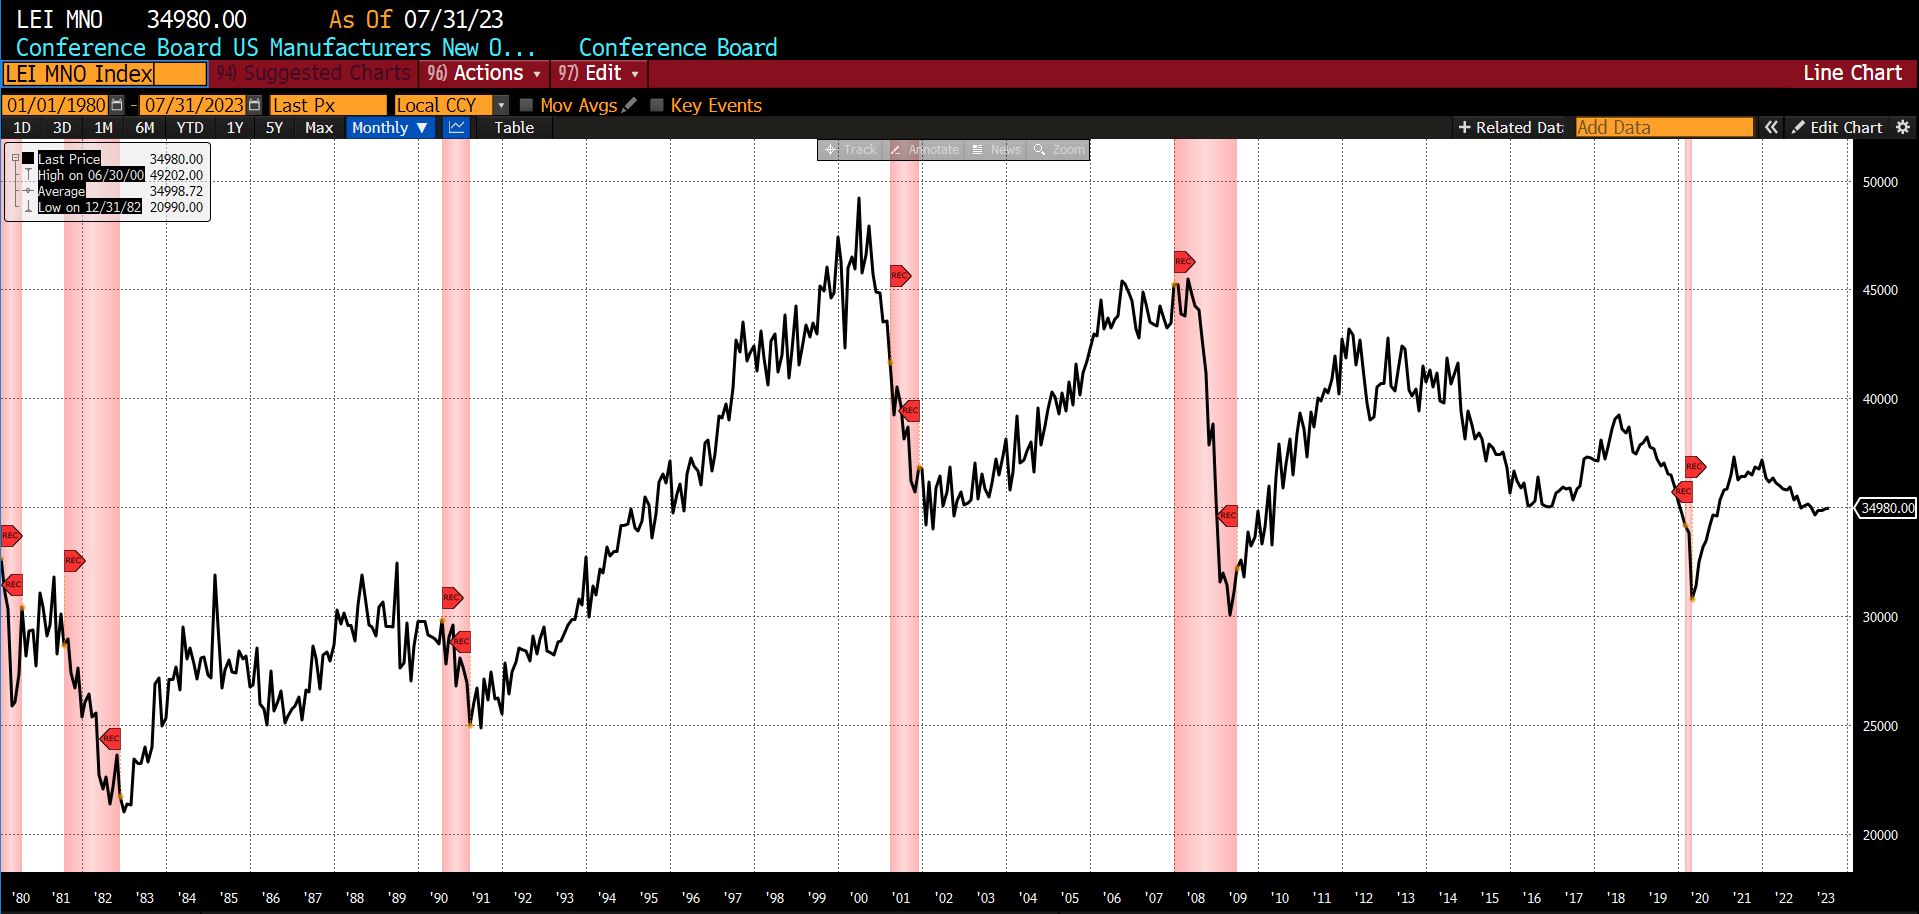
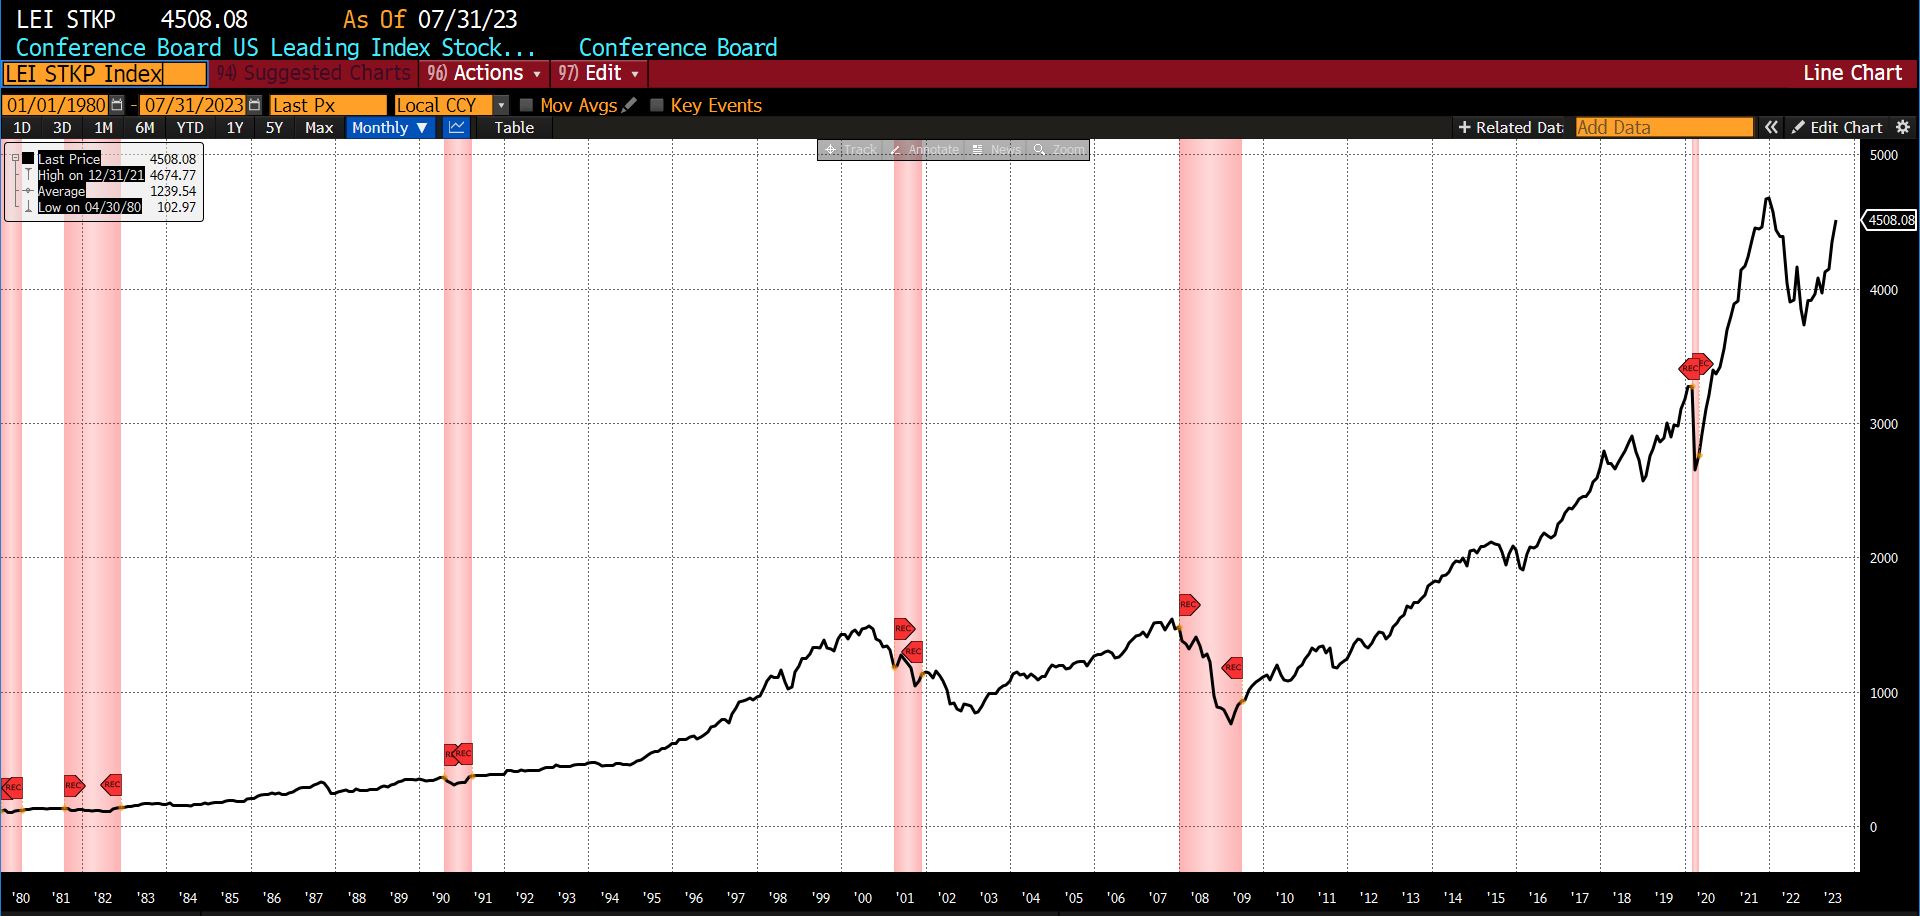
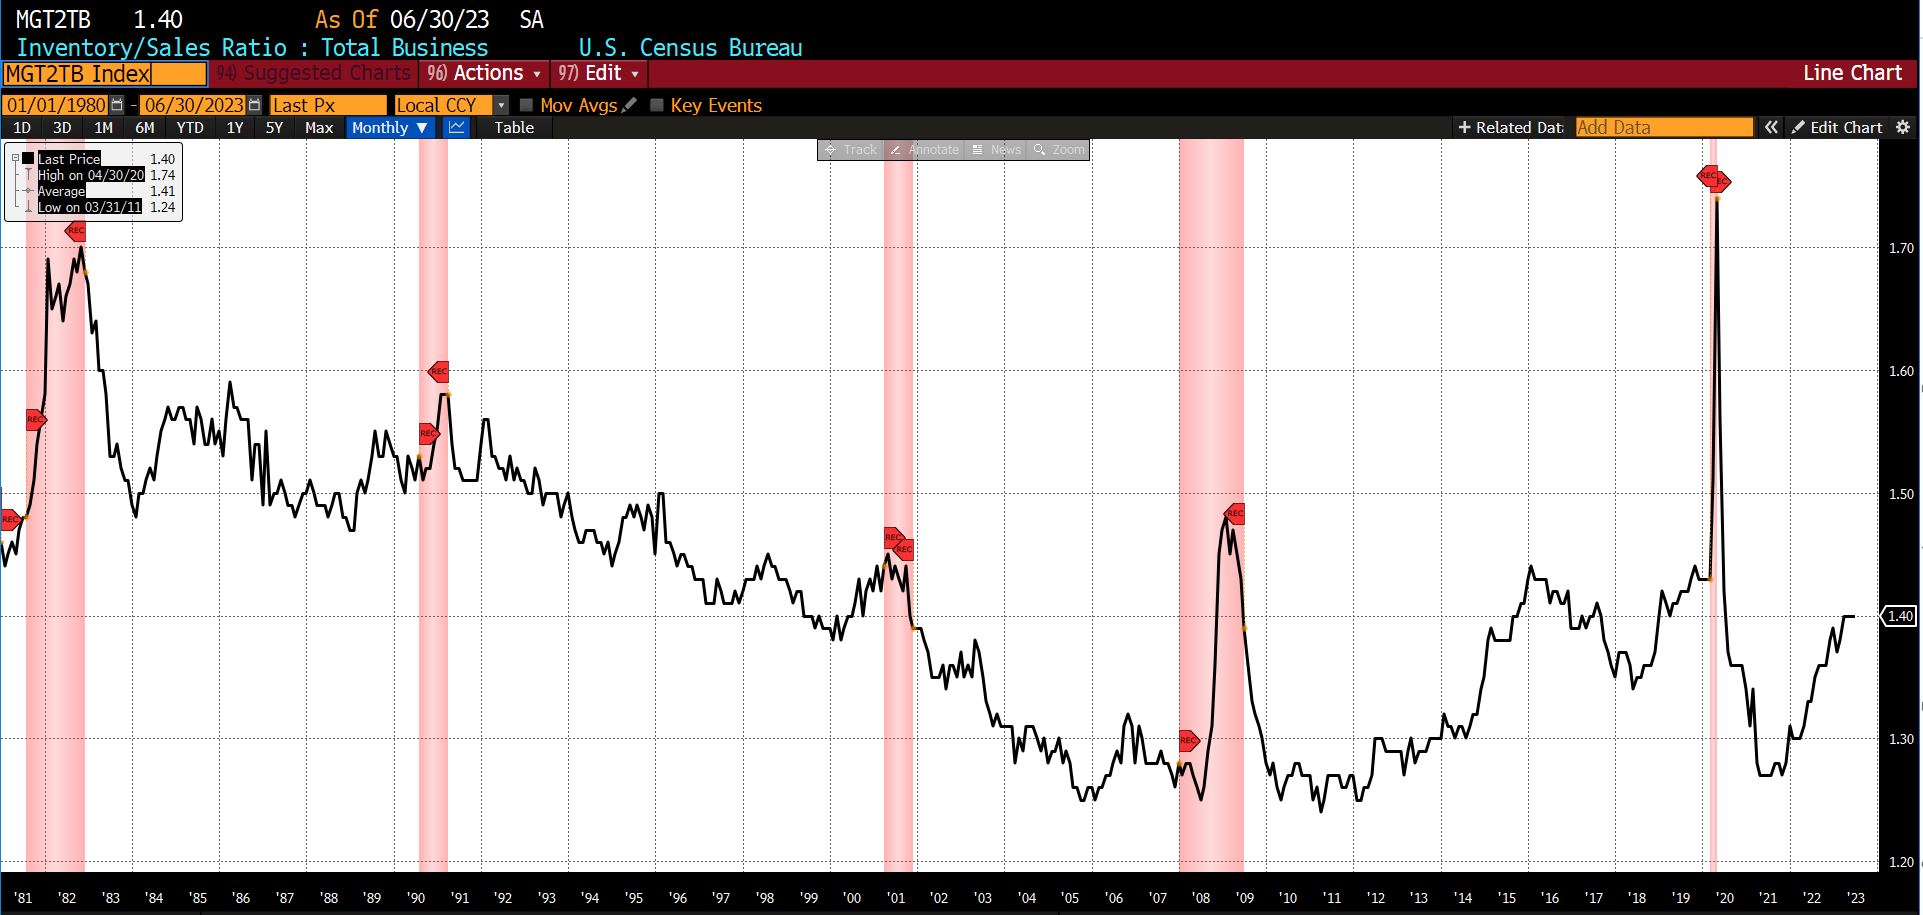
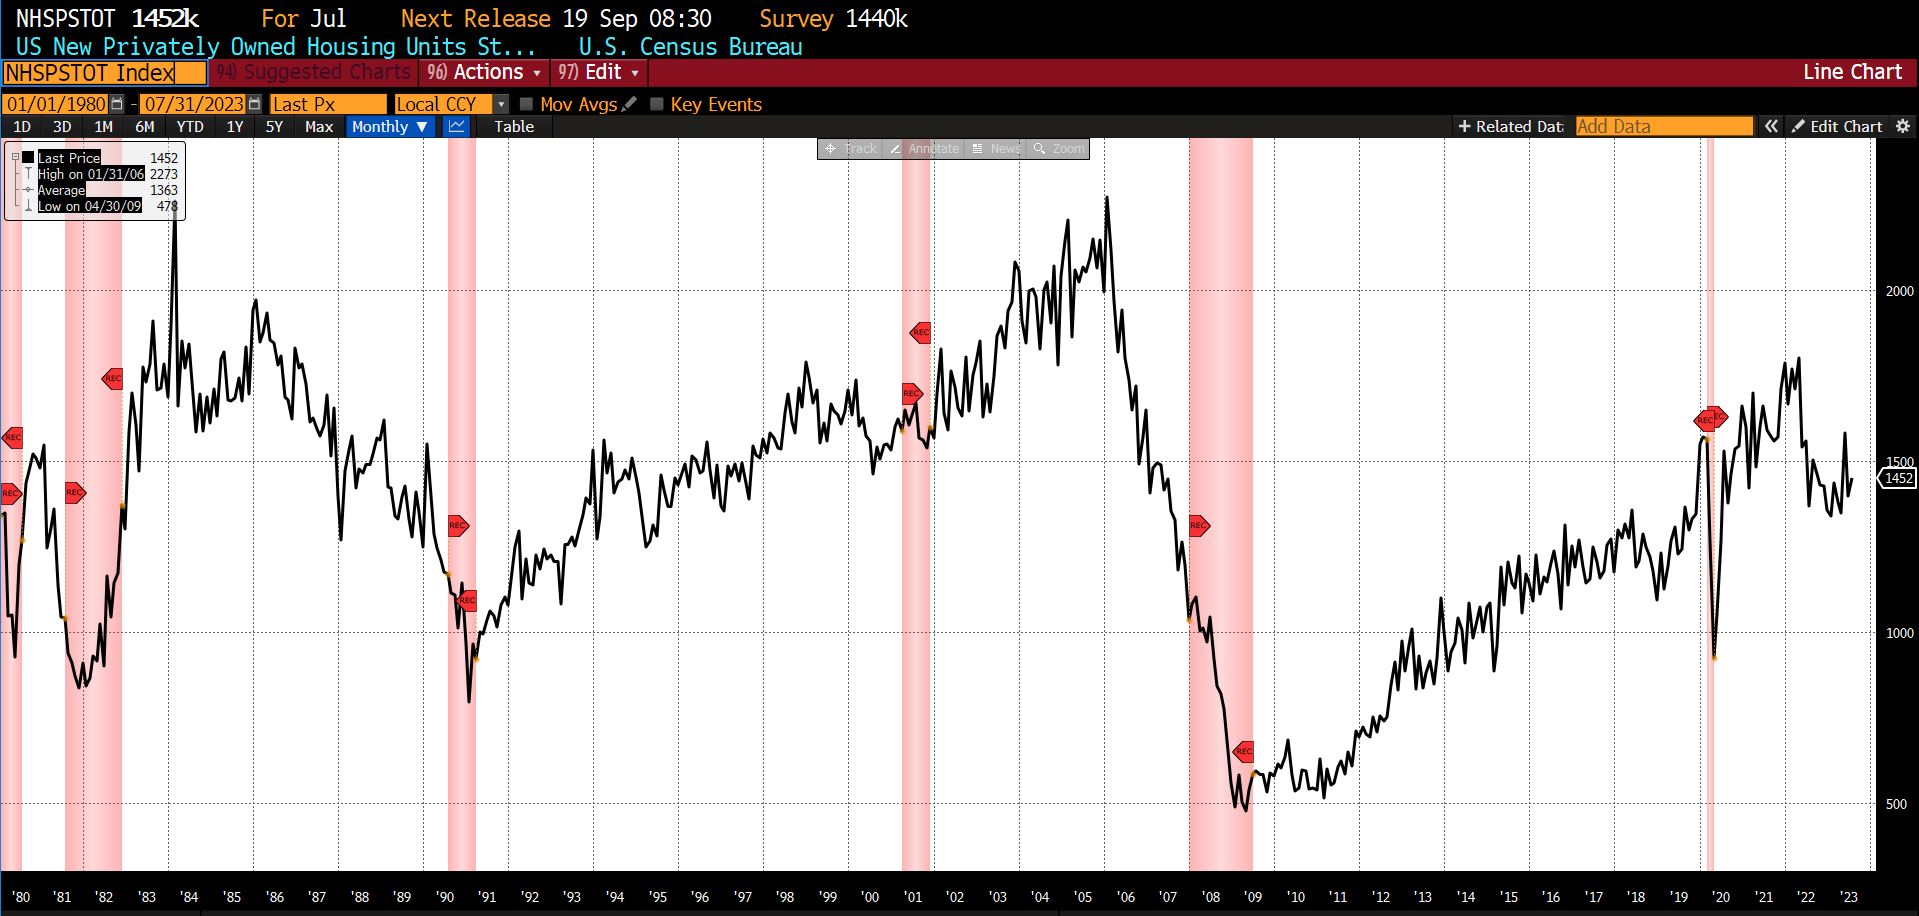
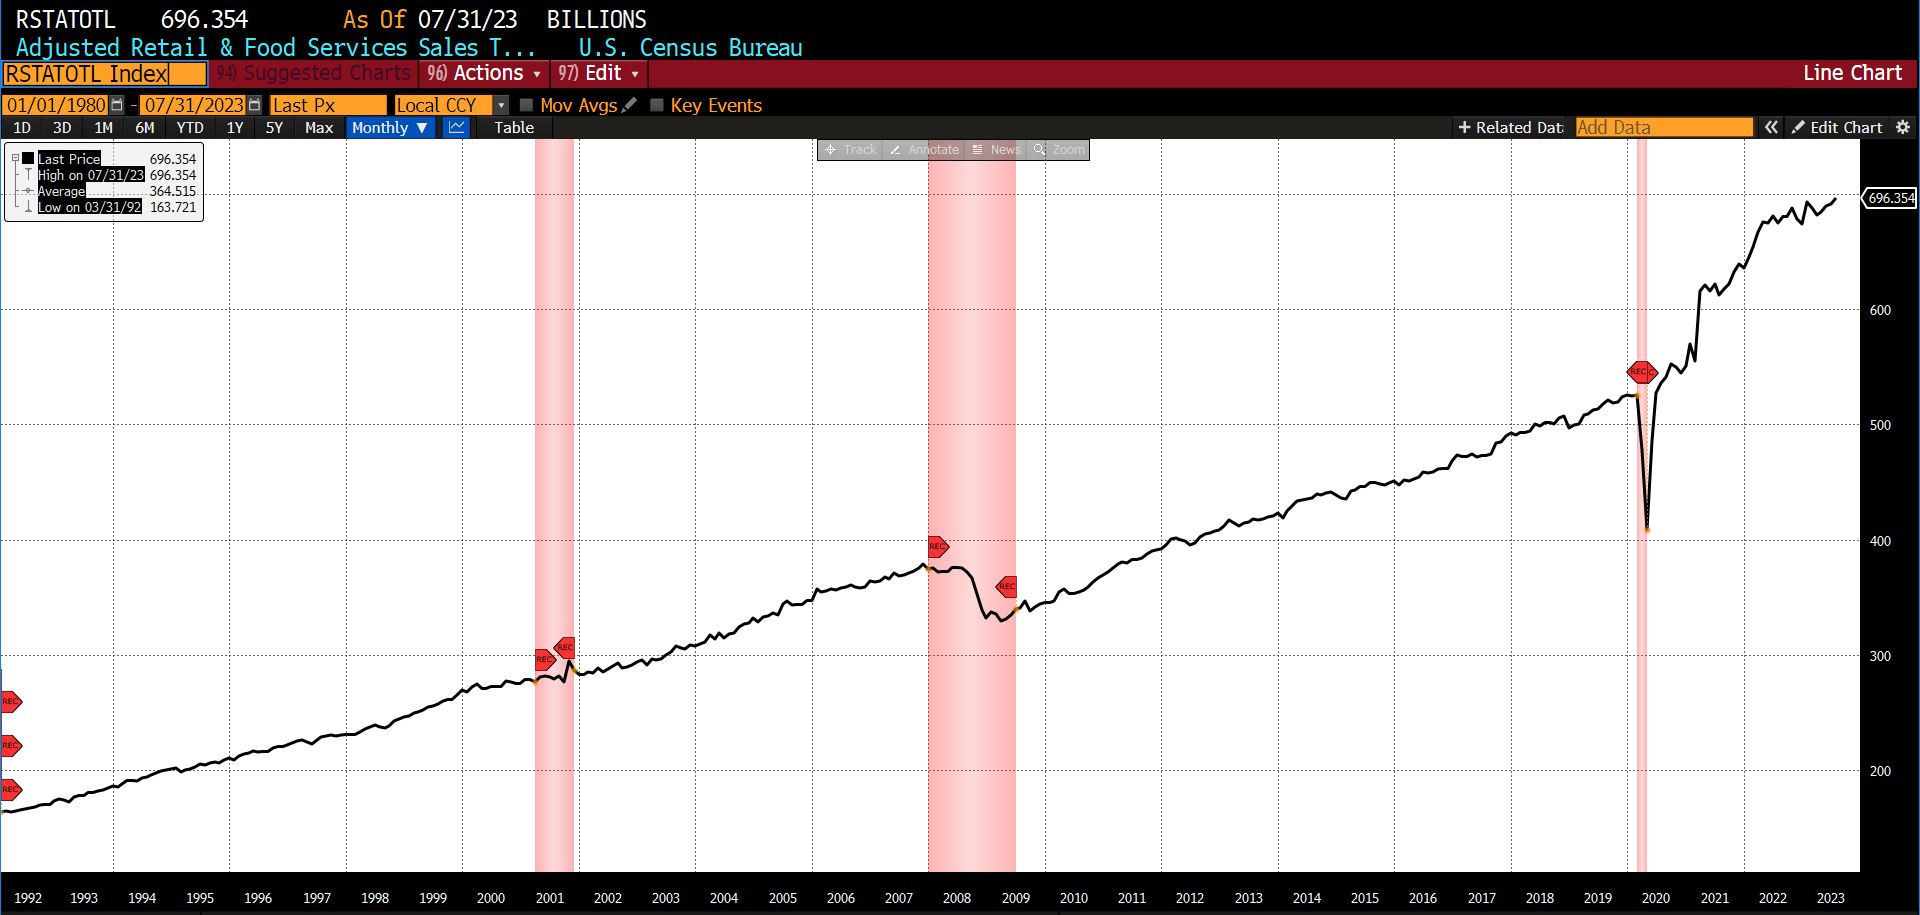
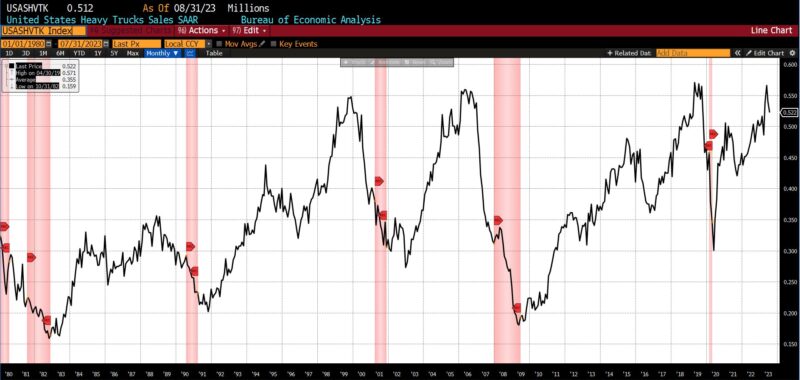
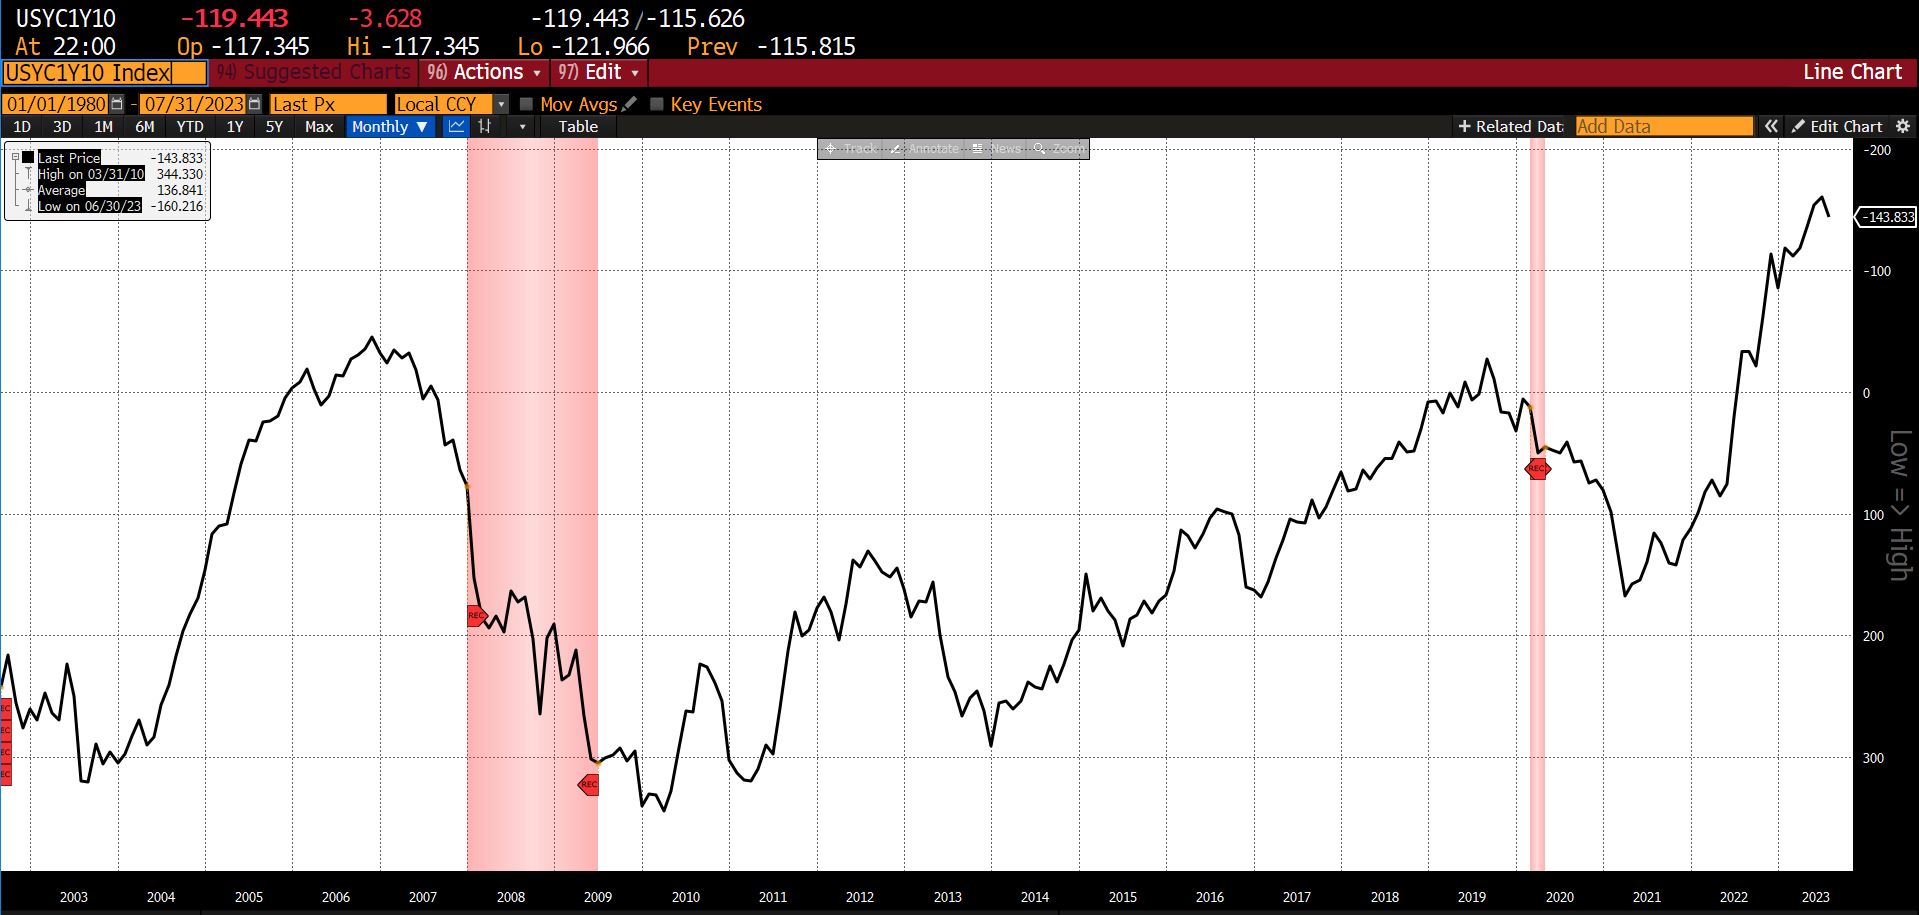
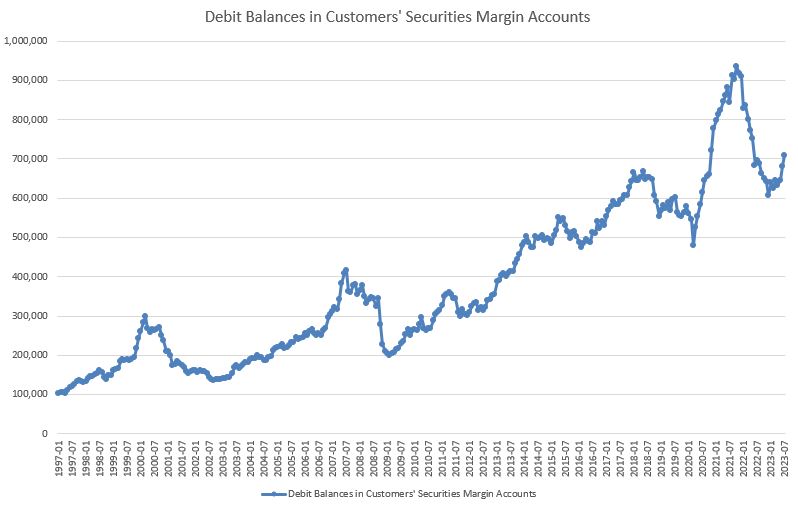
Eight of the twelve leading indicators rose, three met the criteria of unchanged or neutral, and one declined in July 2023. Rising were the University of Michigan Consumer Expectation Index (11.1 percent), United States Heavy Truck Sales (8.2 percent), Debit Balances in Customers’ Securities Margin Accounts (4.2 percent), US Initial Jobless Claims (2.4 percent), the Conference Board US Leading Index of Manufacturers New Orders, Consumer Goods, and Materials and Leading Index of 500 Stock Prices (1.3 percent and 3.7 percent, respectively), US New Privately Owned Housing Unit Starts (1.3 percent), and Adjusted Retail and Food Service Sales (1 percent). US Average Weekly Hours (All Employees, Manufacturing), the Conference Board US Manufacturers New Orders of Capital Goods Excluding Aircraft, and the US Census Bureau’s Inventory to Sales Ratio (Total Business) were neutral/unchanged. The 1-to-10 year US Treasury spread narrowed by 10.2 percent.
Roughly Coincident (75) and Lagging Indicators (50)
The Roughly Coincident Indicator retained its reading of 75 from the previous month. With the exception of a sudden dip to 50 in January 2023, for the nearly three years since October 2020, the Roughly Coincident Indicator has shown various degrees of expansion with an average reading of 83.
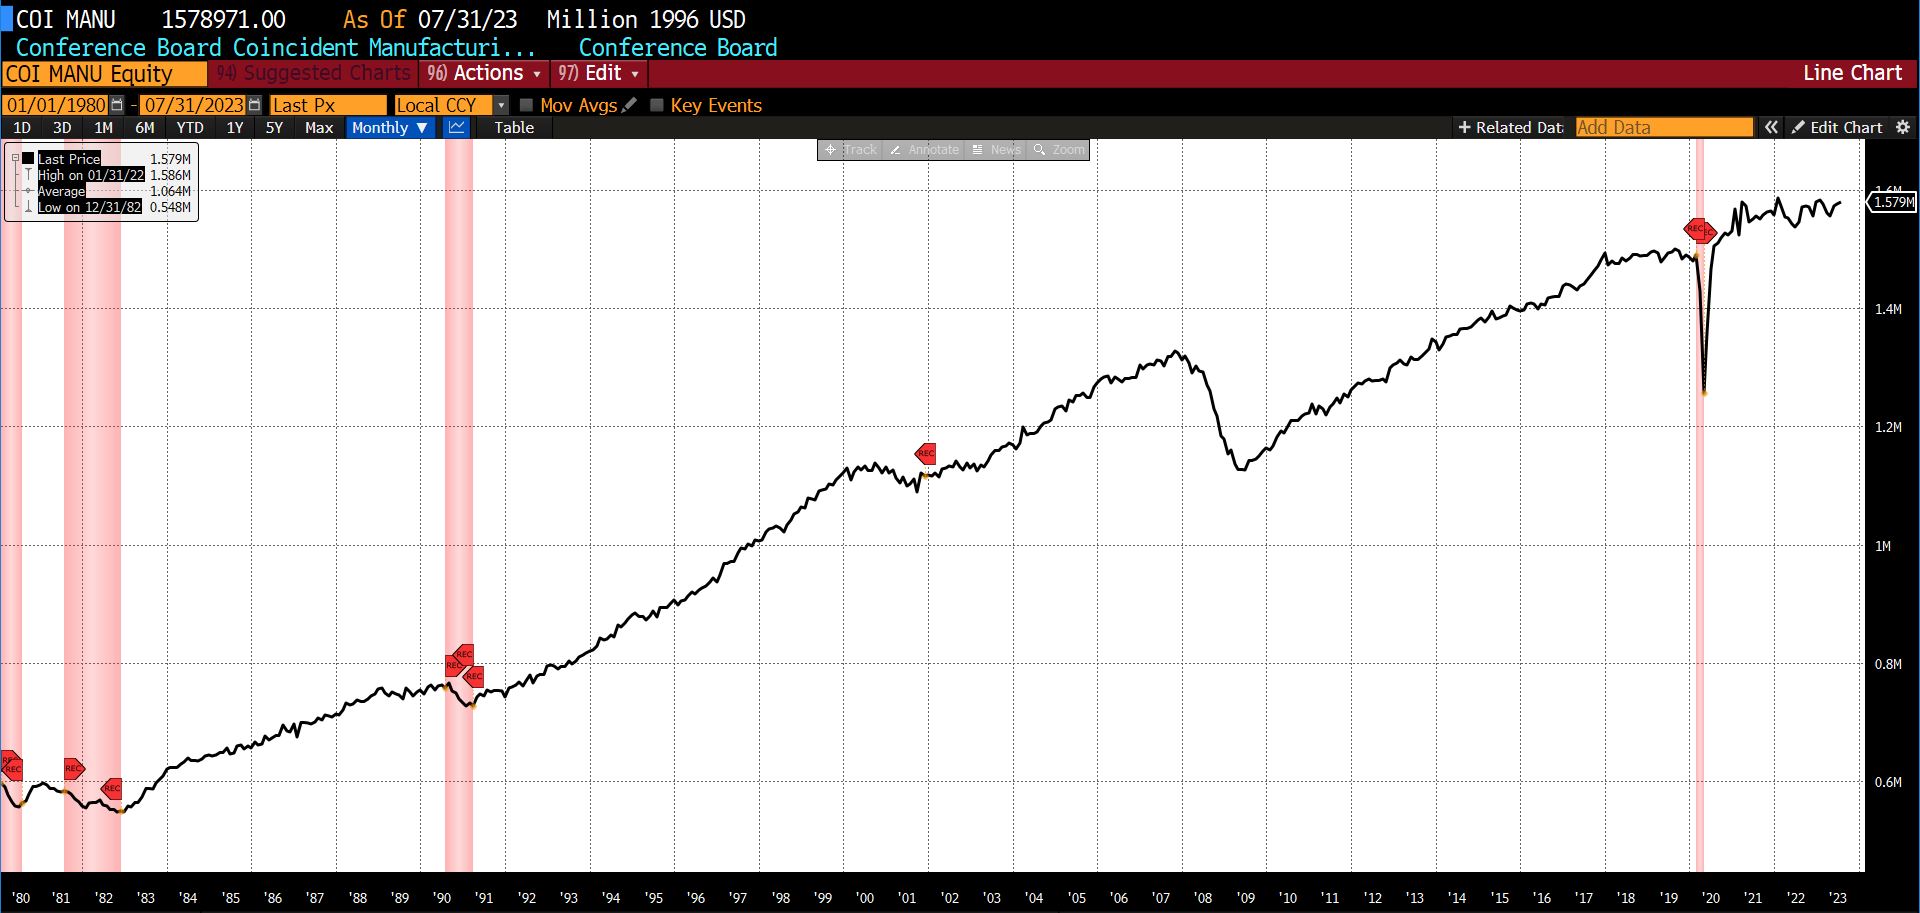
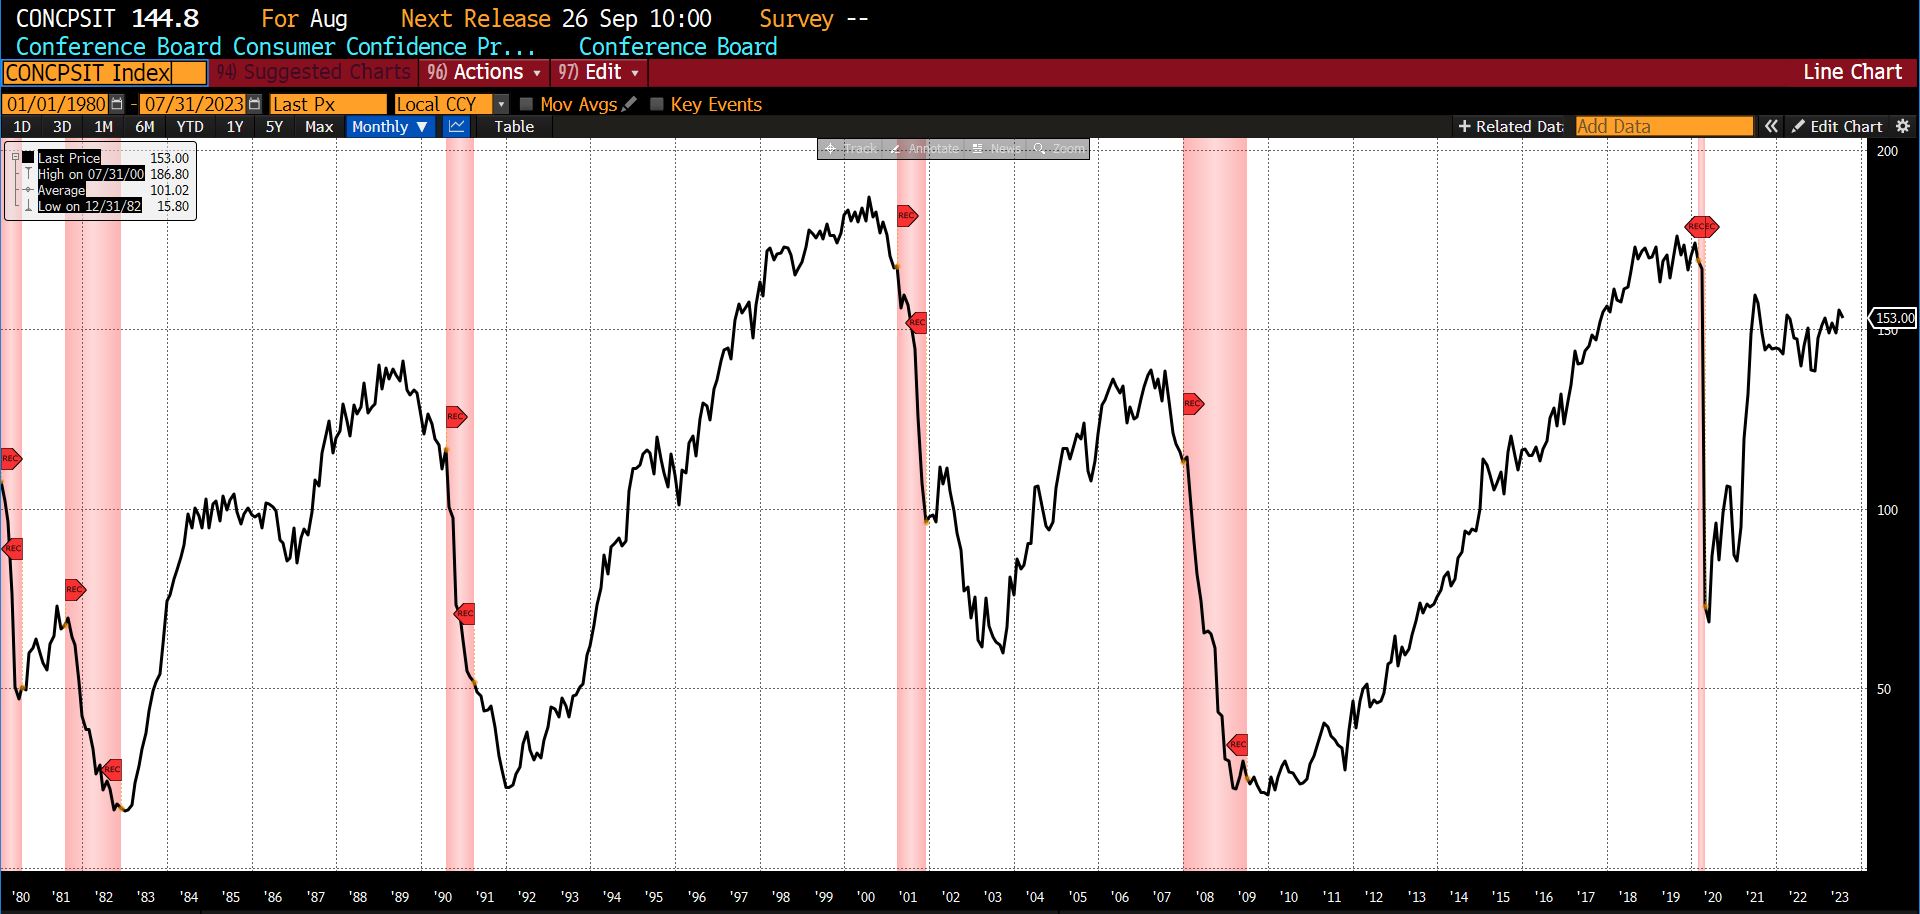
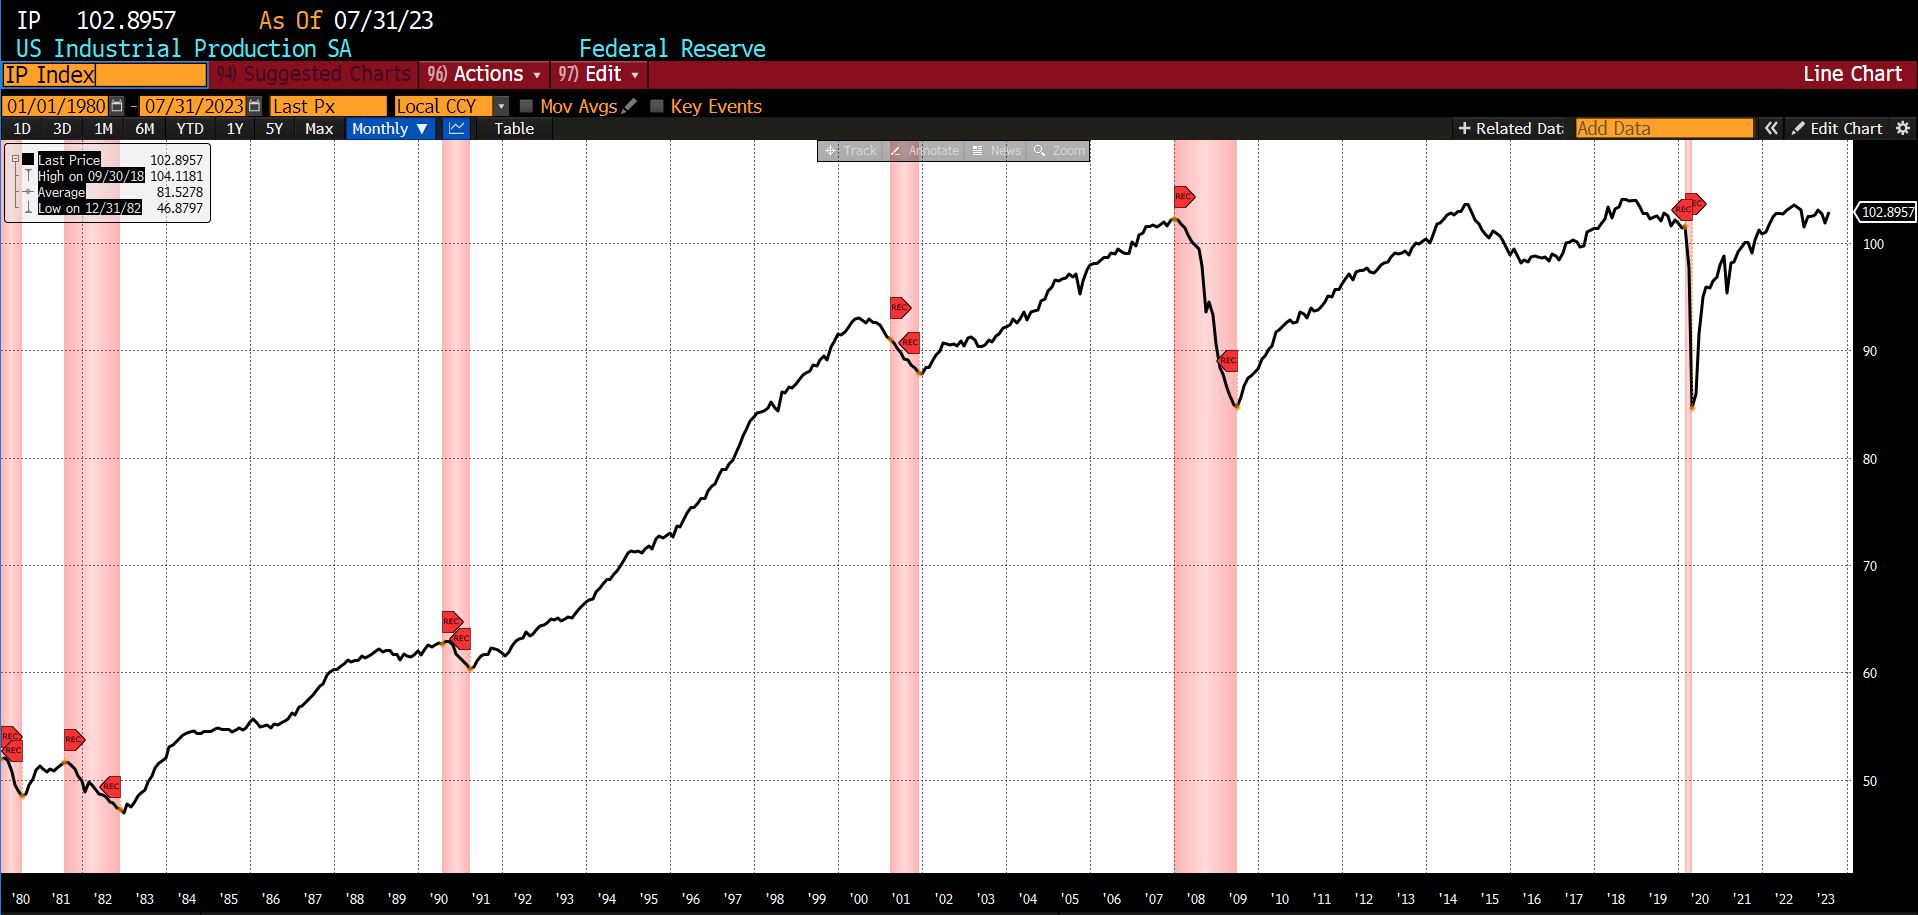
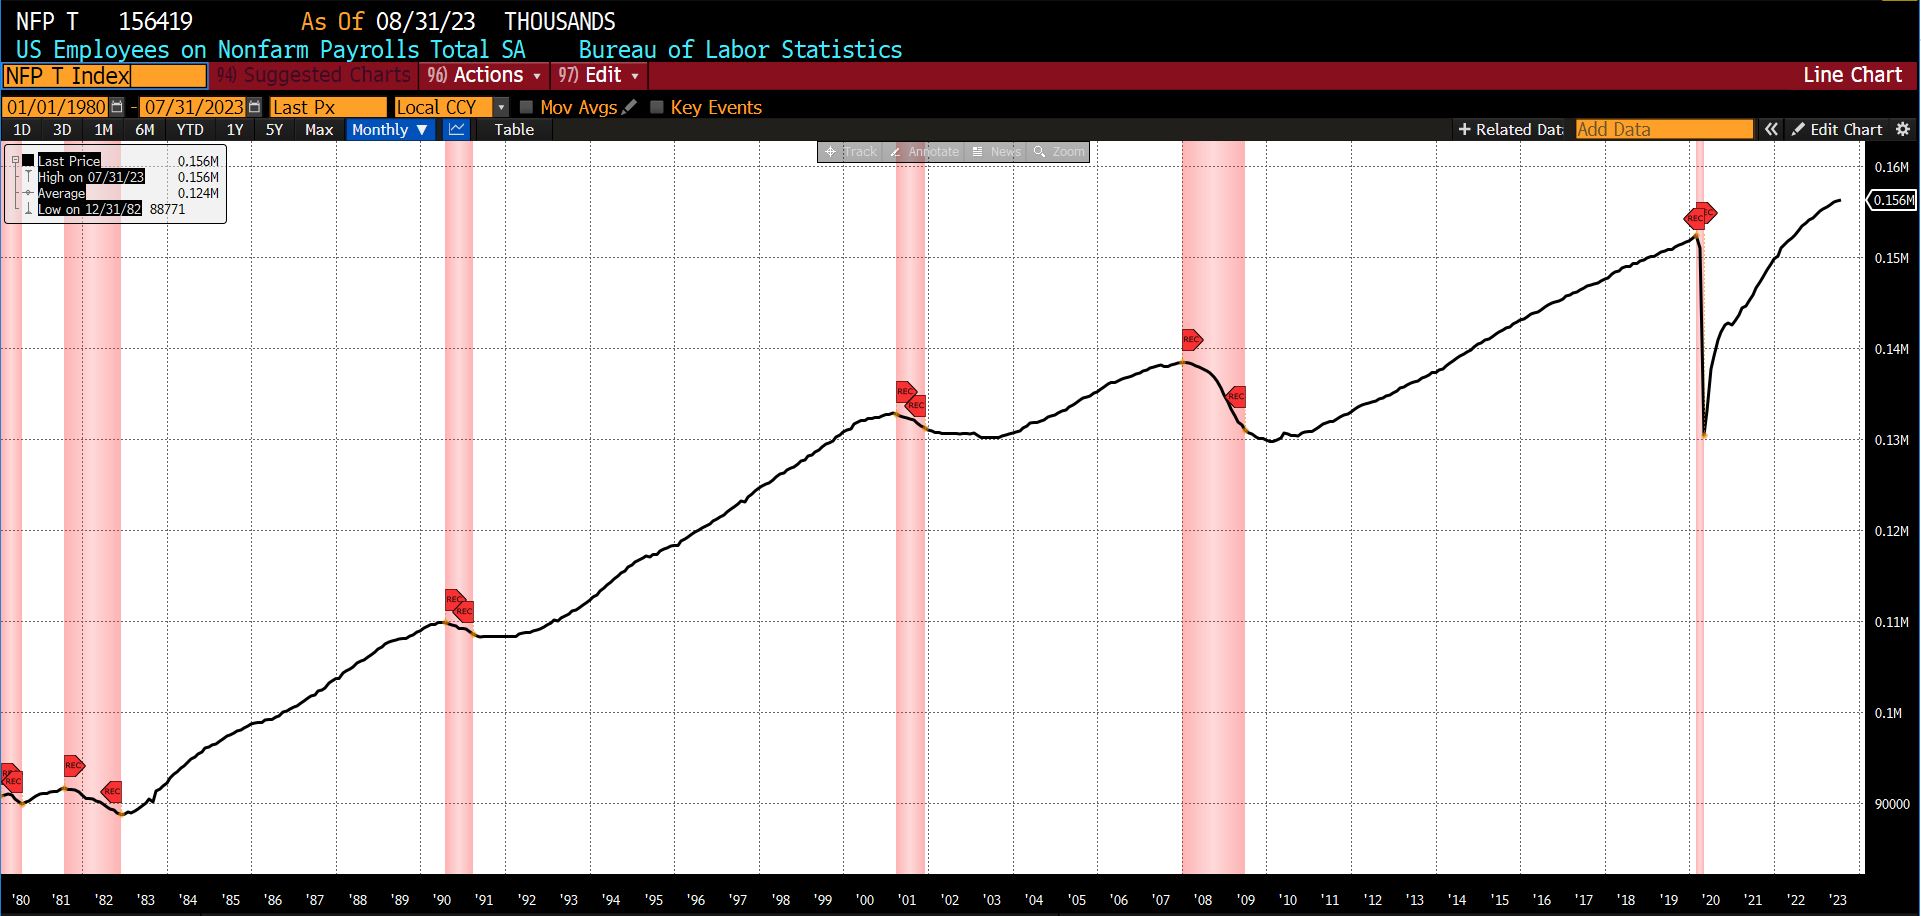
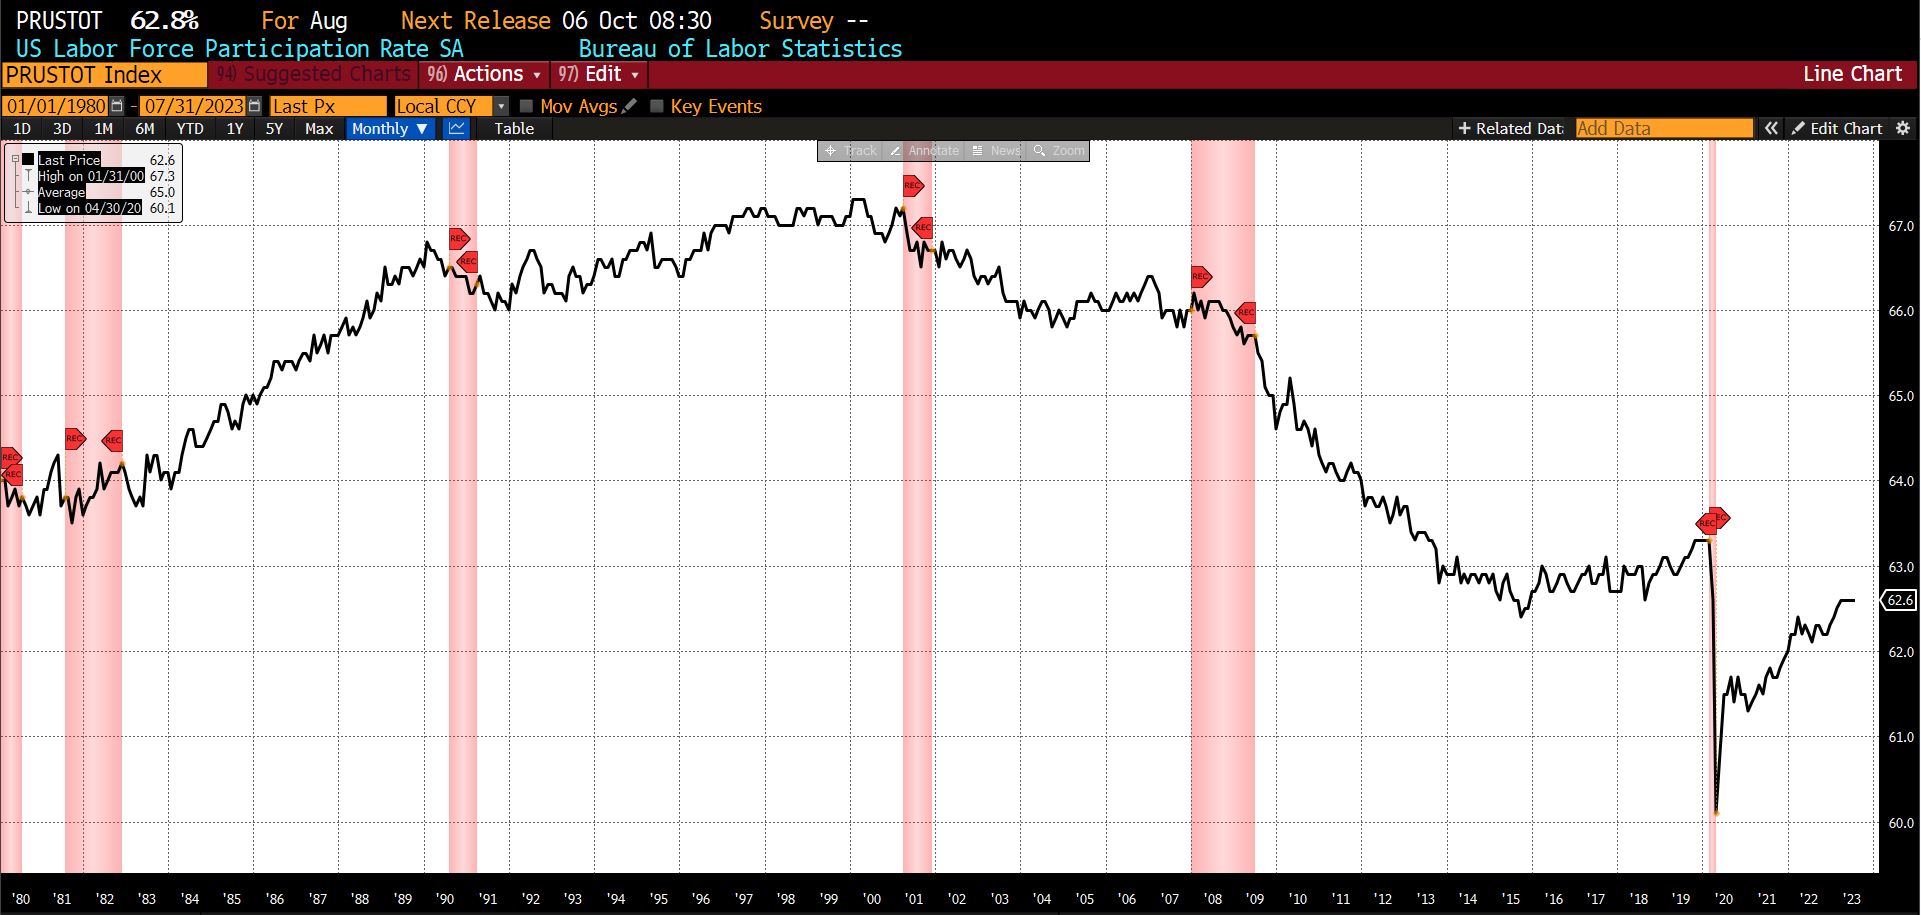
Among the six constituents of the Roughly Coincident Index, four saw expansion, one was neutral, and one declined. US Industrial Production rose by 0.6 percent while US Employees on Nonfarm Payrolls grew 0.9 percent from June to July. The Conference Board’s Coincident Manufacturing and Trade Sales and Personal Income Less Transfer Payments measures increased (0.8 percent and 0.4 percent, respectively) while the Consumer Confidence Present Situation declined 1.5 percent. The US Labor Force Participation Rate was unchanged.
Other than a reading of 66 in March 2023, since January the Lagging Indicators have been in neutral to slightly contracting territory ranging from 33 to 50.
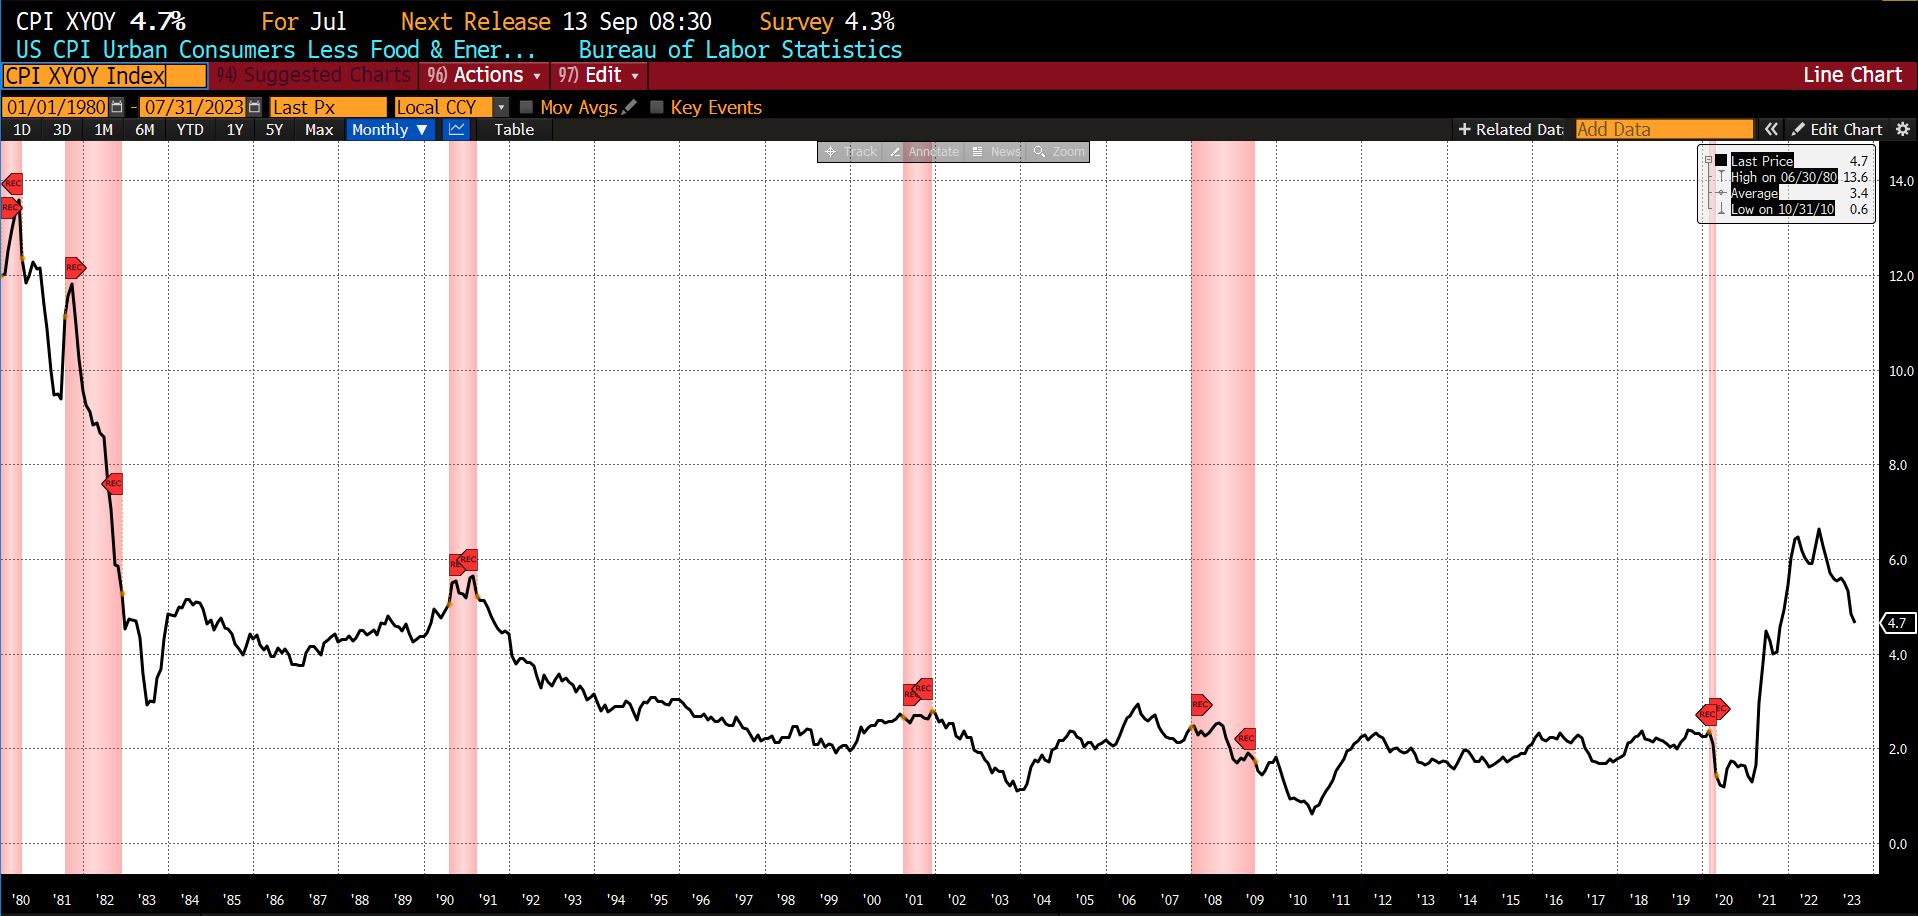
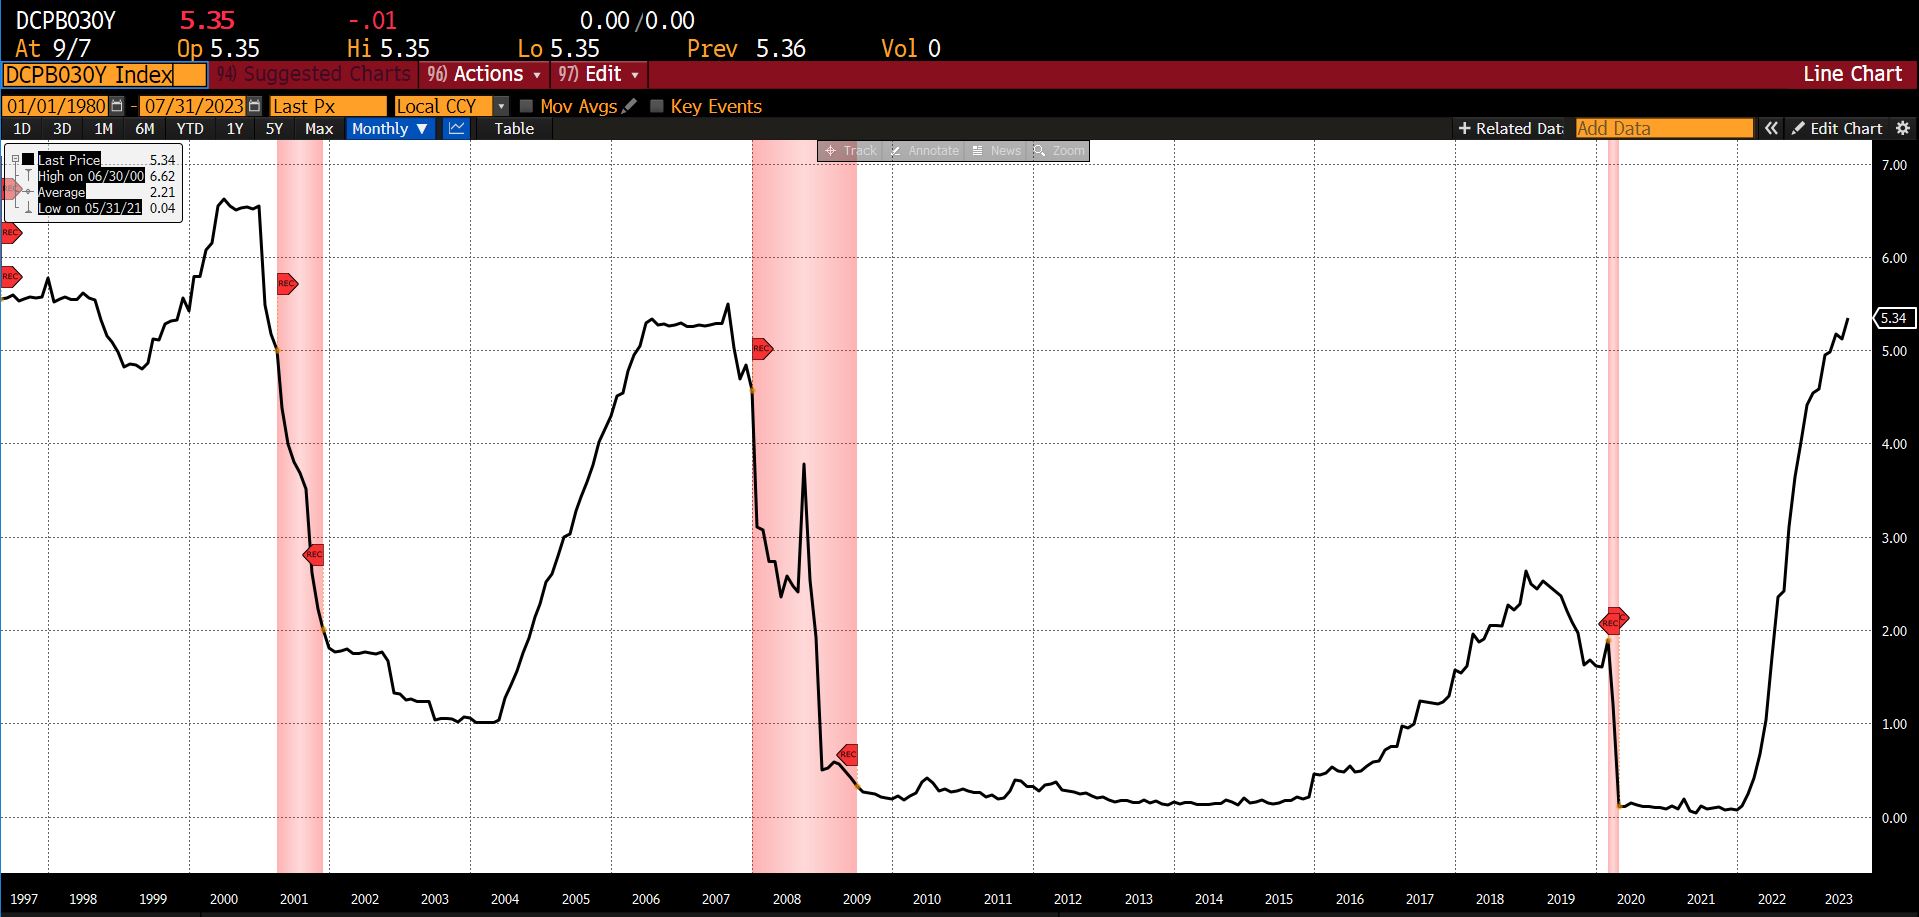
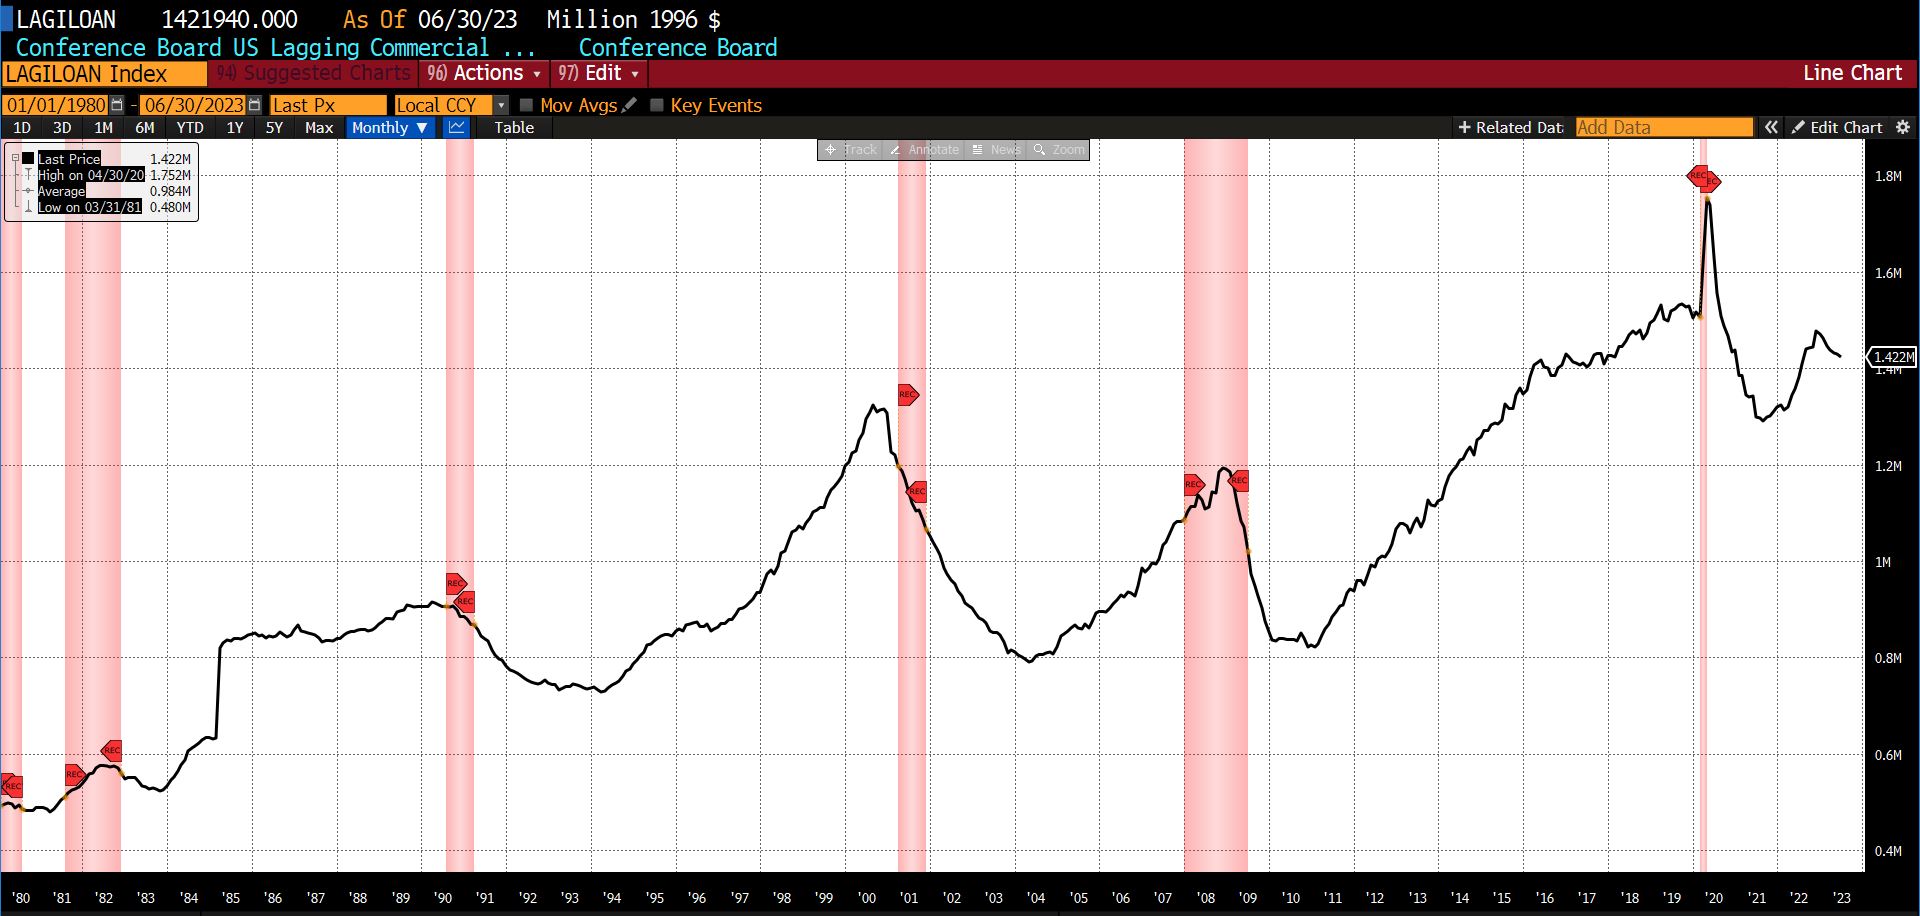
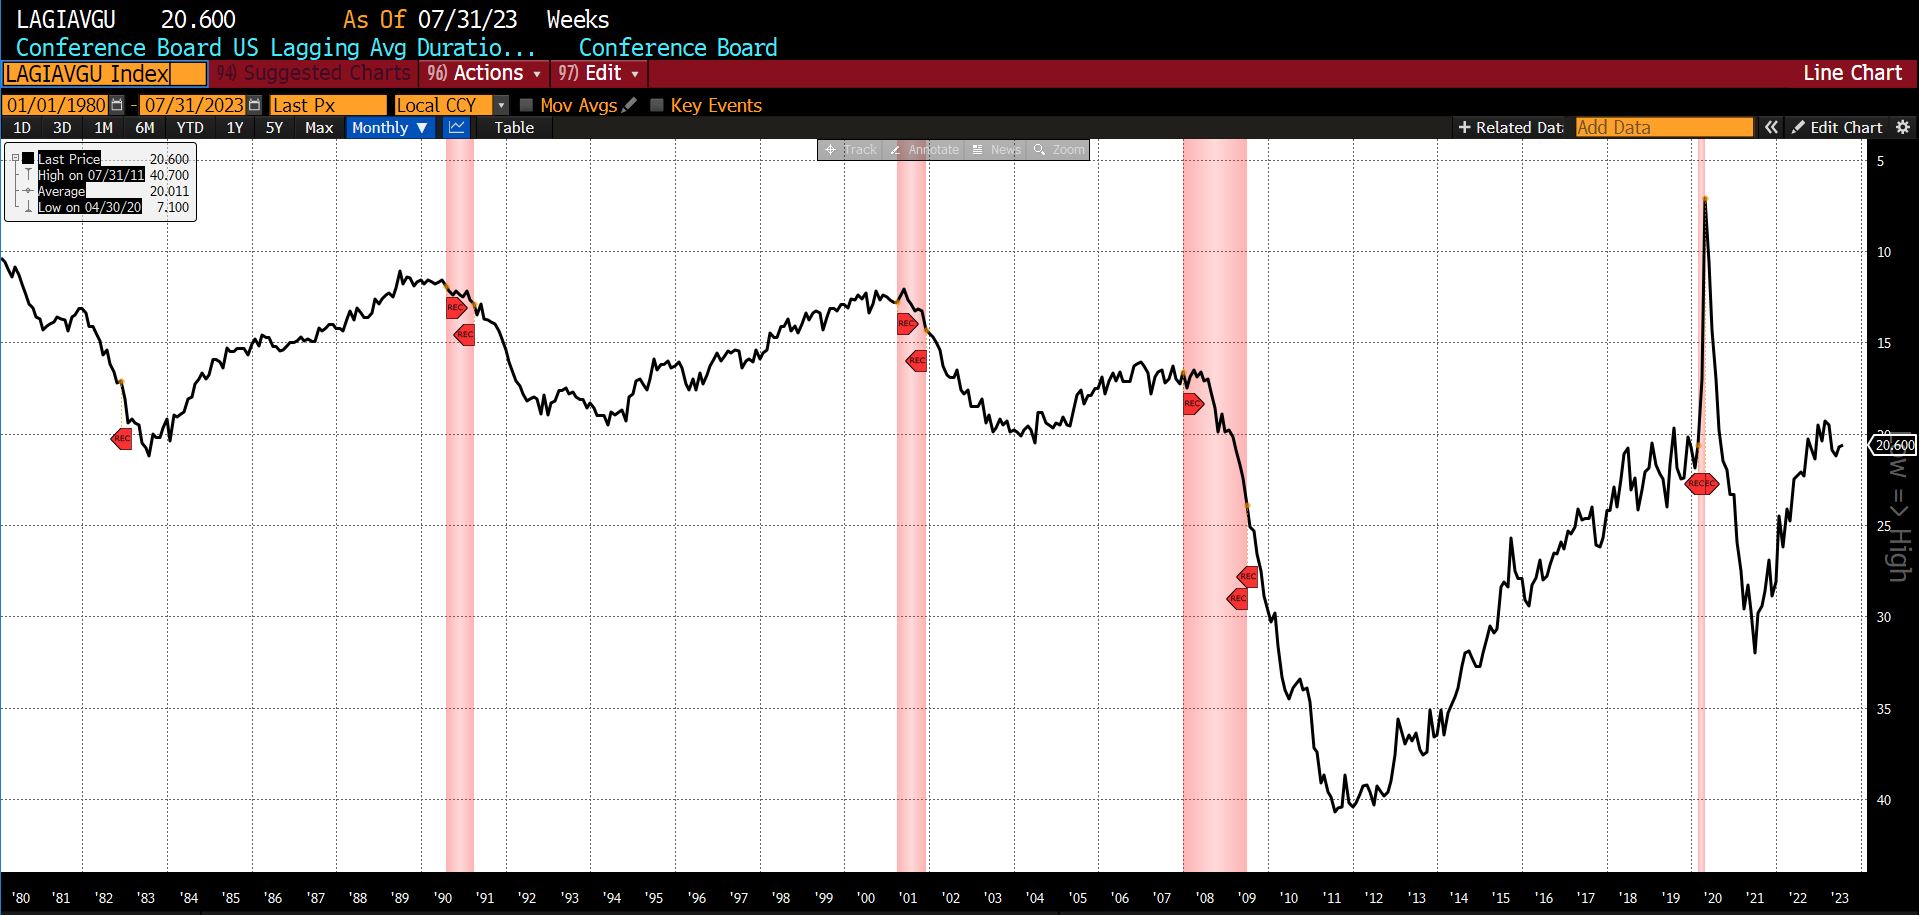
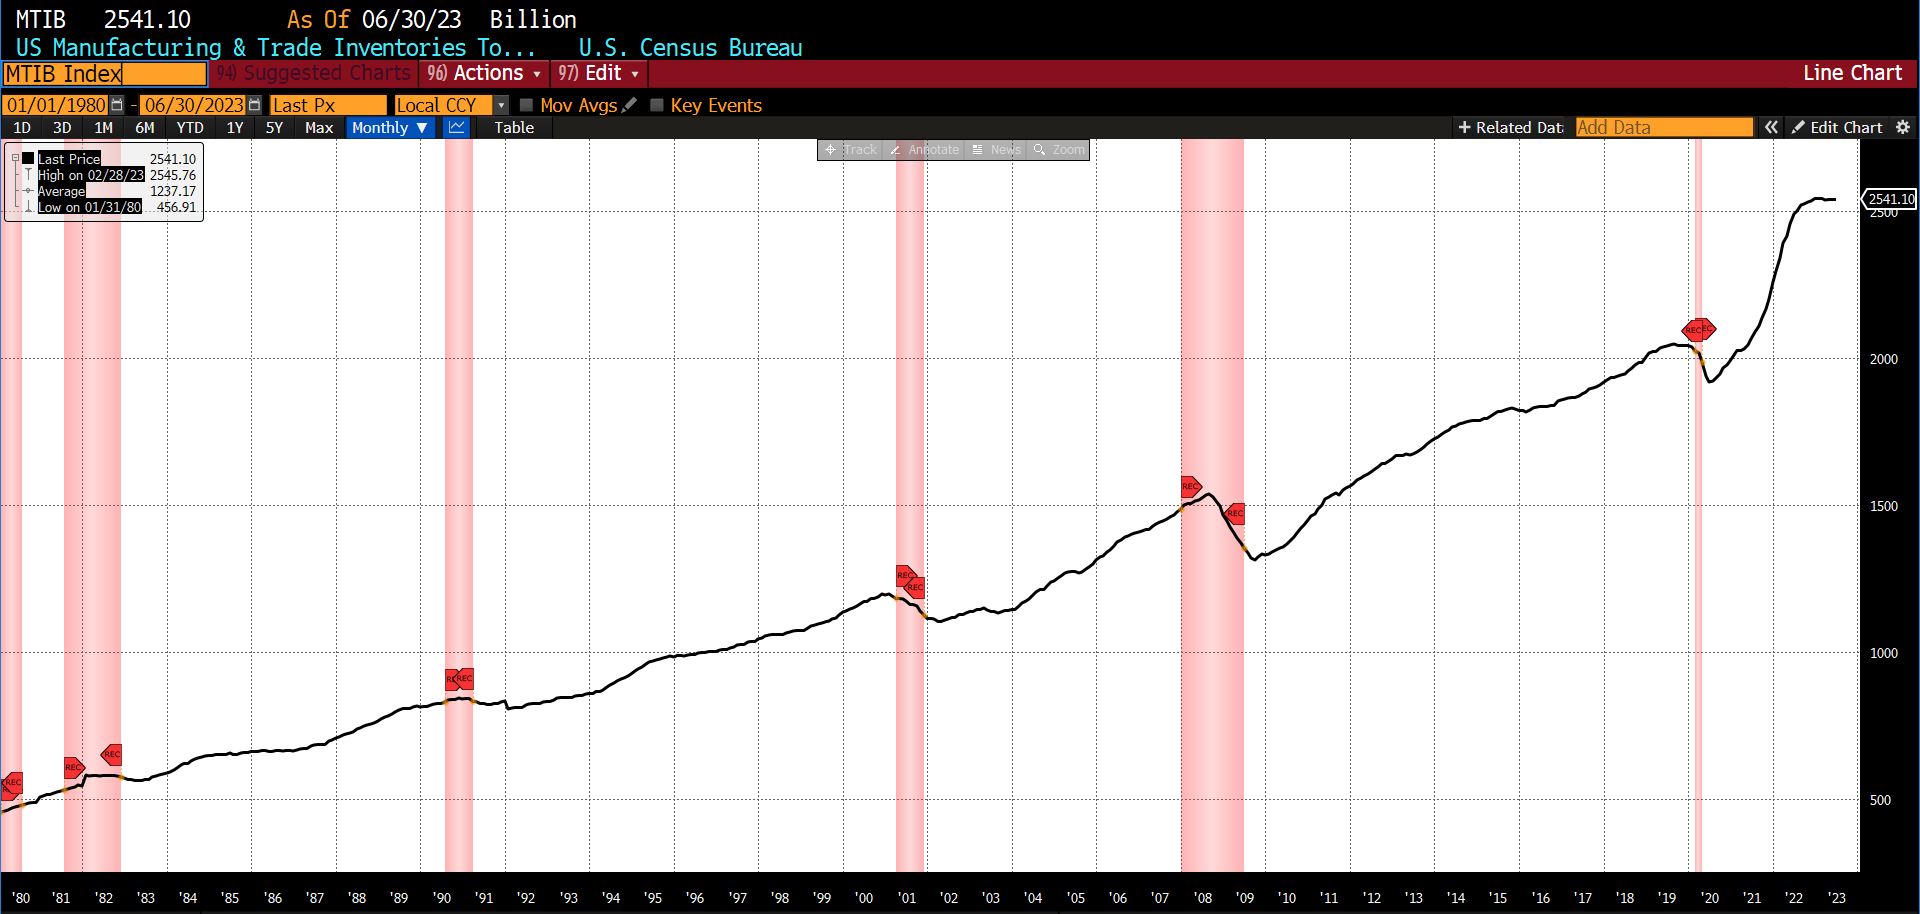
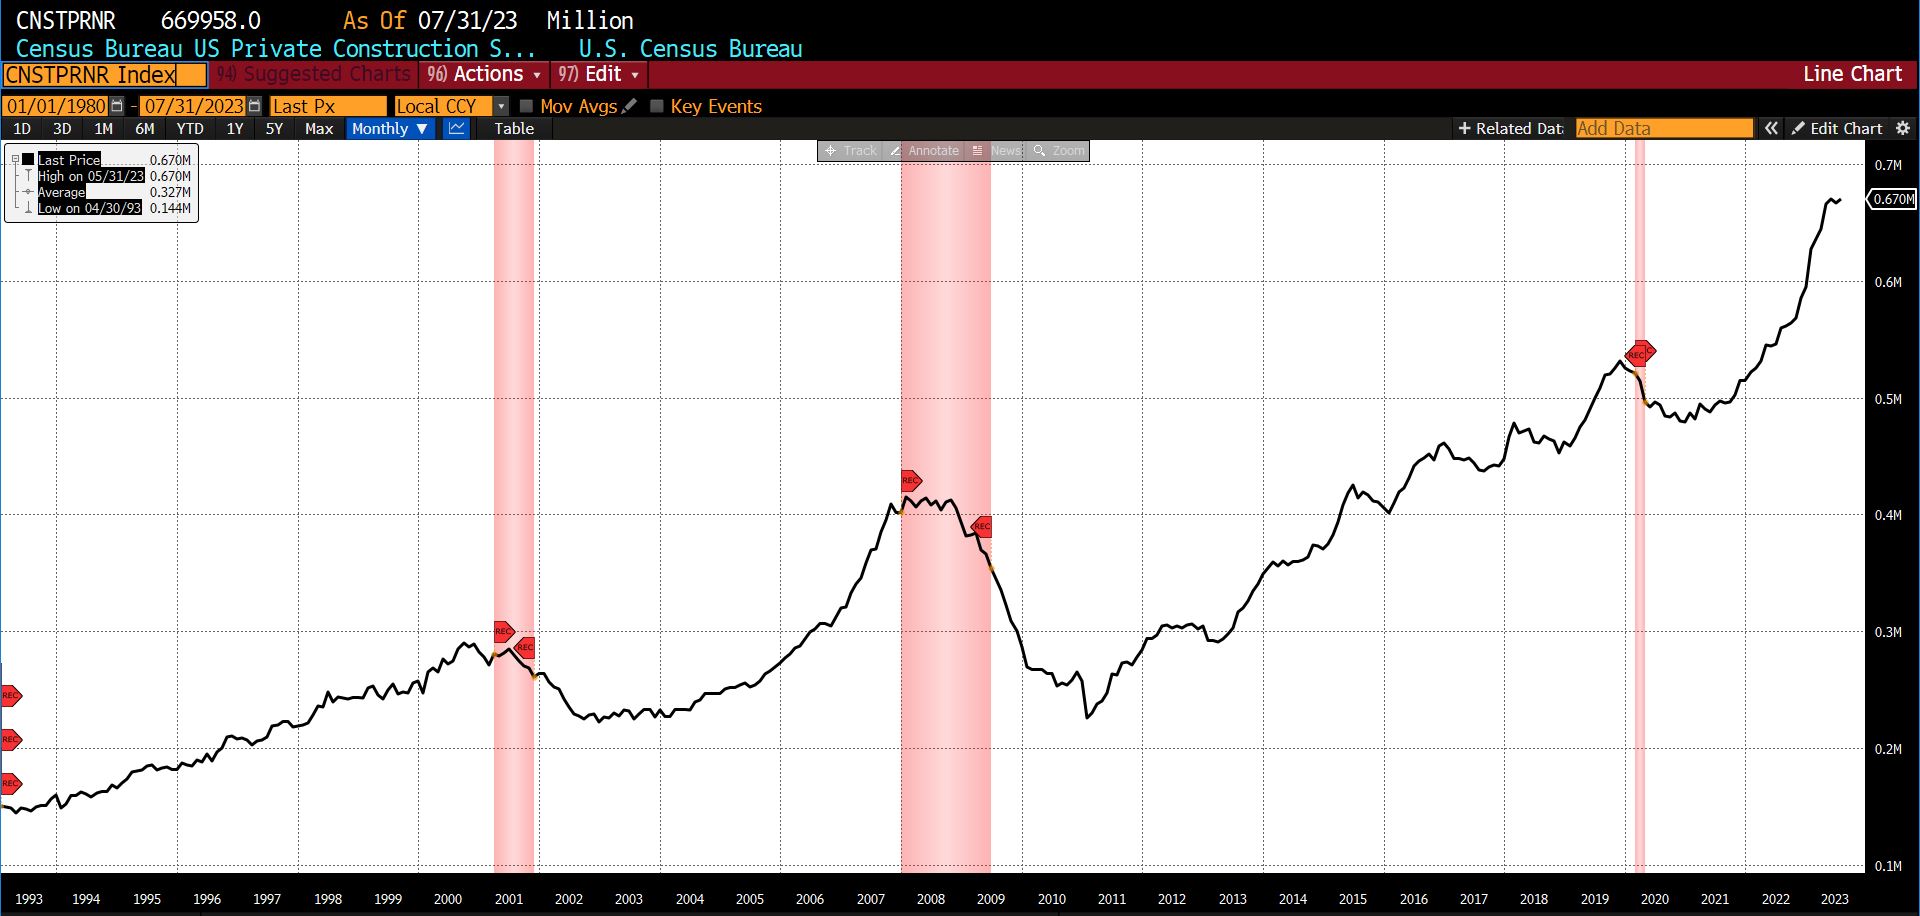
The six components of the Lagging Indicator were evenly split among rising and falling releases. Average 30-day yields rose by 4.3 percent, the Conference Board US Lagging Average Duration of Unemployment increased by 0.5 percent, and the Census Bureau’s US Private Construction Spending (Nonresidential) was up 0.5 percent in July. Declining were Core CPI (2.1 percent), US Manufacturing and Trade Inventories (0.2 percent), and Conference Board US Lagging Commercial and Industrial Loans (0.5 percent).
Discussion
AIER’s Business Conditions Monthly indicators have, since the start of the year, told three different stories. One of growing strength, as the Leading Indicator has trended up from 21 in December 2022 to 79 in July 2023. Another is of slowing expansion, as seen in the Roughly Coincident Indicator’s slide from 92 in February to 75 for the last three months (May, June, and now July 2023). And over that same time period the Lagging Indicator has oscillated between a February low of 33 to a March high of 66 indicating overall neutrality in its components. While the degree of correlation between the three would likely trend in roughly lagged parallel, the starkly conflicting readings bear evidence of the continuing disorientation of economic trends: not only from unprecedented pandemic policy measures, but the intervention-laden recovery period that followed.
In June and July 2023, based on an unanticipatedly strong 2nd quarter US GDP number as well as positive data on US employment, consumer activity, growth in nonresidential fixed investment, and continuing disinflationary progress, soft landing predictions gathered purchase. Recent data, however, hints at those prognoses being premature at best. Labor markets are rapidly cooling, and there is growing evidence that headline payroll numbers have overstated the strength of the US job market. Monthly payroll estimates have also been subject to persistent downward revisions as hiring activity has declined.
(Although after the time period that this report contemplates, we know now that the U-3 US Unemployment Rate rose from 3.5 percent to 3.8 percent between July and August 2023.)
Furthermore, in late August the US Bureau of Labor Statistics (BLS) announced the completion of its preliminary re-benchmarking of the national Current Employment Statistics. The initial result of that revision indicates that as of March 2023 US nonfarm payrolls were overestimated by approximately 306,000 jobs (0.2 percent). This is roughly twice the historical average of other such revisions and the fourth largest on record. (Details on the process and consequent revisions are shown here.) Not only does this mean that job numbers have been overstated, but upward revisions in such sectors as government jobs, utilities, and construction (the latter driven in part by government spending on infrastructure and subsidies for nonresidential fixed investment) reveal the source of certain pockets of growth in the US economy. (A discussion of the breakdown of 2nd quarter US GDP, in particular the disproportionate contribution of nonresidential fixed investment, can be revisited here.)
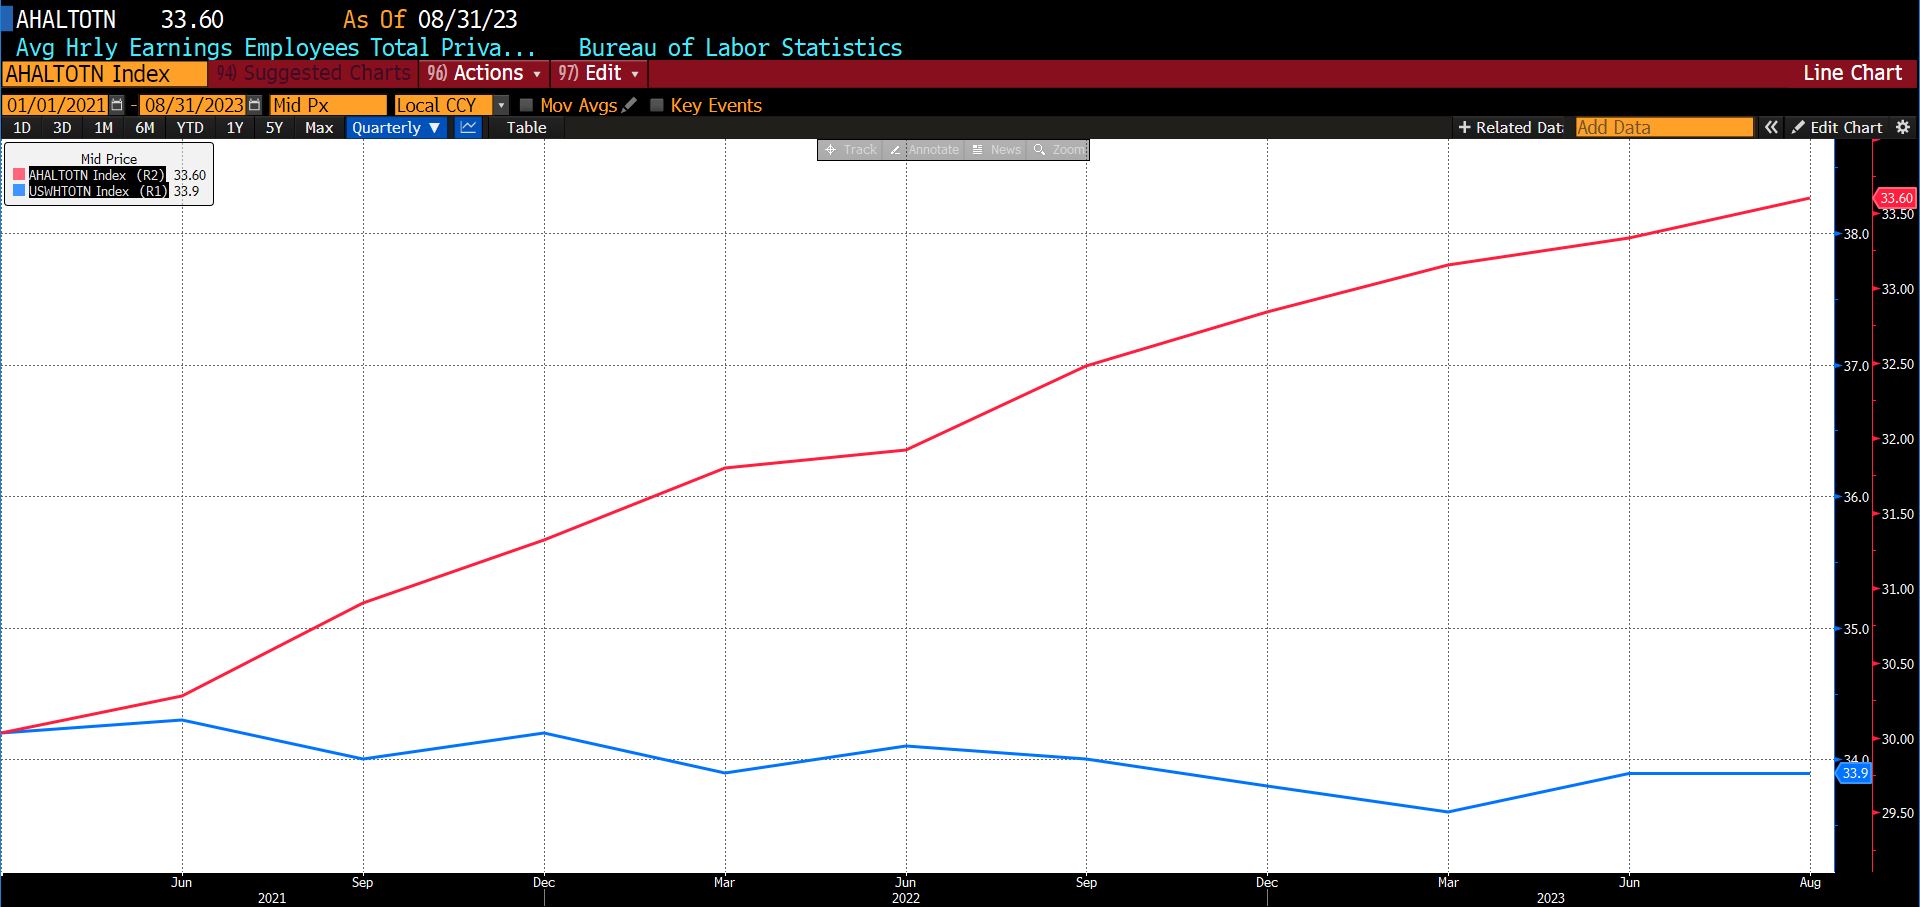
While hourly wages have grown over the past few years since the pandemic ended, both inflation and a trend of gradually declining average weekly hours worked has mitigated much of the benefit of that uptrend.
Average US Hourly Earnings Total Private Employees & Average Weekly US Hours Private Nonfarm Payrolls (both NSA), 2021 – present
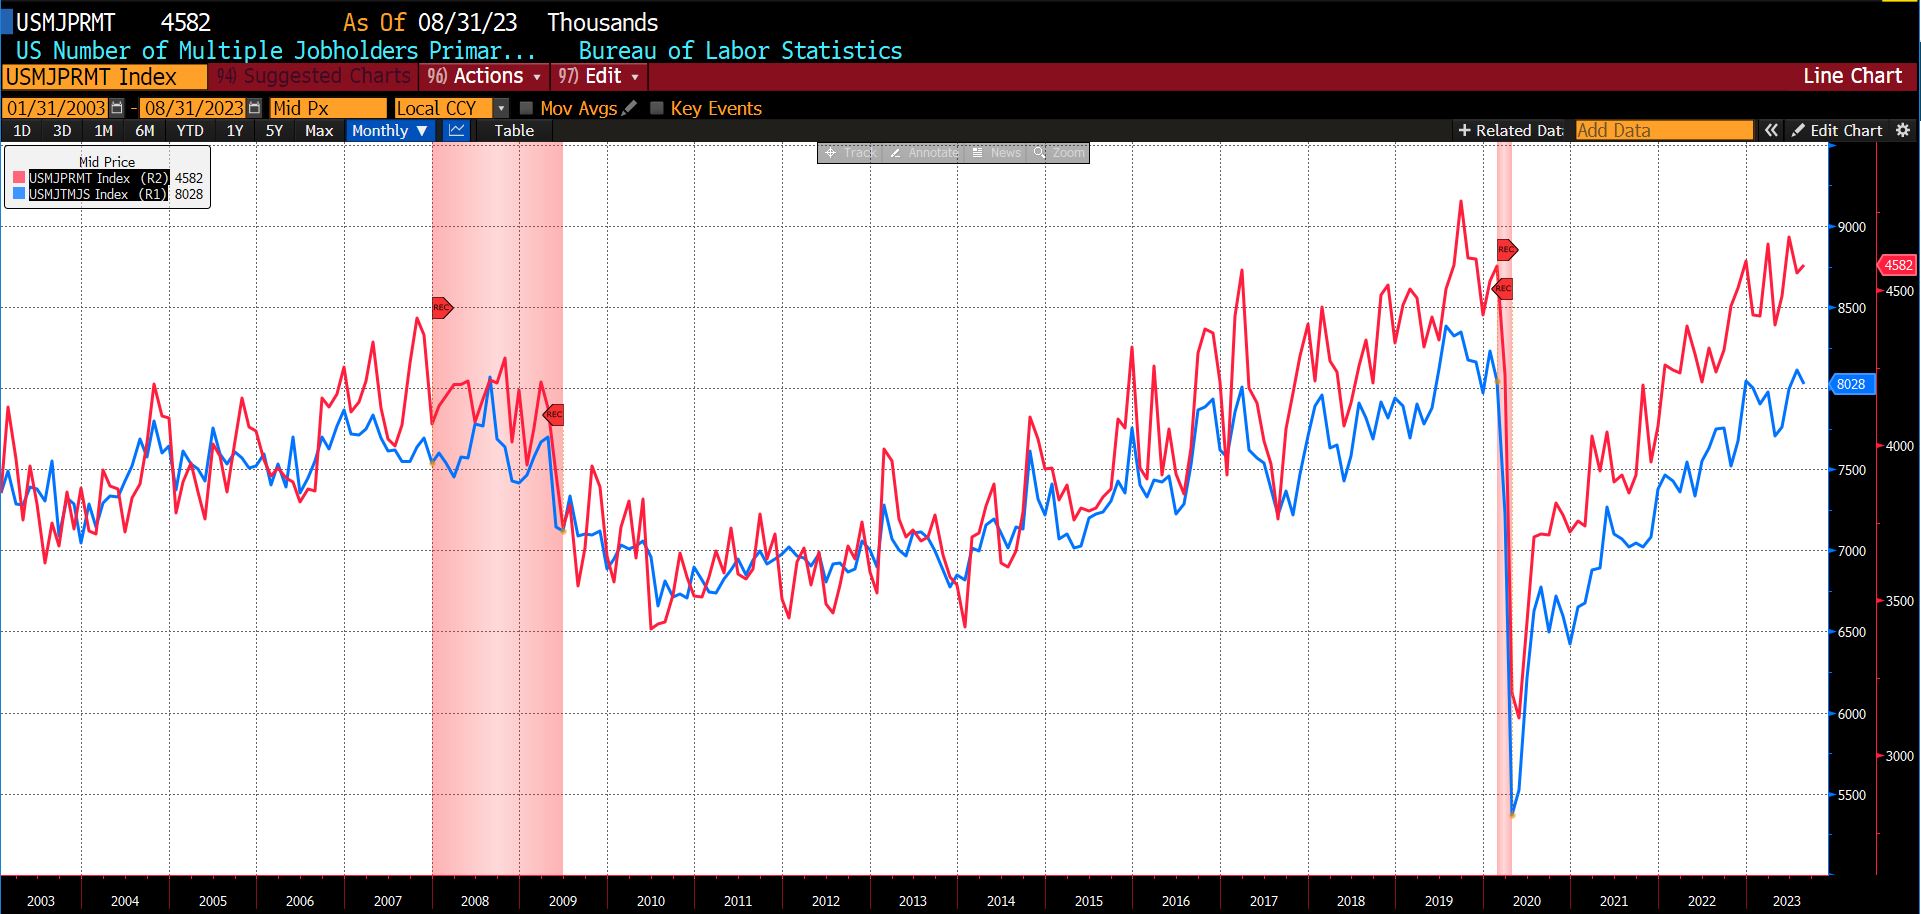
Additionally implying pressure on consumers, since the end of the pandemic workers reporting both a full- and part-time job and two full-time jobs have surged. These statistics, moreover, are likely underestimated as many secondary jobs are undertaken informally on an unreported income basis.
US Number of Multiple Jobholders, Total & US Number of Multiple Jobholders, Primary FT/Secondary FT (both SA), 2003 – present
While increasing slack in US labor markets and effectively declining wages are aiding the deflationary trend, the outlook for ongoing consumer strength (which accounted for nearly half of the second quarter US GDP result) is consequently poor. Pandemic savings are nearly exhausted, and 30-day default rates on car loans and general consumer loans are approaching pre-pandemic highs. Credit card debt default rates now exceed pre-COVID levels.
Federal Reserve US Delinquency Rates for All Banks Credit Cards, Federal Reserve US Delinquencies for All Consumer Loans, and Capital One 30-day Delinquencies Auto Finance, 2018 – present
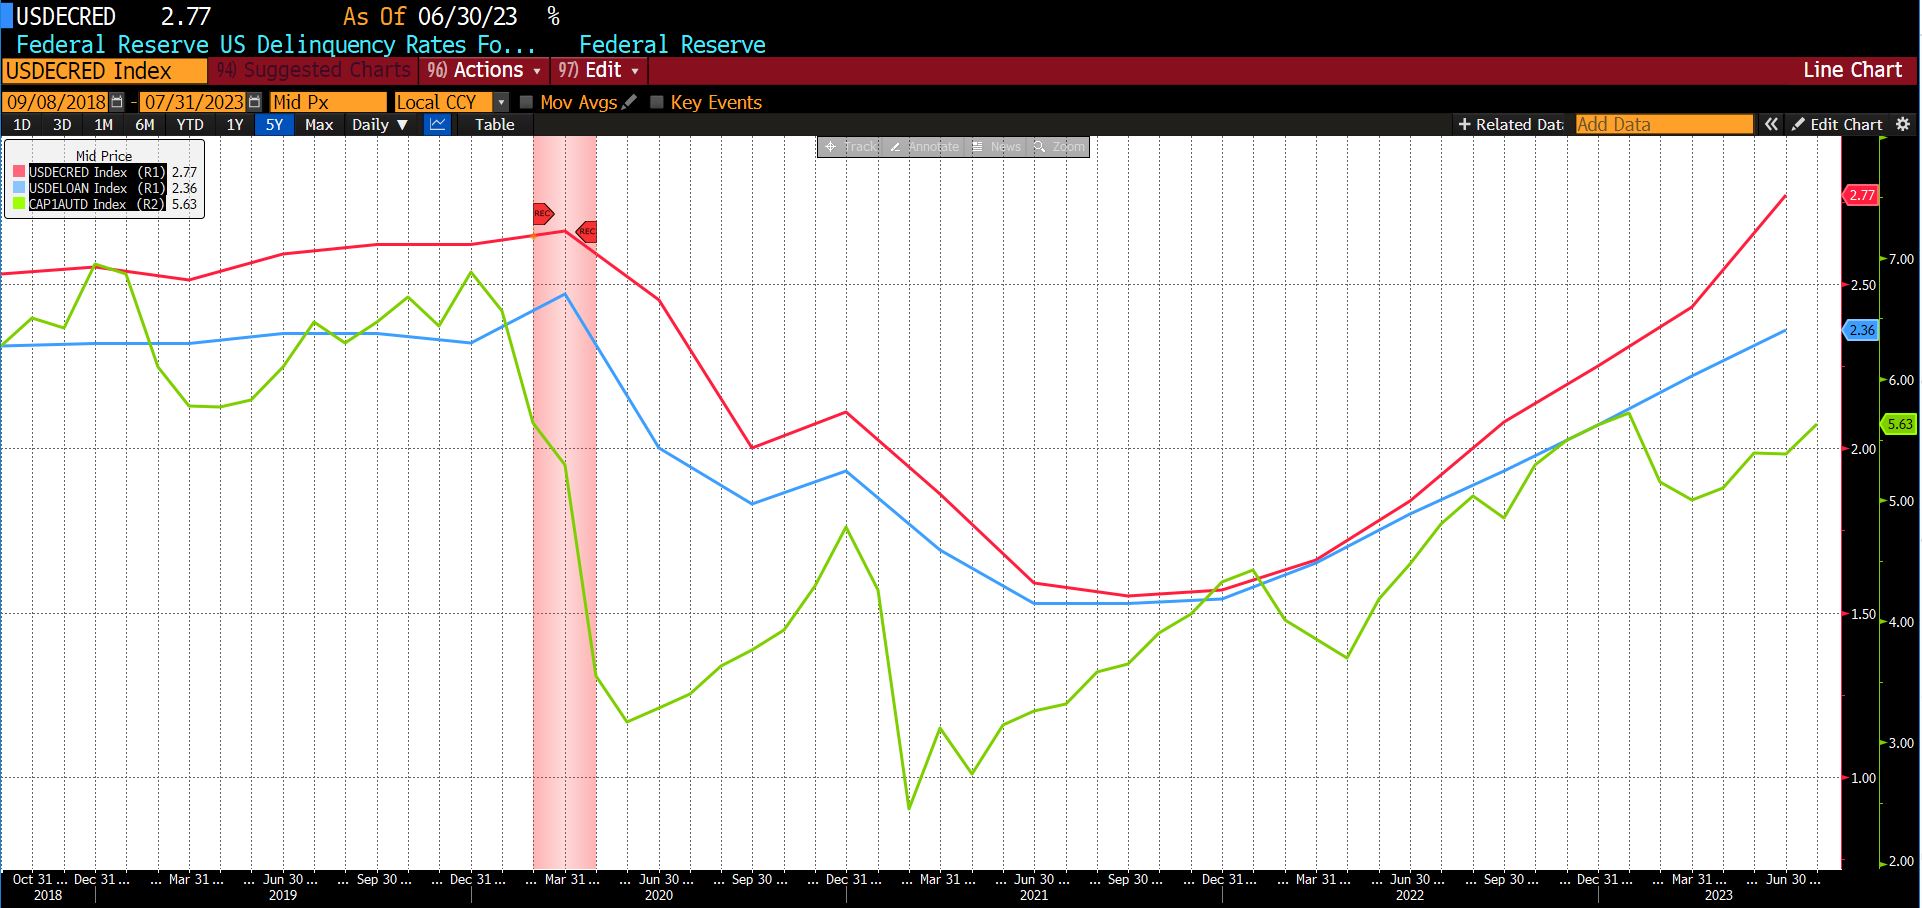
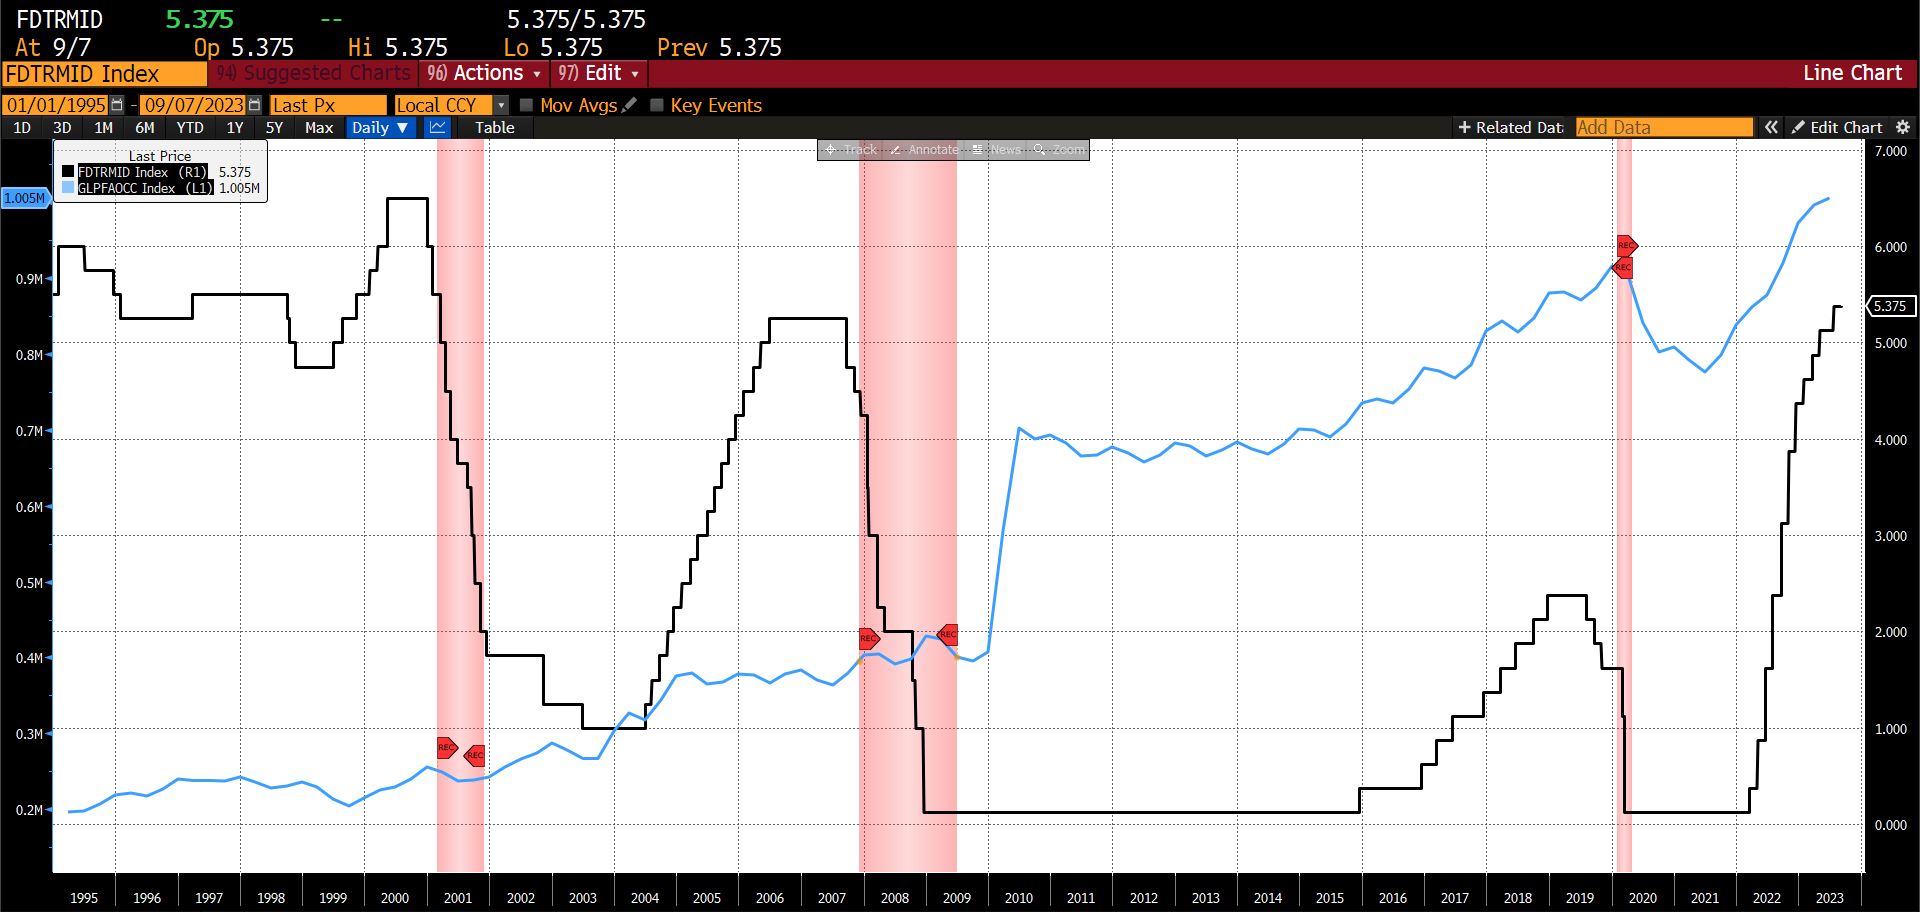
The average rate of interest on credit card balances is now at an all-time high of 20.63 percent, up from 16.34 percent in March 2022 when the Federal Reserve began its contractionary policy campaign. Over that period of time, outstanding credit card debt has risen from approximately $860 billion to over $1 trillion. Unlike previous cycles in which outstanding credit card debt has flattened or risen slightly when the Fed has raised rates more than one or two percent, total credit card debt has increased by 16.3 percent while Fed Fund rates have increased more than tenfold.
Fed Fund target (mid) & Federal Deposit Insurance Corporation Outstanding Credit Card Balance, 1995 – present
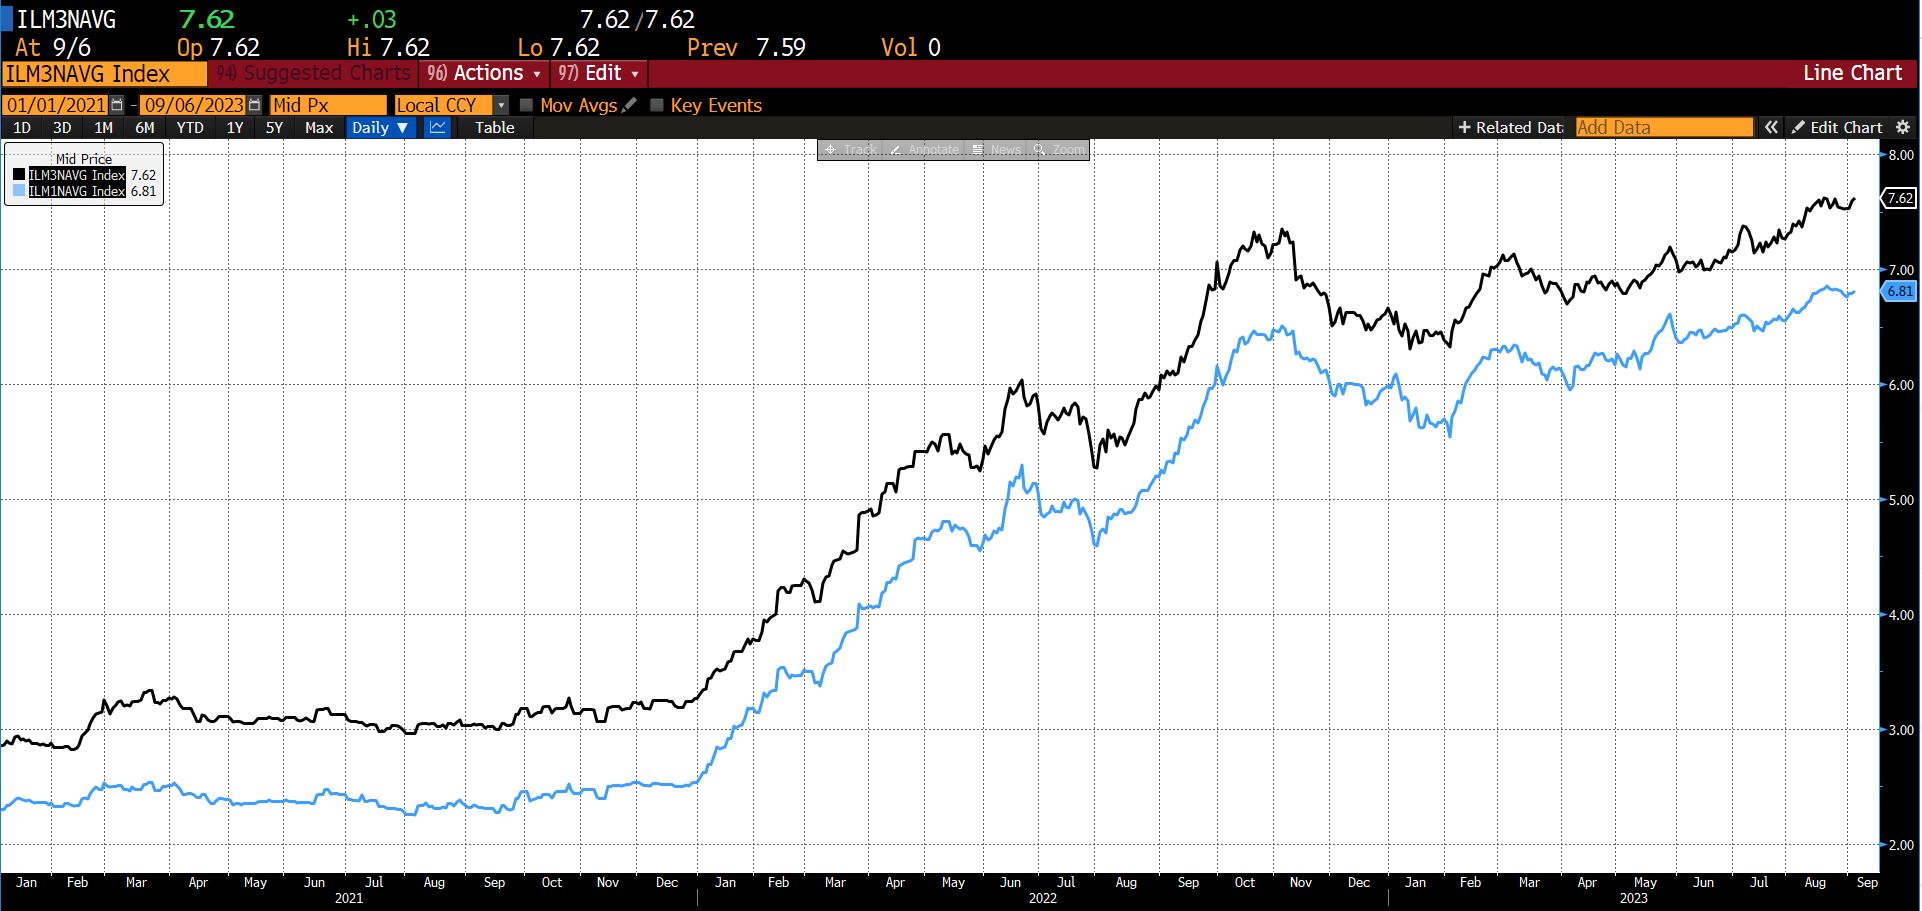
Mortgage rates (both 15-year and 30-year fixed) have more than doubled since the end of the pandemic.
Bankrate.com US Home Mortgage 15-year and 30-year Fixed Rate, 2021 – present
Many retailers, most notably deep discounters such as Dollar General, have been reporting headwinds to second quarter earnings. Several weeks ago, LendingClub Corporation released the 25th edition of its New Reality Check: Paycheck-to-Paycheck research, which “examines the impact of nonessential spending on consumers’ ability to manage expenses and put aside savings.” The findings (which can be reviewed in full here) derive from July 2023 survey responses, and include the following estimates:
- Some 61 percent of US consumers live paycheck-to-paycheck
- Roughly one fifth of US consumers are struggling to make bill payments
- Sixteen million (10 percent of the paycheck-to-paycheck population) US consumers claim that frivolous spending is the primary reason for constrained personal finances
Elsewhere, a year-long survey of over 8,000 consumers reported that
- Nearly one-third of Americans are skipping meals owing to financial concerns
- Americans believe that inflation in food-at-home items is over 22 percent year-over-year versus the 7.1 percent rate reported by BLS
- 62 percent of Americans, 72 percent of families, and 75 percent of US consumers between the ages of 18 and 44 would have trouble paying an unexpected $400 expense
In summary, and with the caution that should attend social science empirics: a weakening US job market on top of the increasingly encumbered financial circumstances of many US citizens renders the continuation of robust consumption doubtful. The impending resumption of student loan payments in October 2023 is likely to aggravate those trends, and if deleterious enough may prompt renewed attempts at political intervention.
It remains possible that the buoyancy provided by government spending via the Bipartisan Infrastructure Act, Inflation Reduction Act, and the CHIPS and Science Act may keep the US economy from entering a “statutory” recession. But strained consumers, contracting manufacturing, rising energy prices, the risk of over-tightening by the Fed, and other developing trends are apt to be less amenable to manipulation. The prediction that the United States will enter an economic recession on or before September 2024 stands.
LEADING INDICATORS
ROUGHLY COINCIDENT INDICATORS
LAGGING INDICATORS
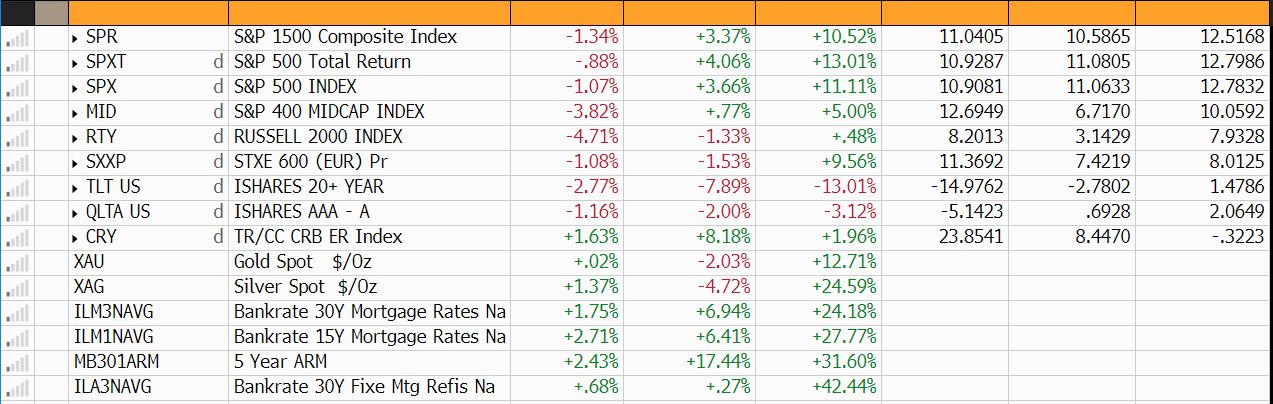
CAPITAL MARKET PERFORMANCE
(All charts and data sourced via Bloomberg Finance, LP)