Business Conditions Monthly October 2023

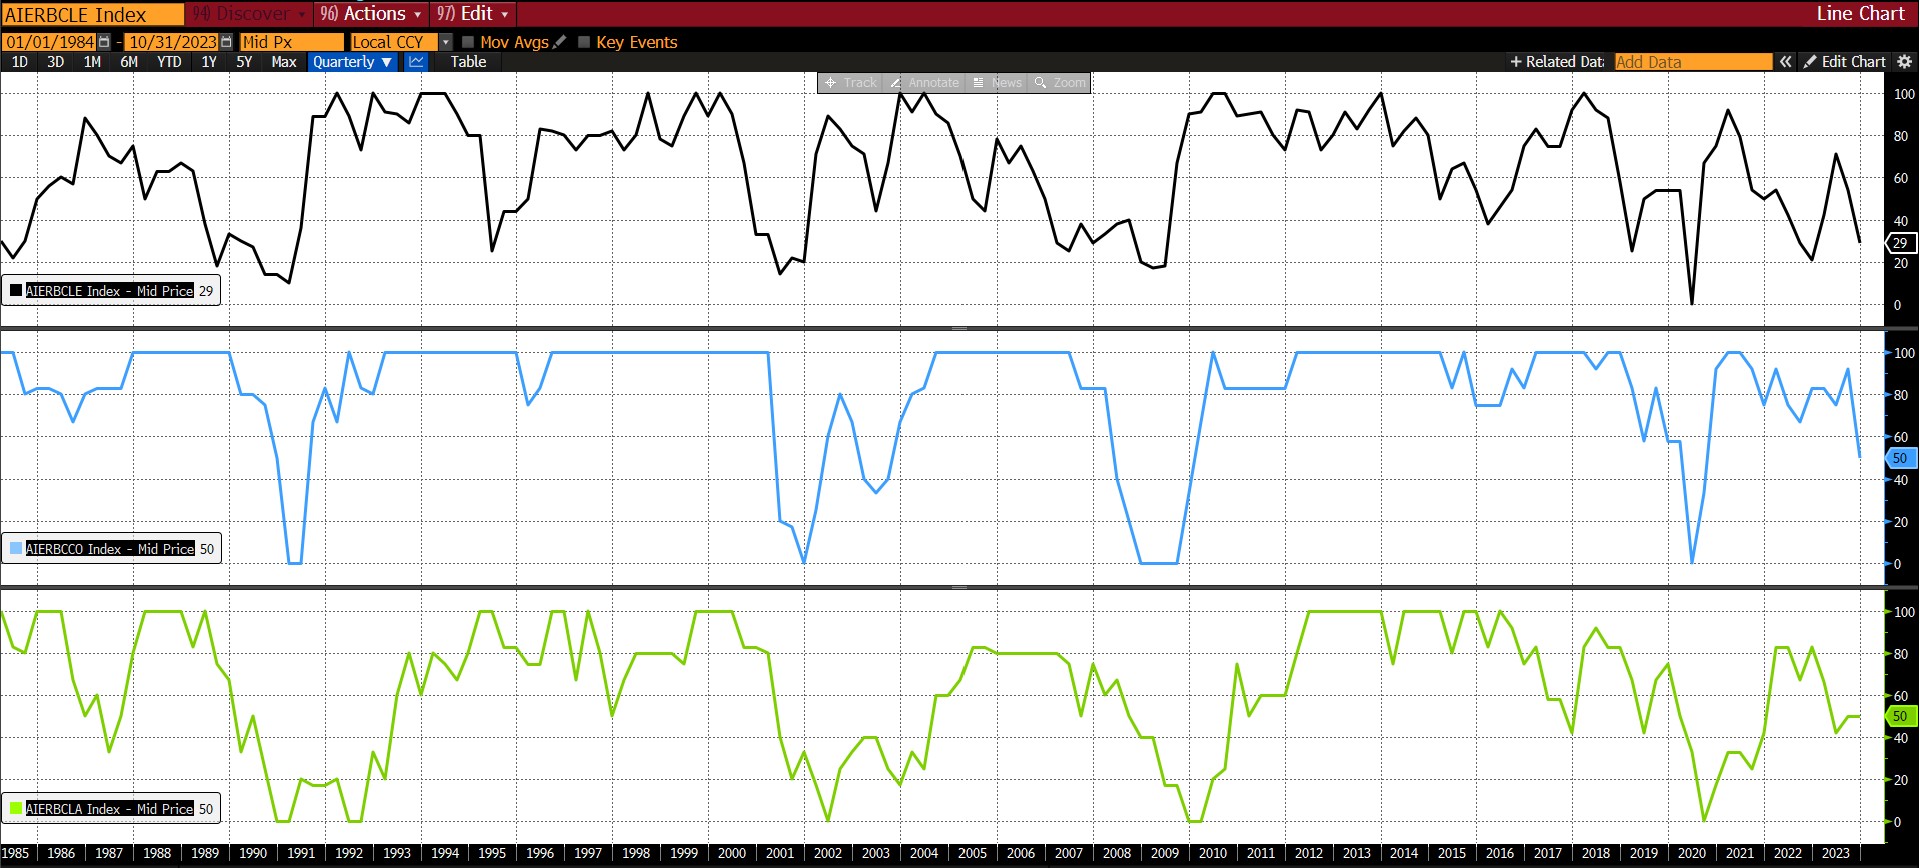
In October 2023, AIER’s Business Conditions Monthly indices shifted downward. Our Leading Indicator fell to a contractionary 29, a level it has not registered since the period between July and December 2022. The Roughly Coincident Indicator fell from 92 in September to 50 in October, a stark turn from highly expansionary to neutral. And the Lagging Indicator remained at its September level of 50 in October.
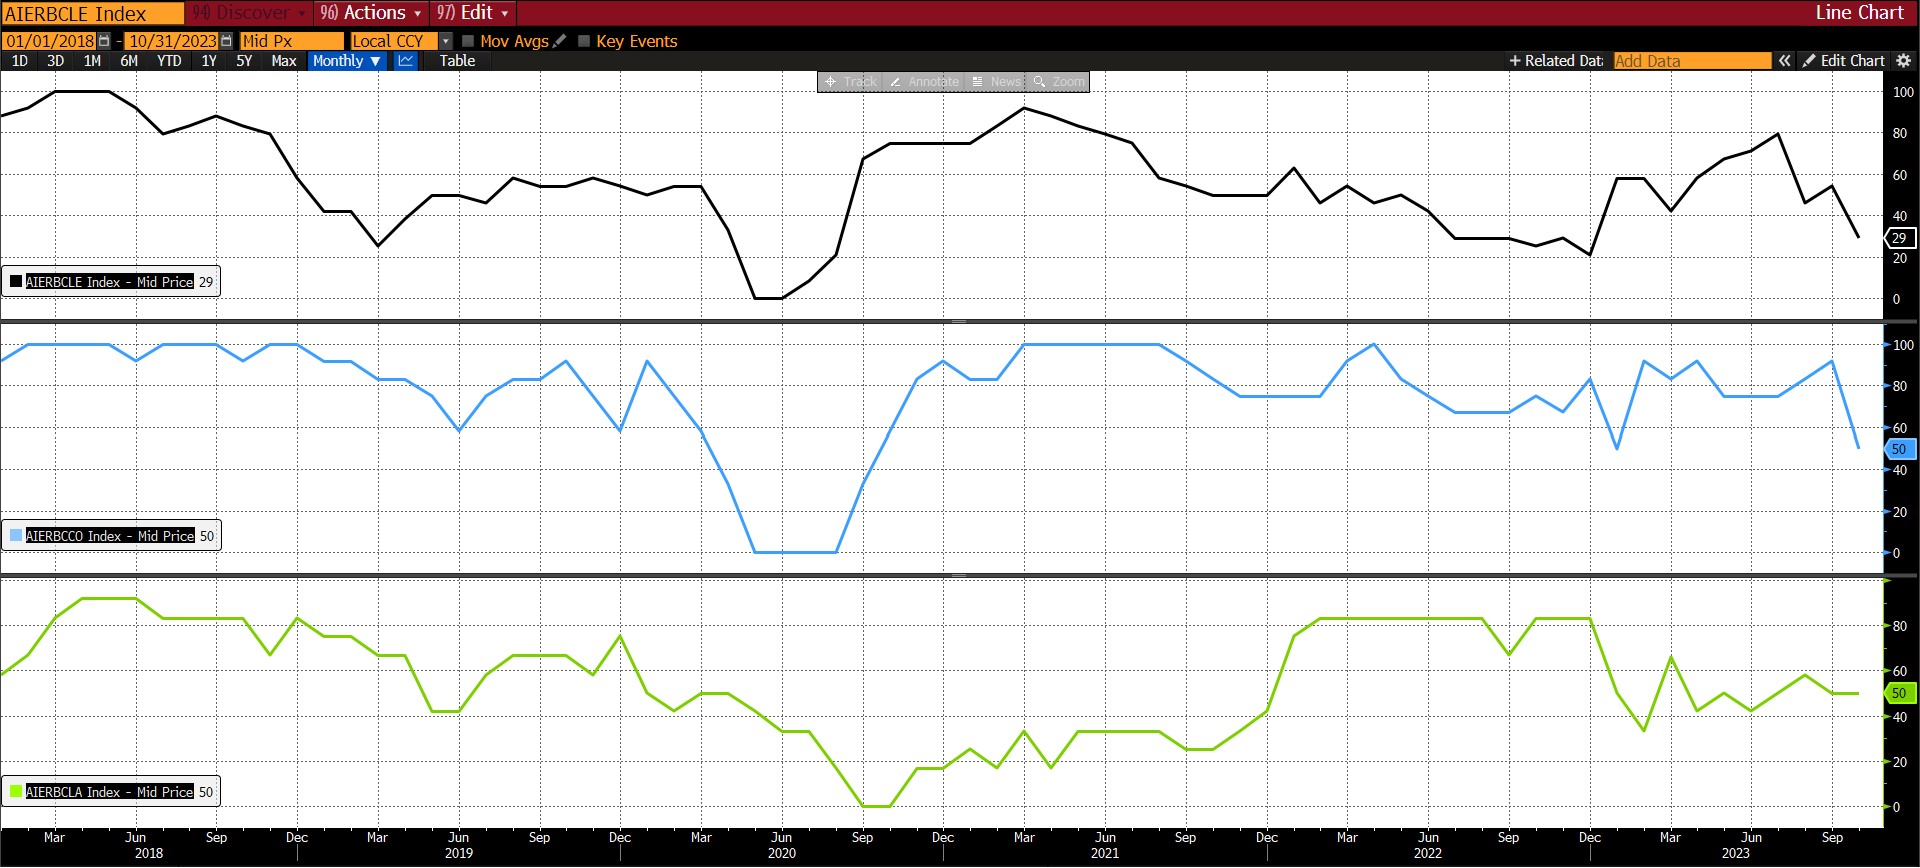
Leading Indicators (29)
From September to October 2023, eight of the twelve leading indicators declined, three rose, and one was neutral.
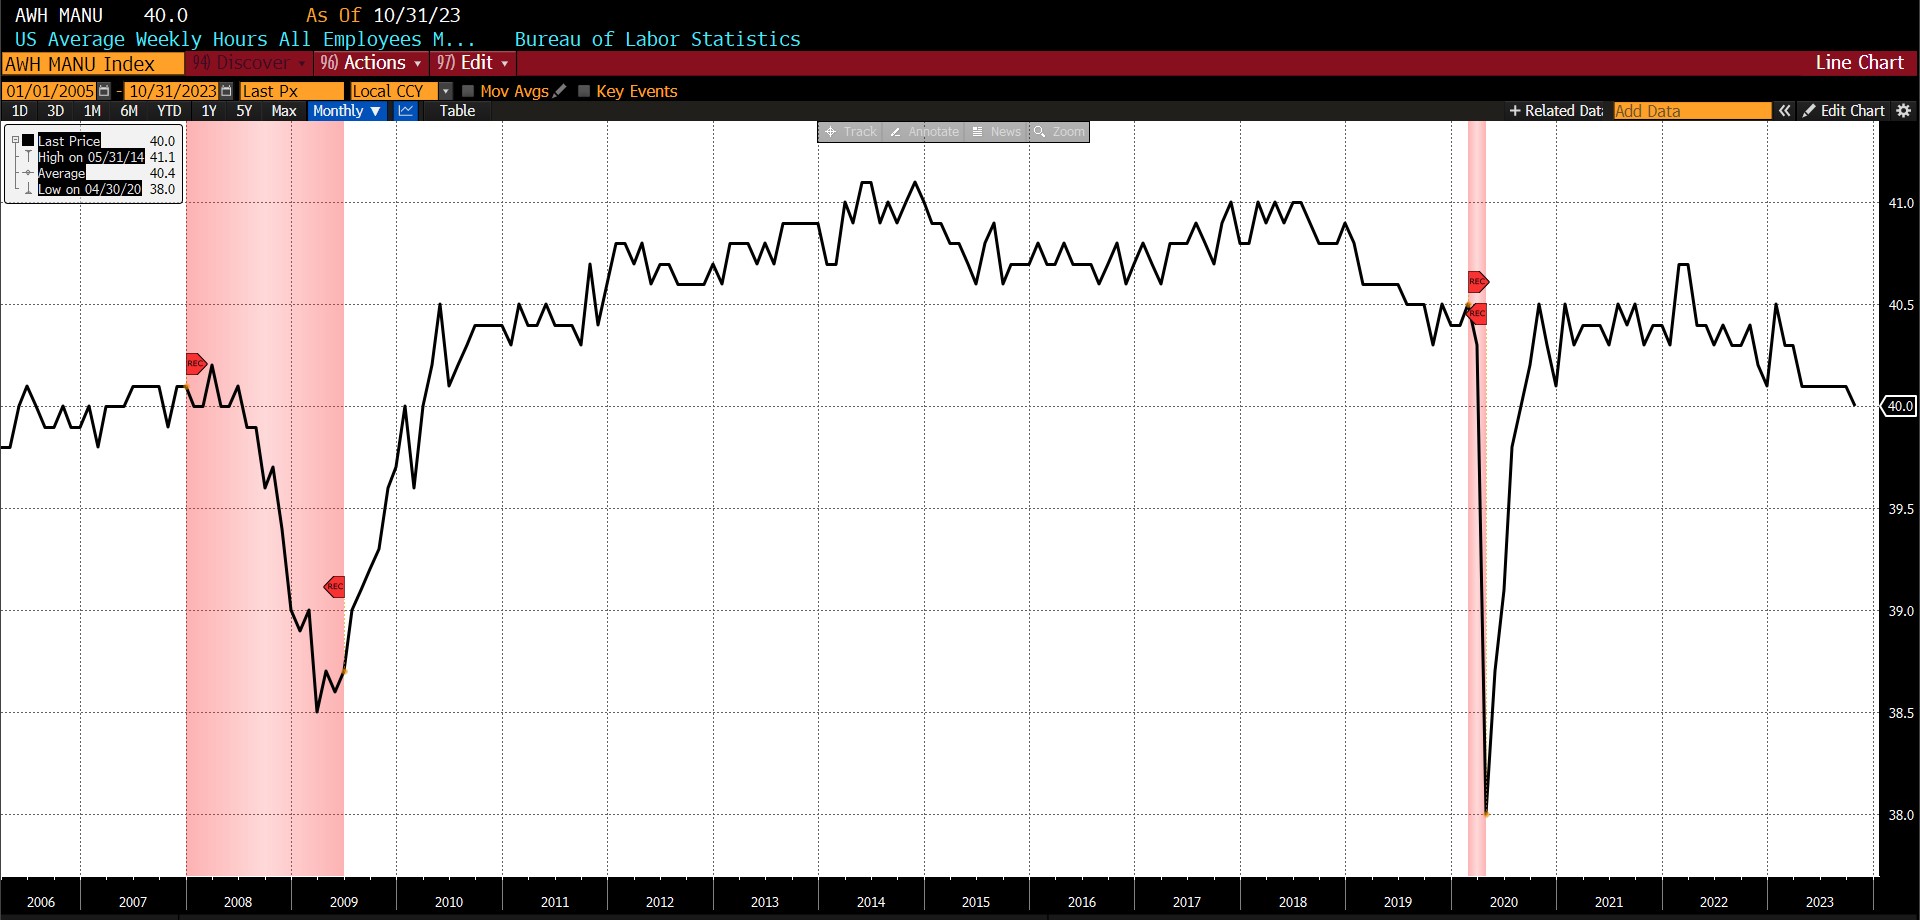
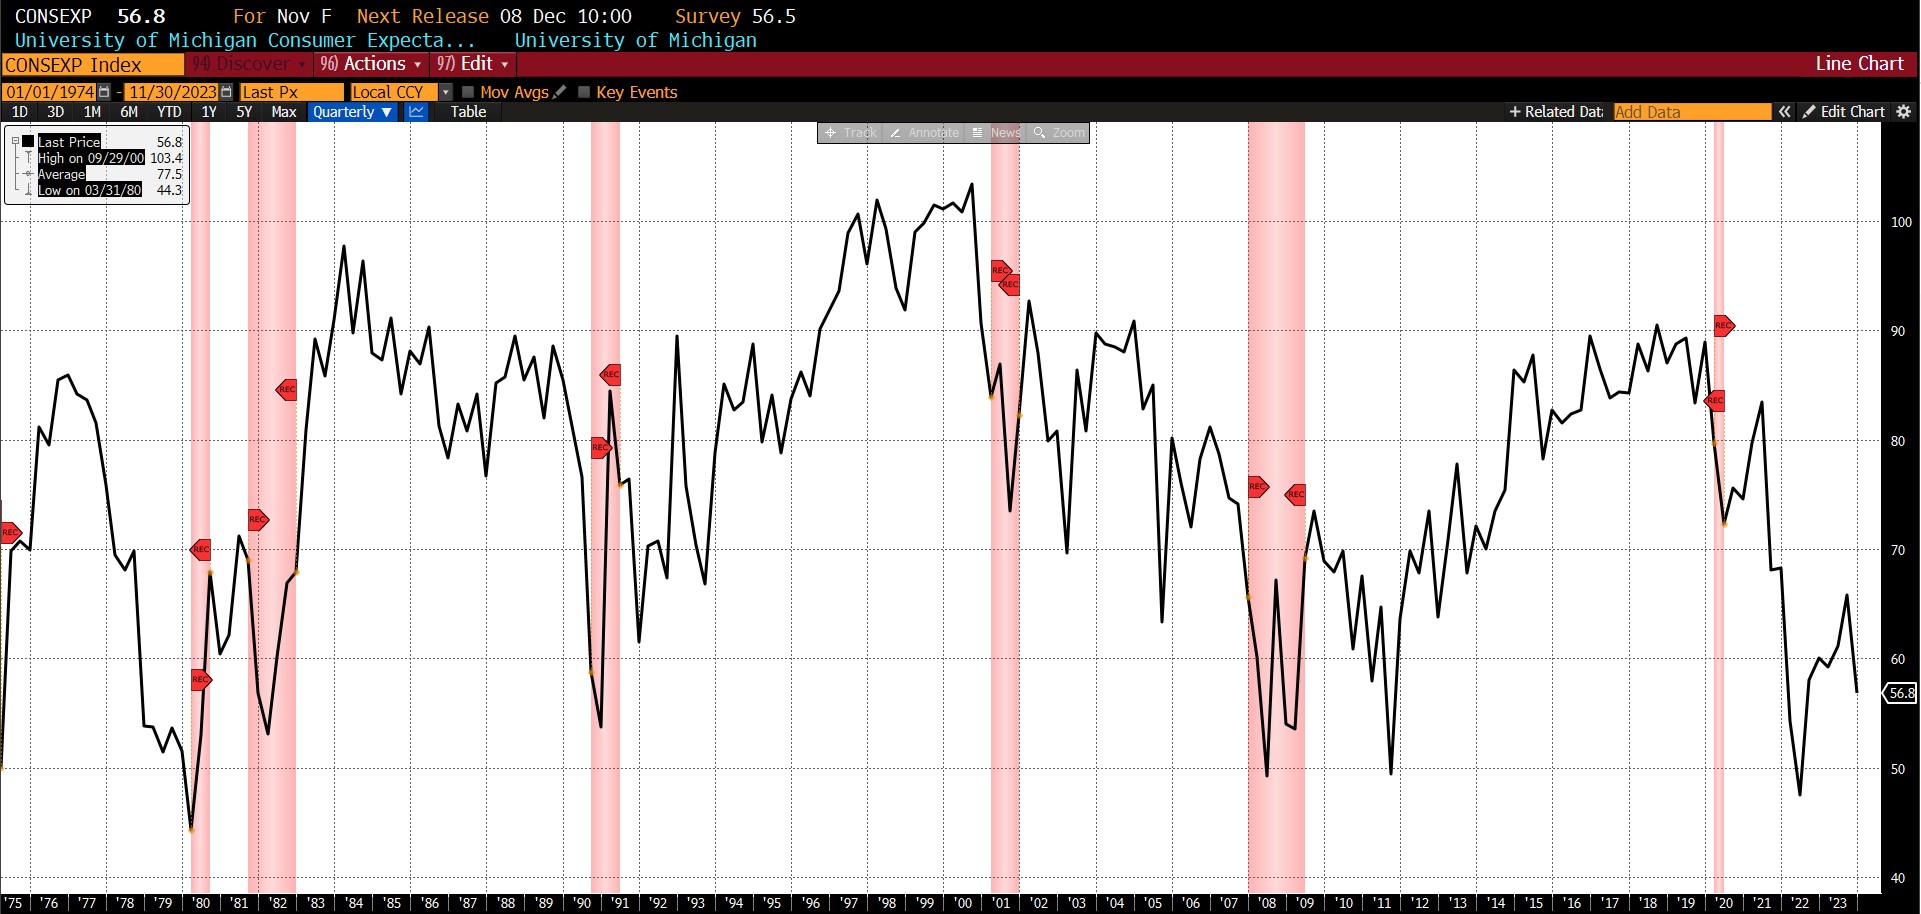
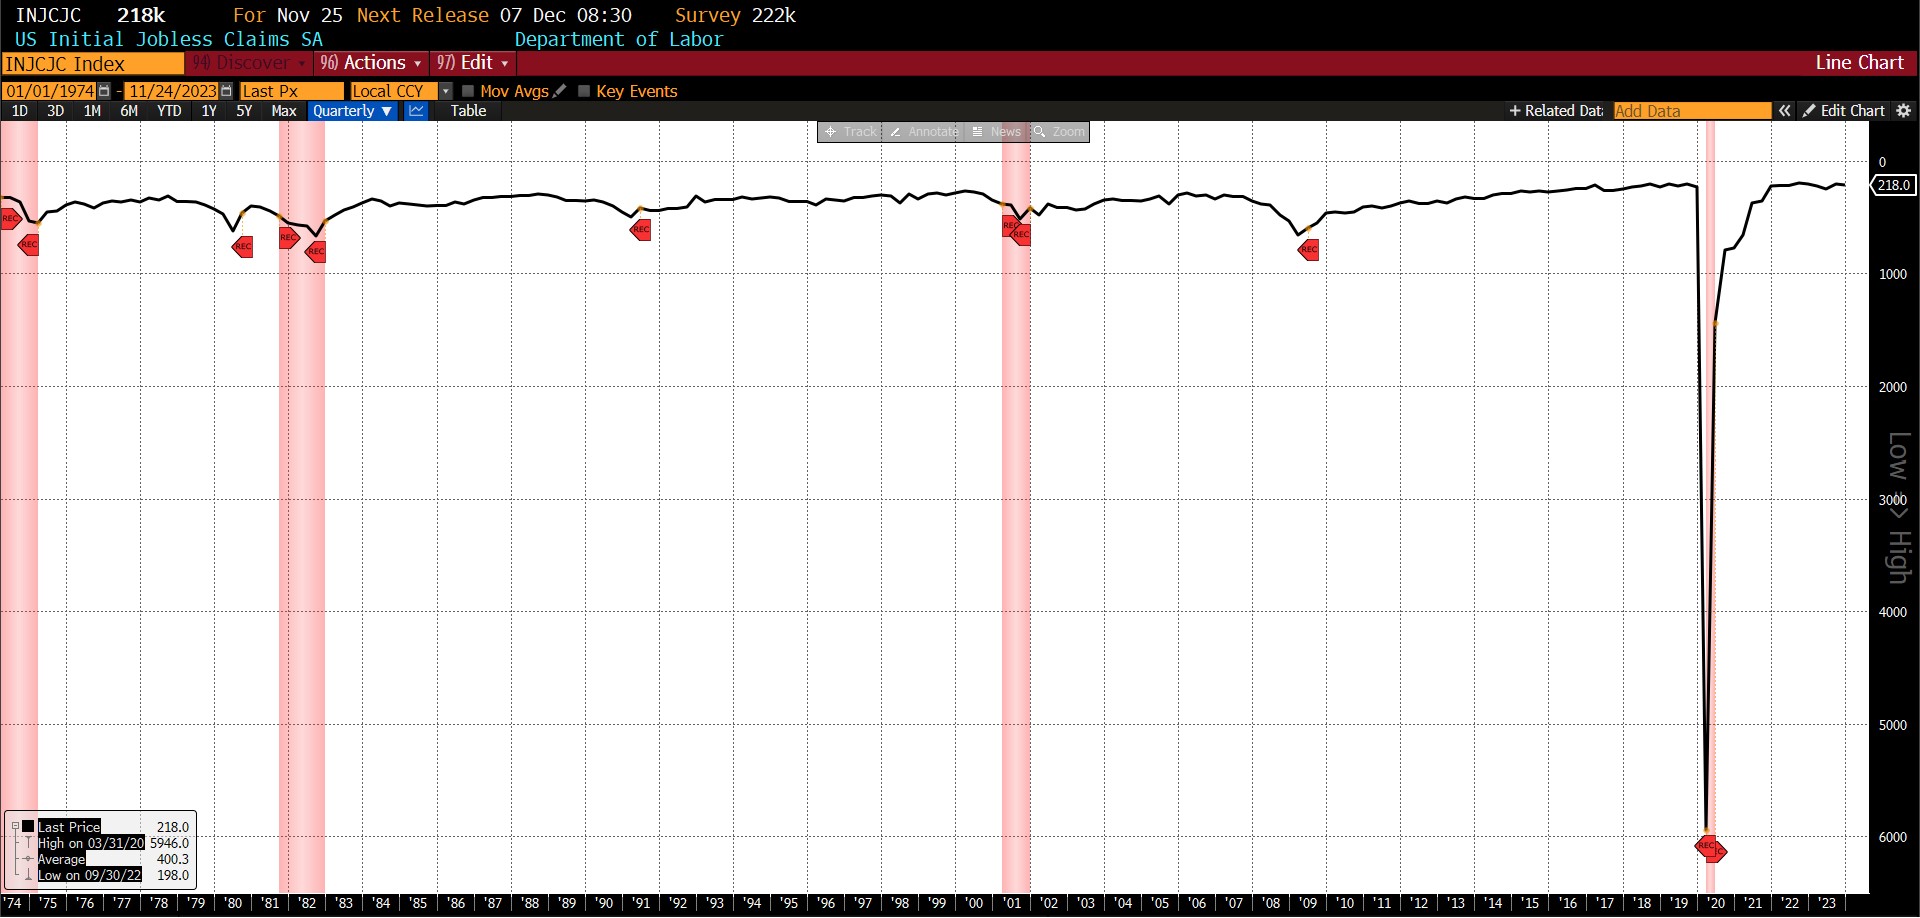
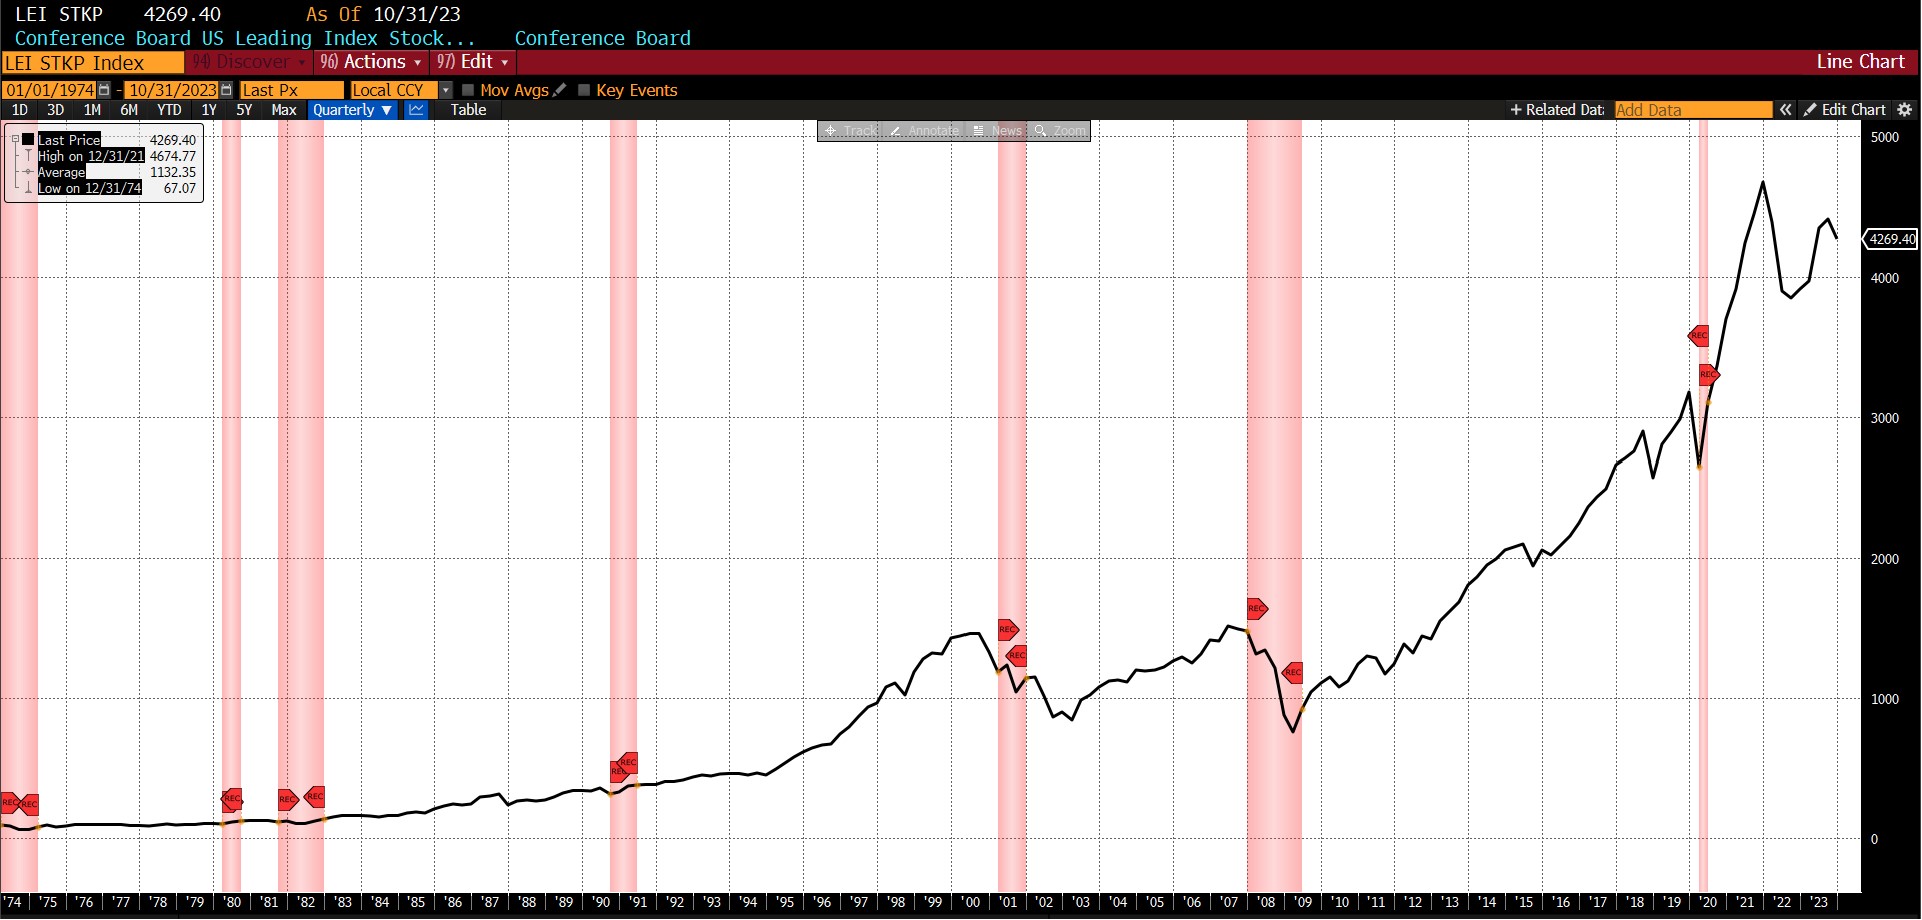
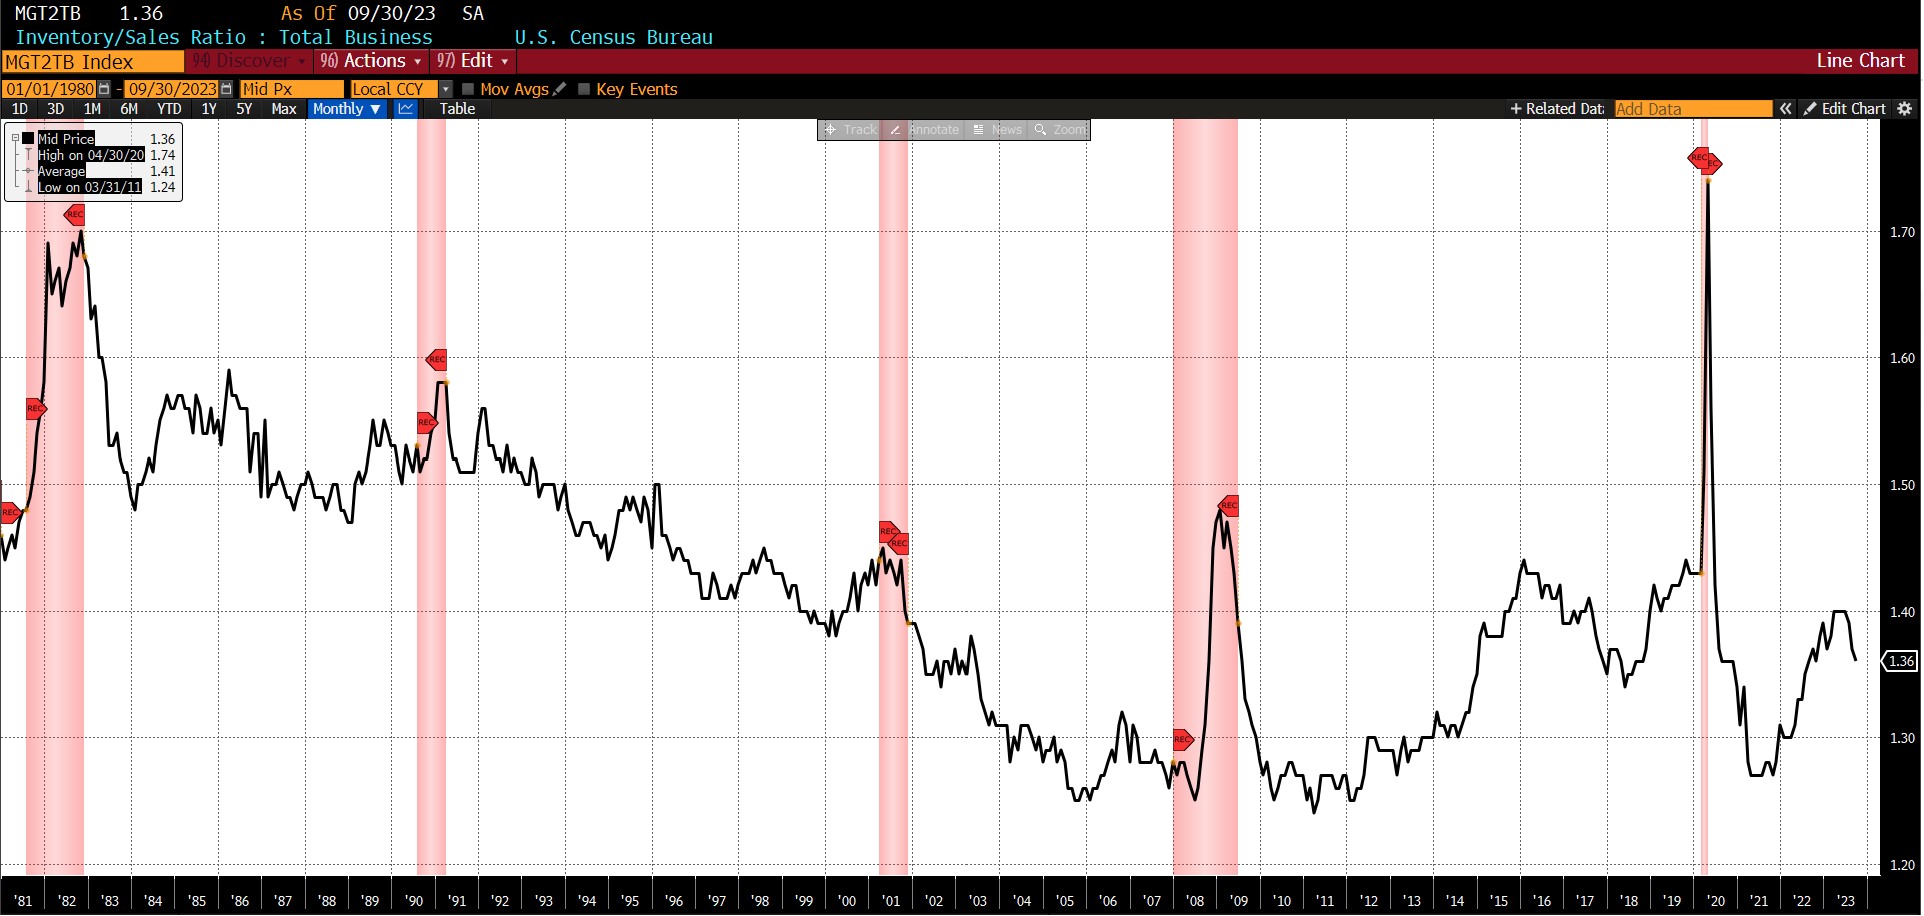
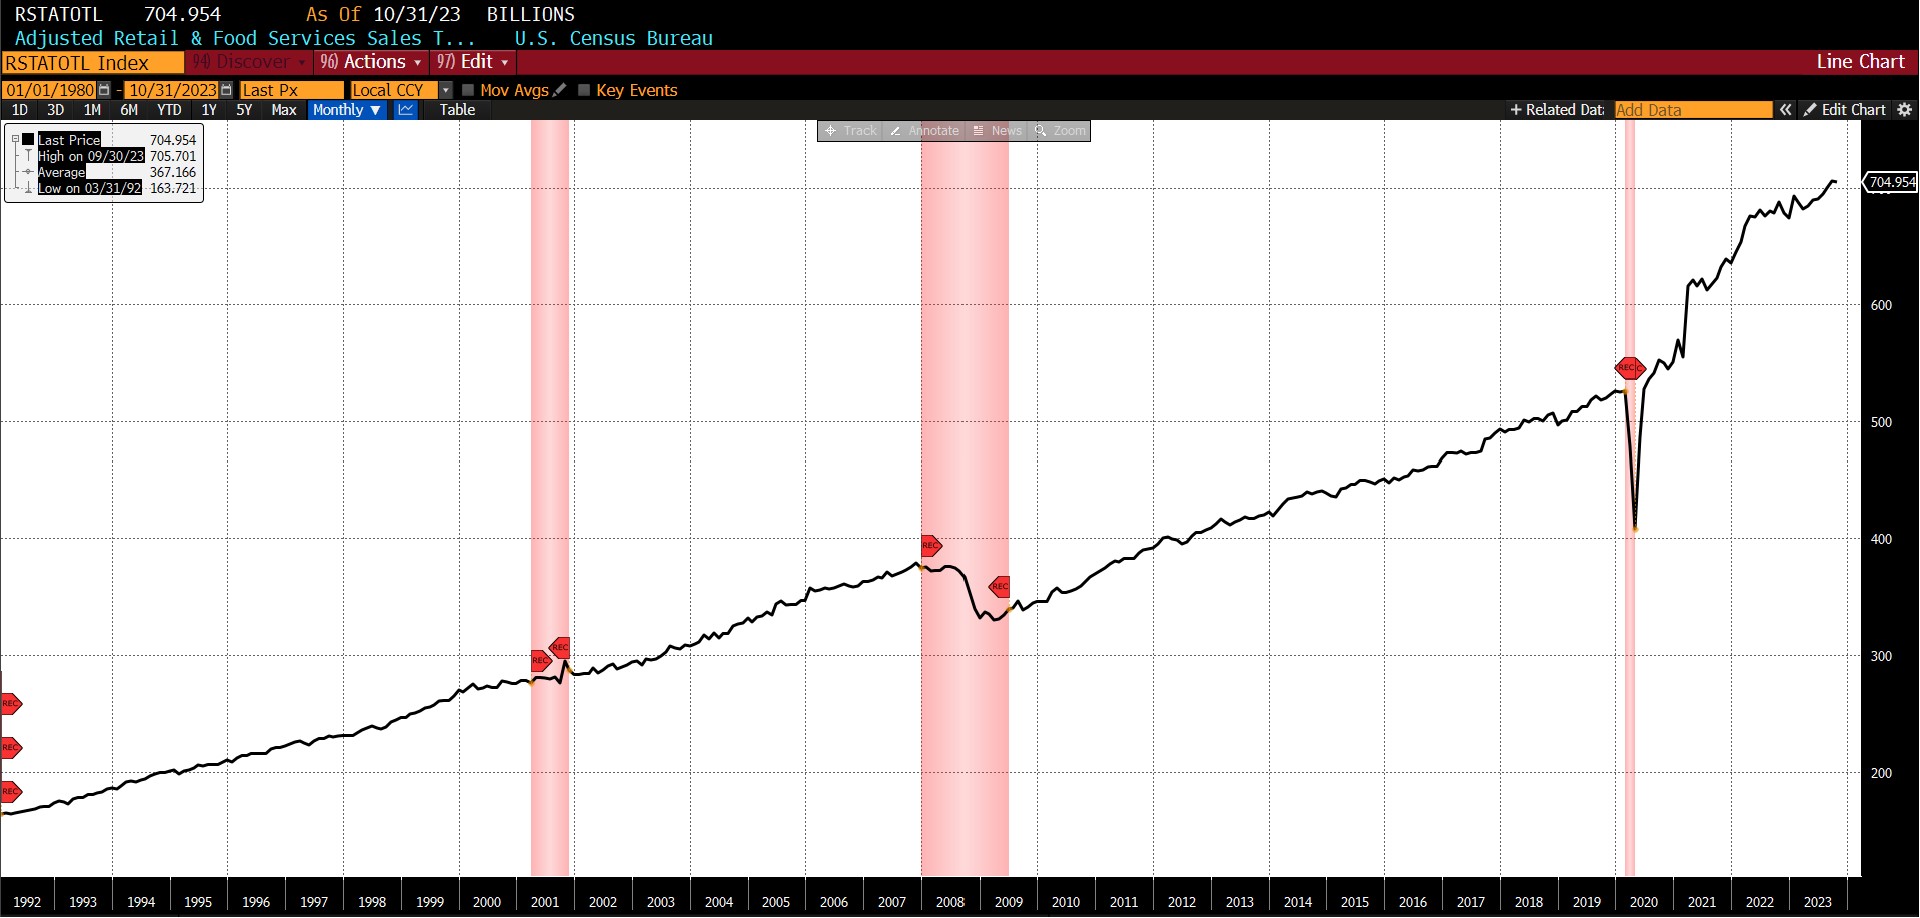
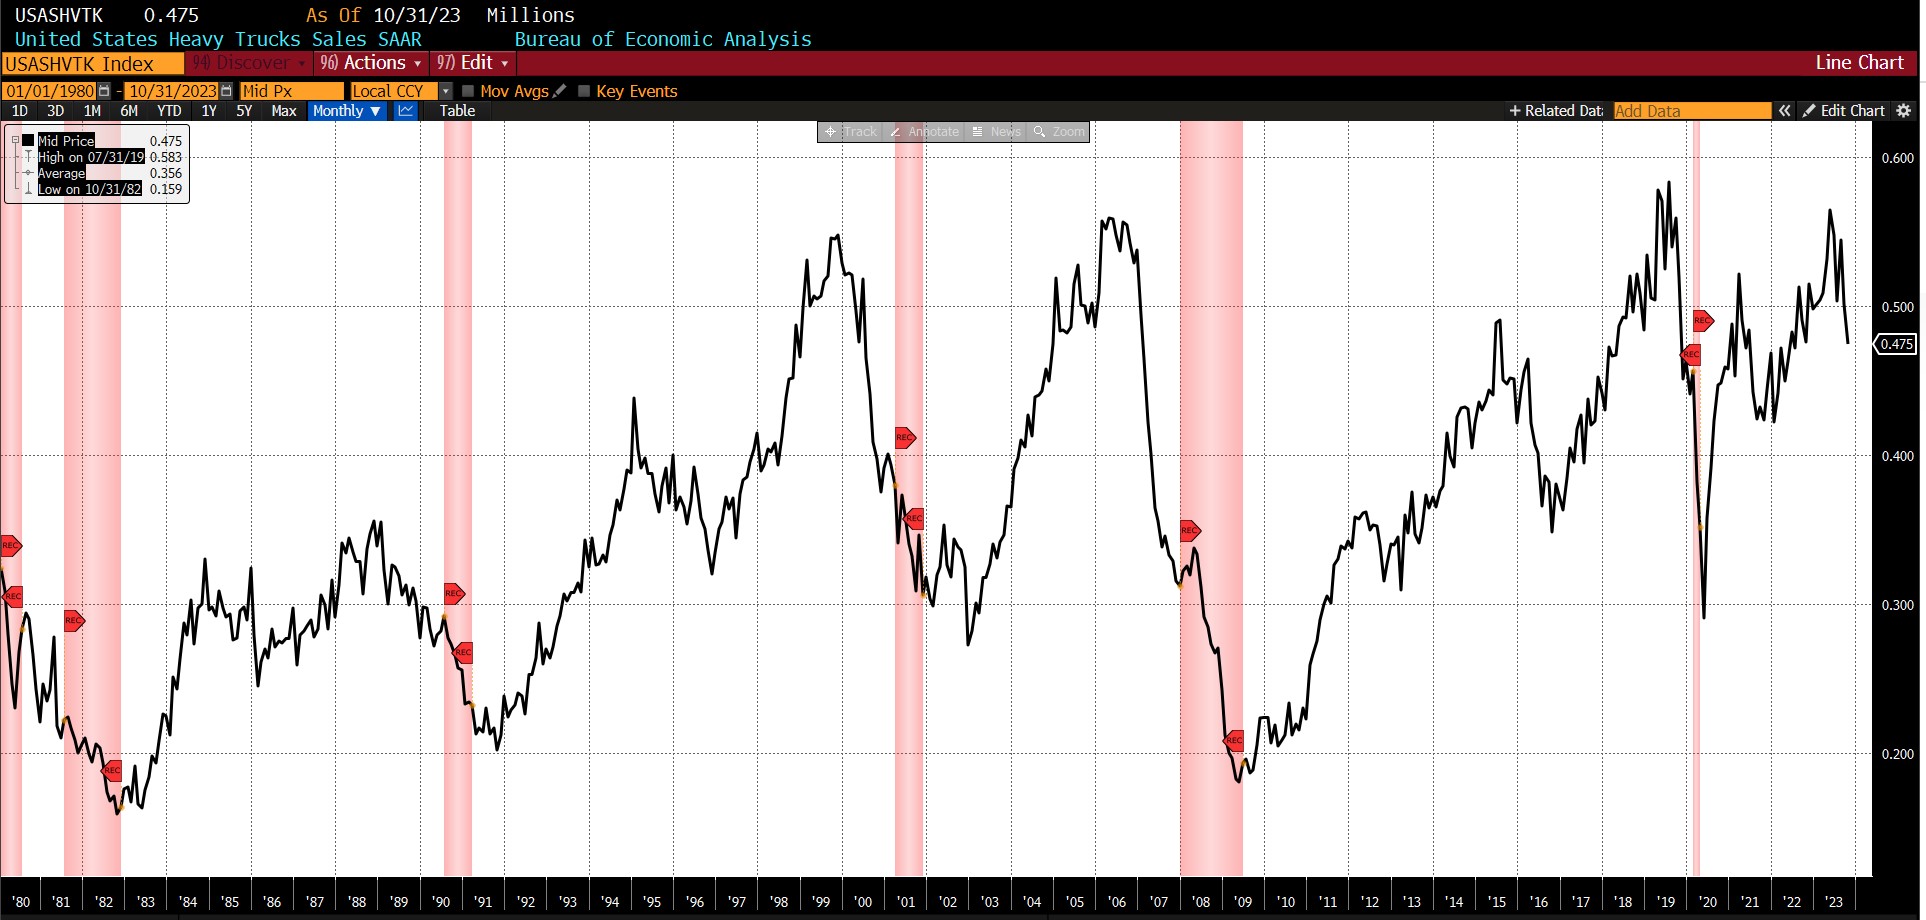
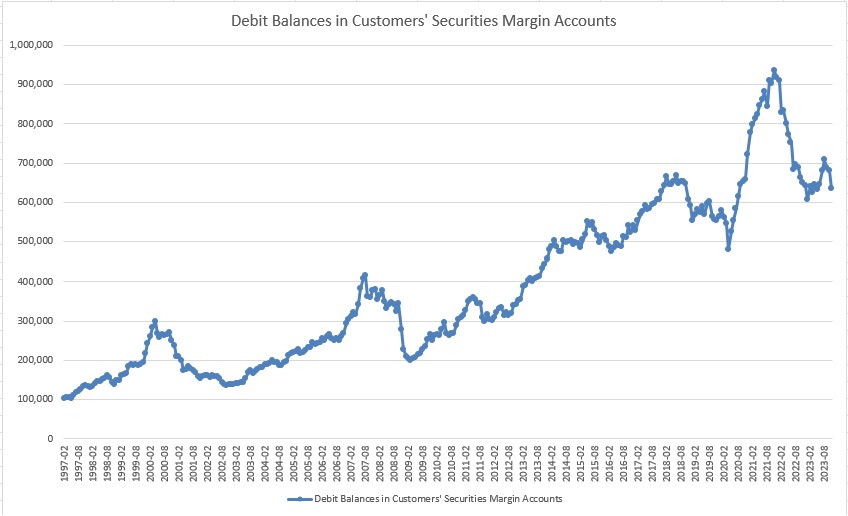
Declining were the University of Michigan Consumer Expectations Index (-9.9 percent), FINRA’s Debt Balances in Customers’ Securities Margin Accounts (-6.8 percent), US Average Weekly Hours All Employees Manufacturing (-0.3 percent), Inventory/Sales Ratio: Total Business (-0.3 percent), United States Heavy Trucks Sales (-5.2 percent), US Initial Jobless Claims (-0.7 percent), The Conference Board US Leading Index of Stock Prices (-3.1 percent), and Adjusted Retail & Food Services Sales (-0.10 percent).
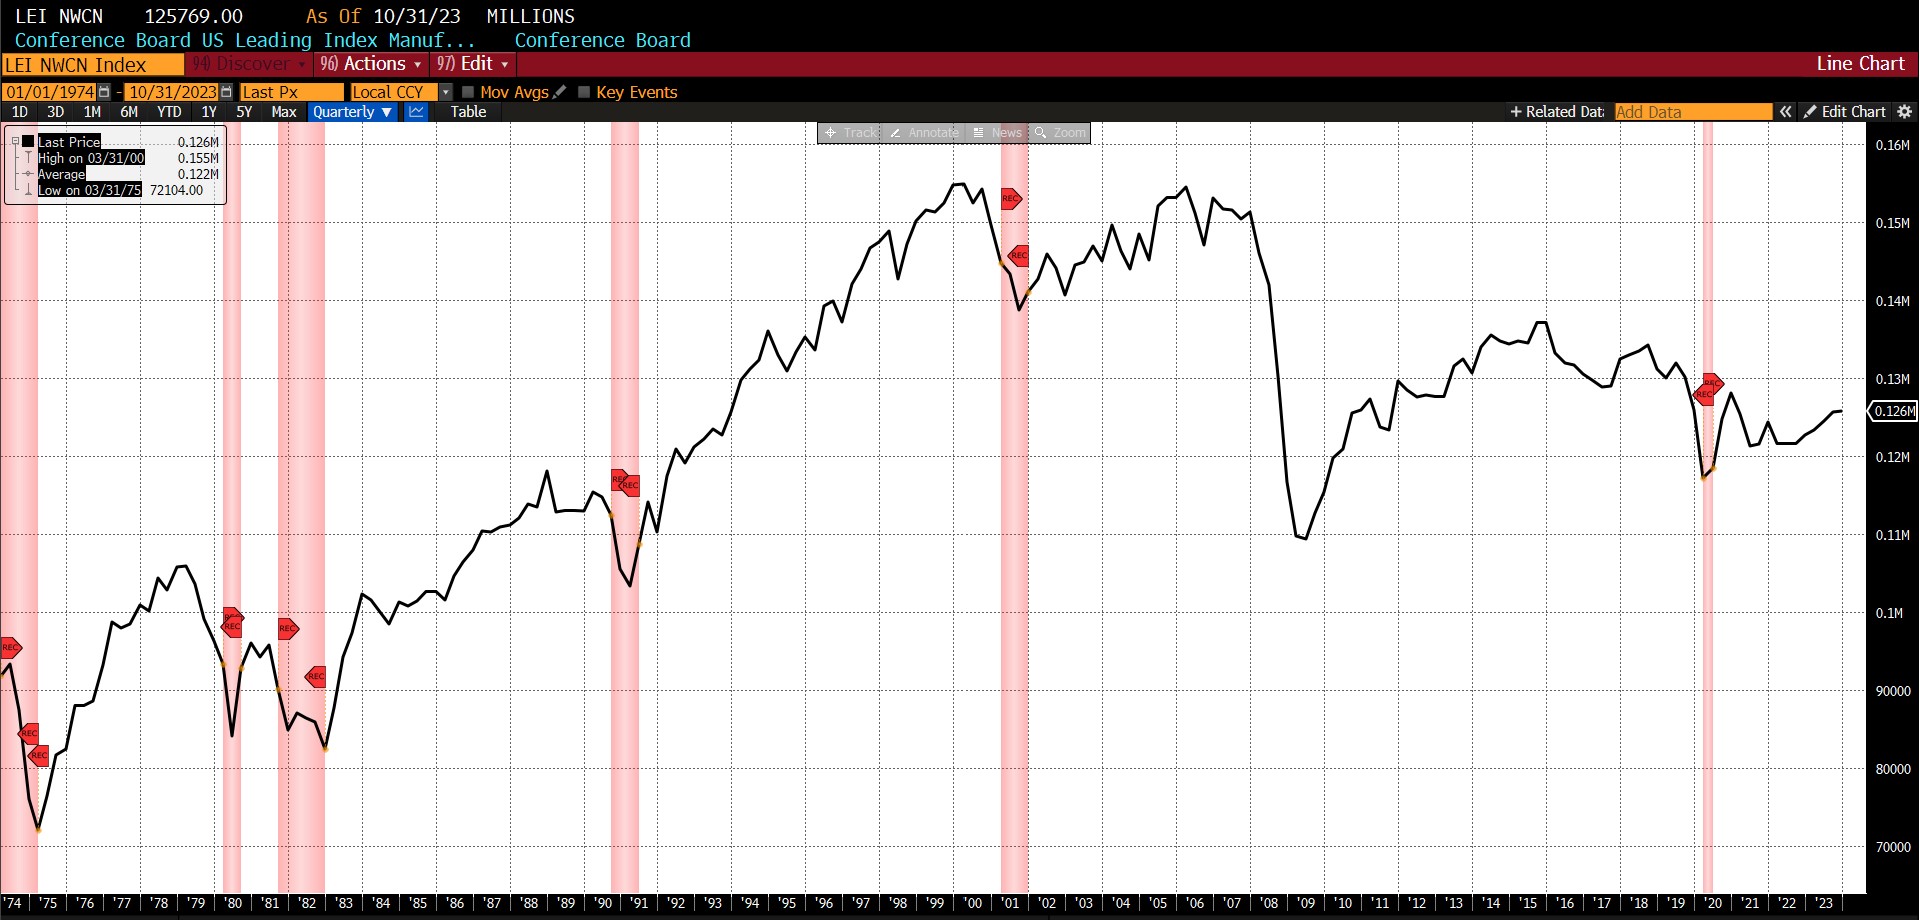
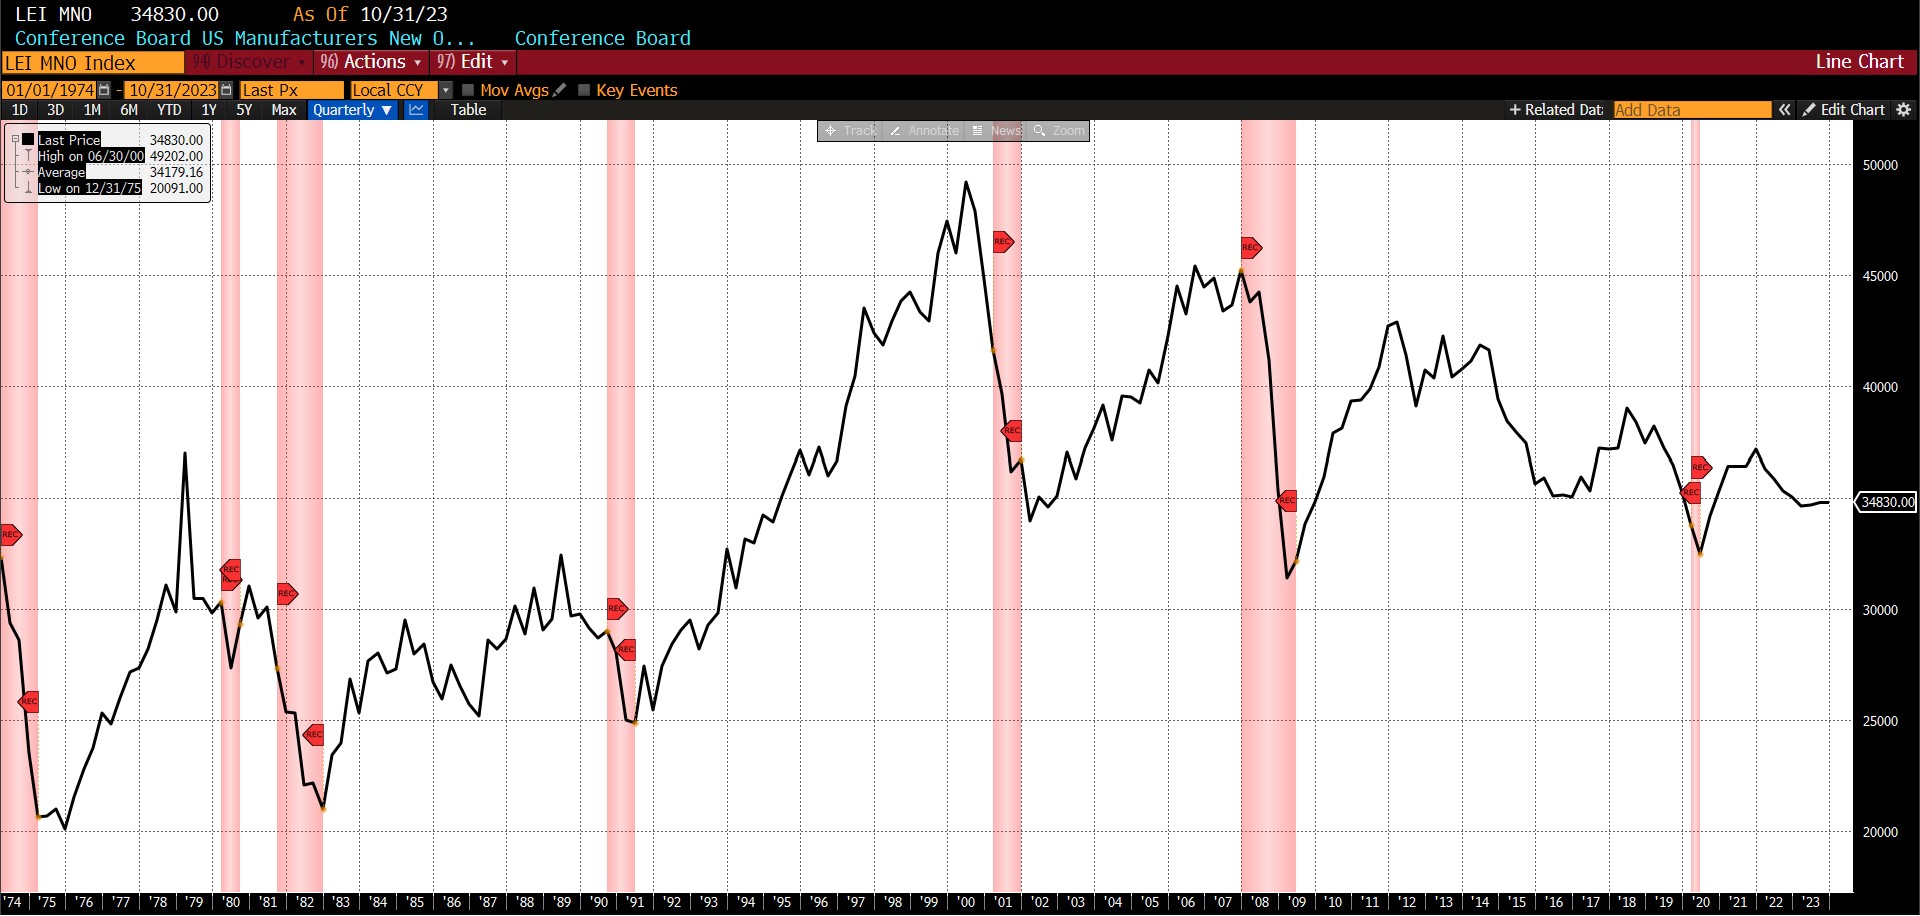
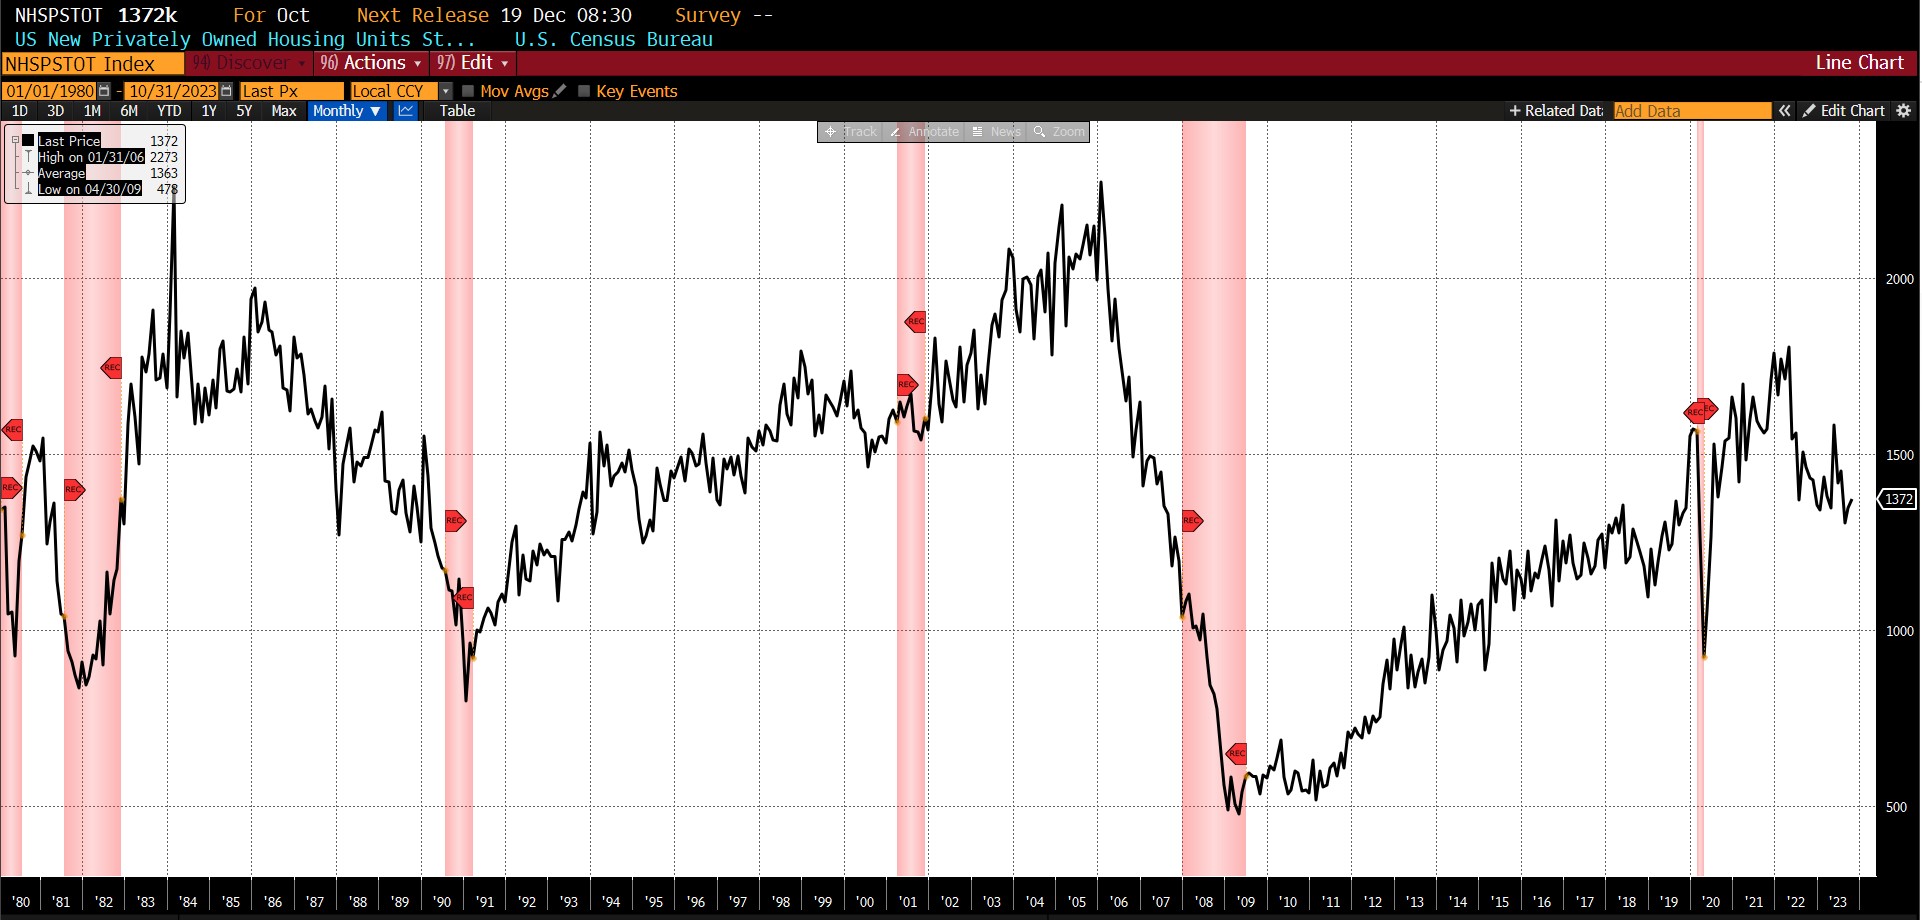
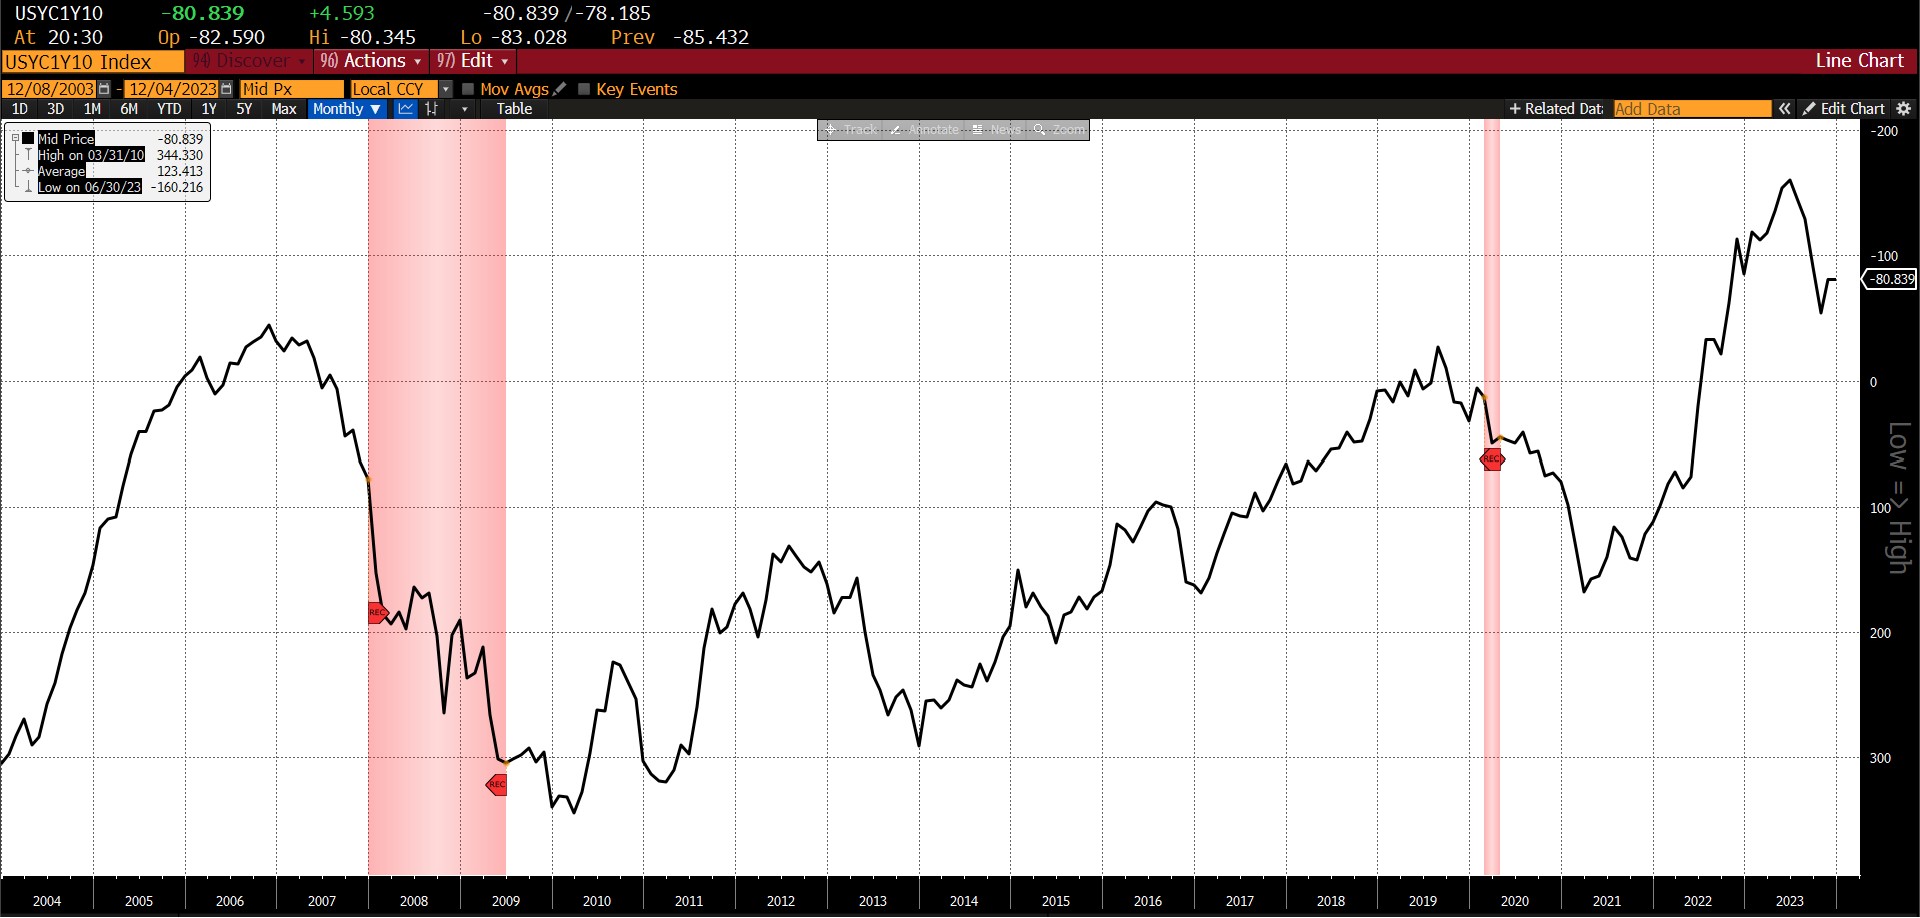
Rising from September to October were the US New Privately Owned Housing Units Started by Structure (1.9 percent), the 1-to-10 year US Treasury spread (40.8 percent), and the Conference Board US Leading Index Manuf New Orders Consumer Goods & Materials (0.1 percent). The Conference Board US Manufacturers New Orders Nondefense Capital Good Ex Aircraft index was unchanged.
The drop from 54 to 29 was the second largest month-to-month decline since May 2020, and brings the AIER Leading Indicator to levels it last saw between July and December 2022 when the US entered a brief (and disputable) recession.
Roughly Coincident (50) and Lagging Indicators (50)
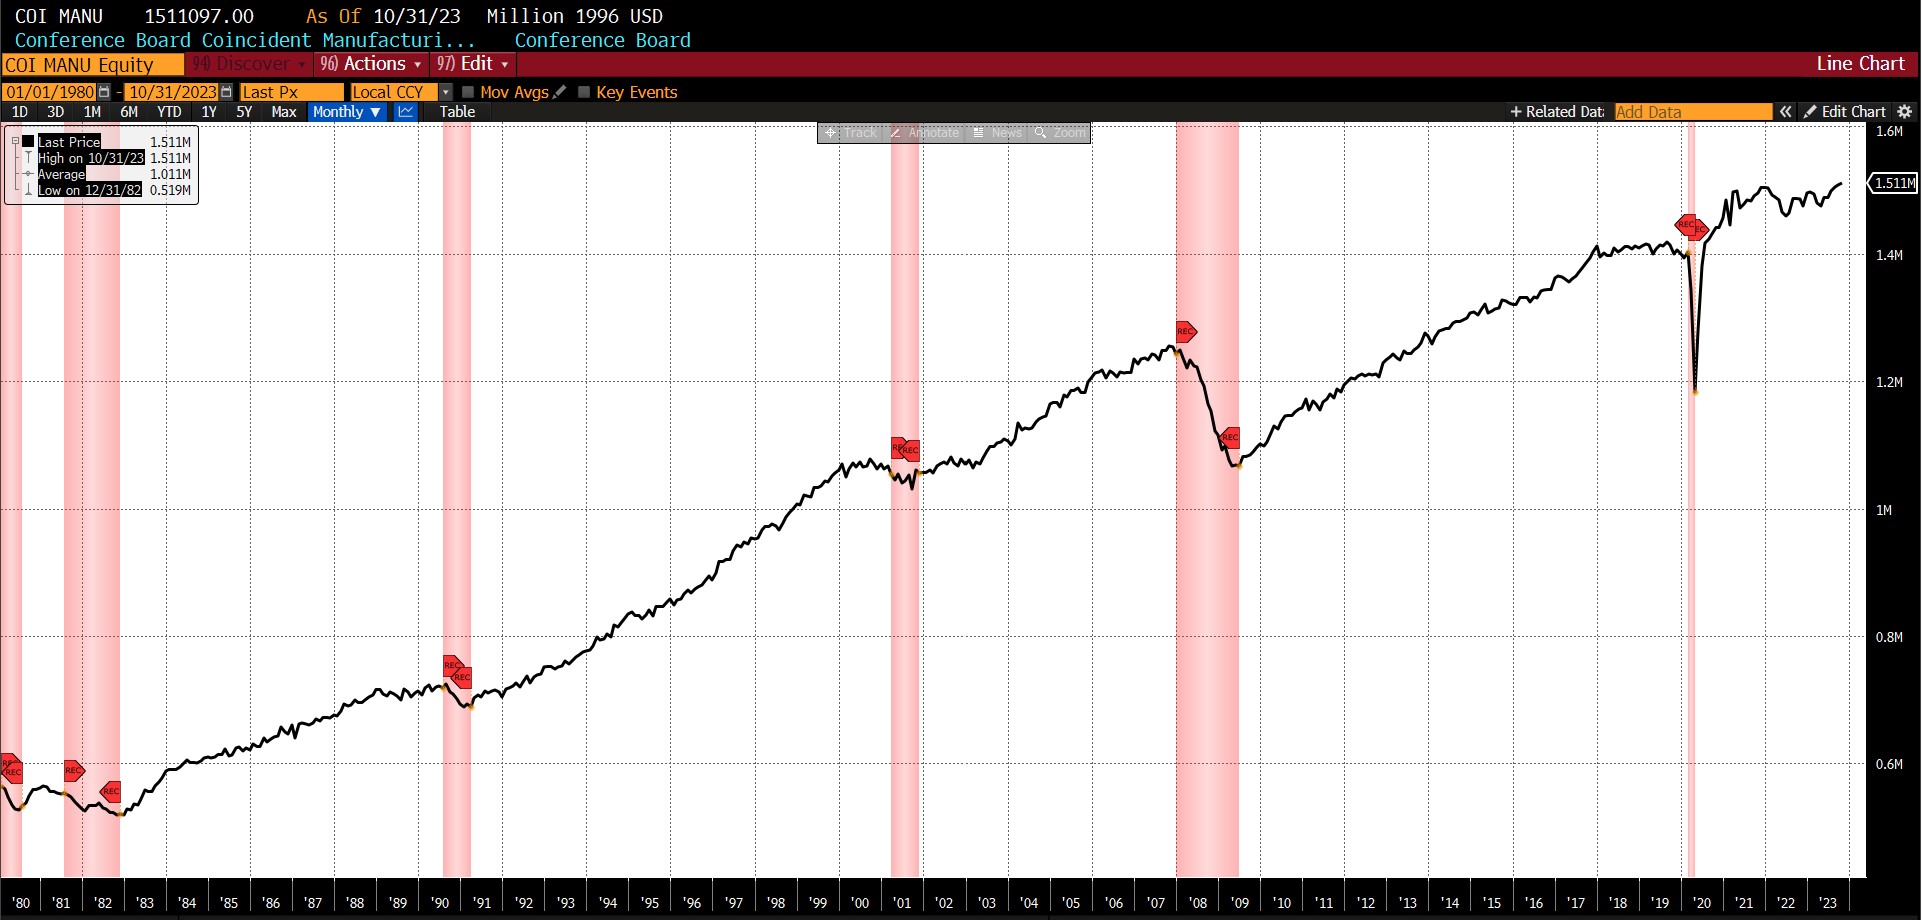
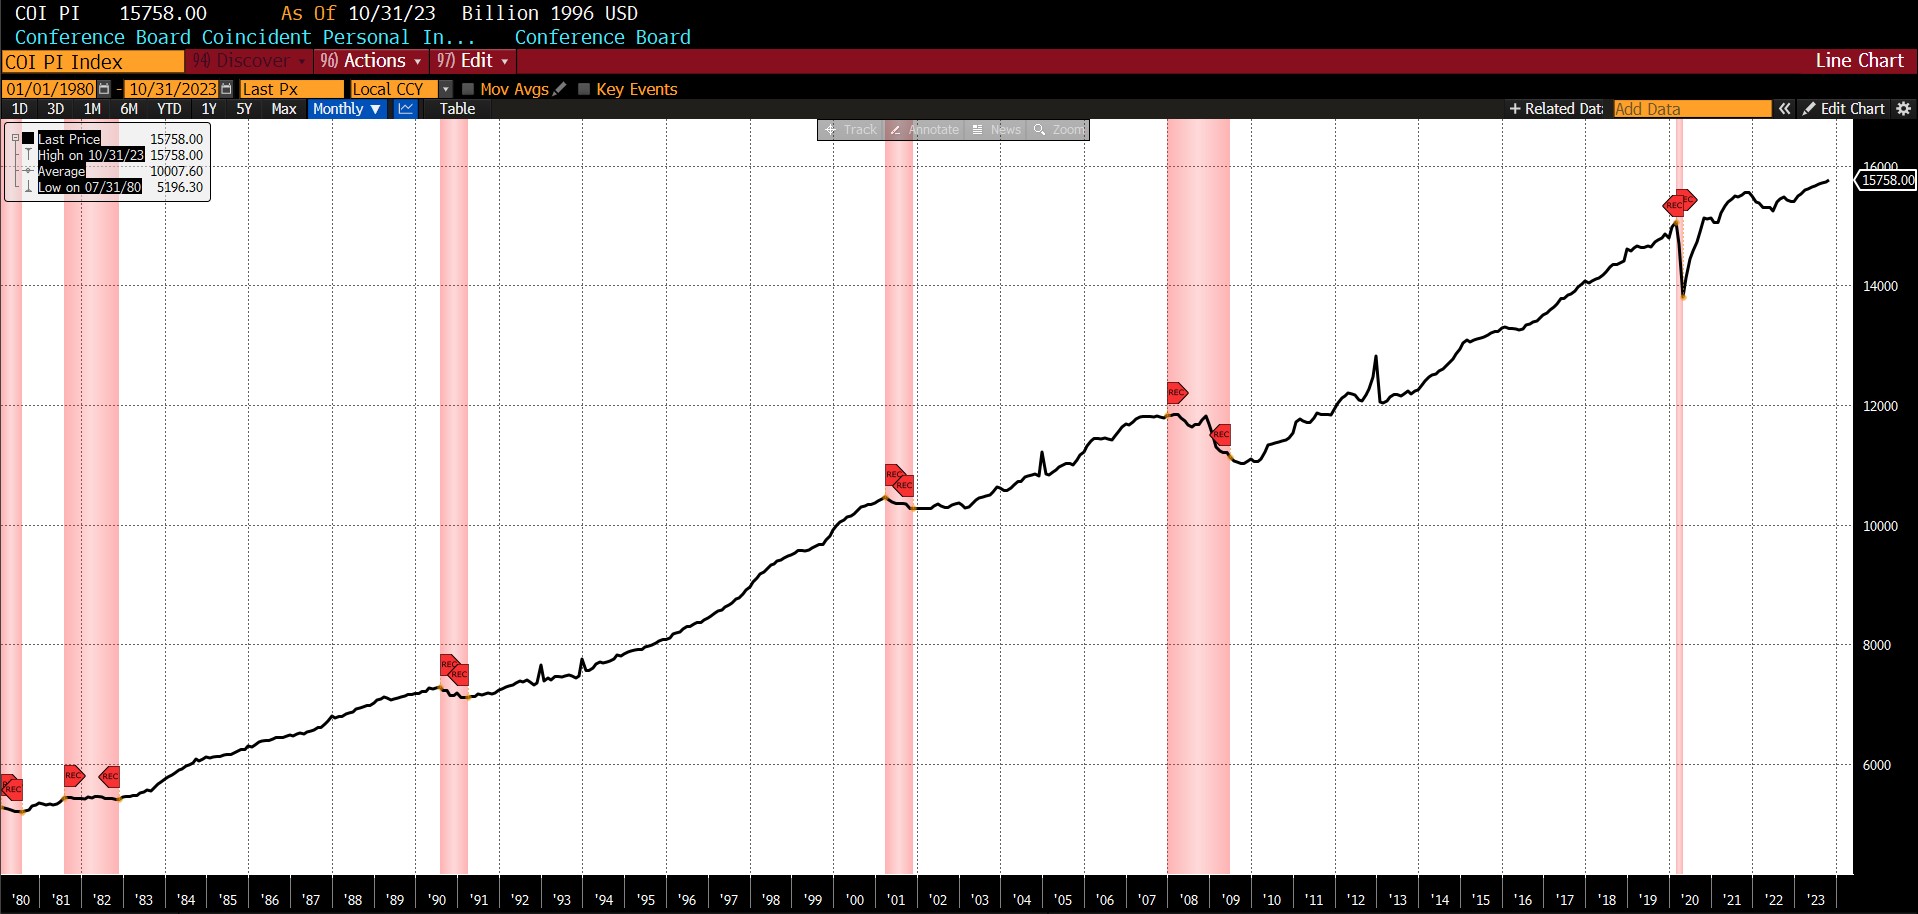
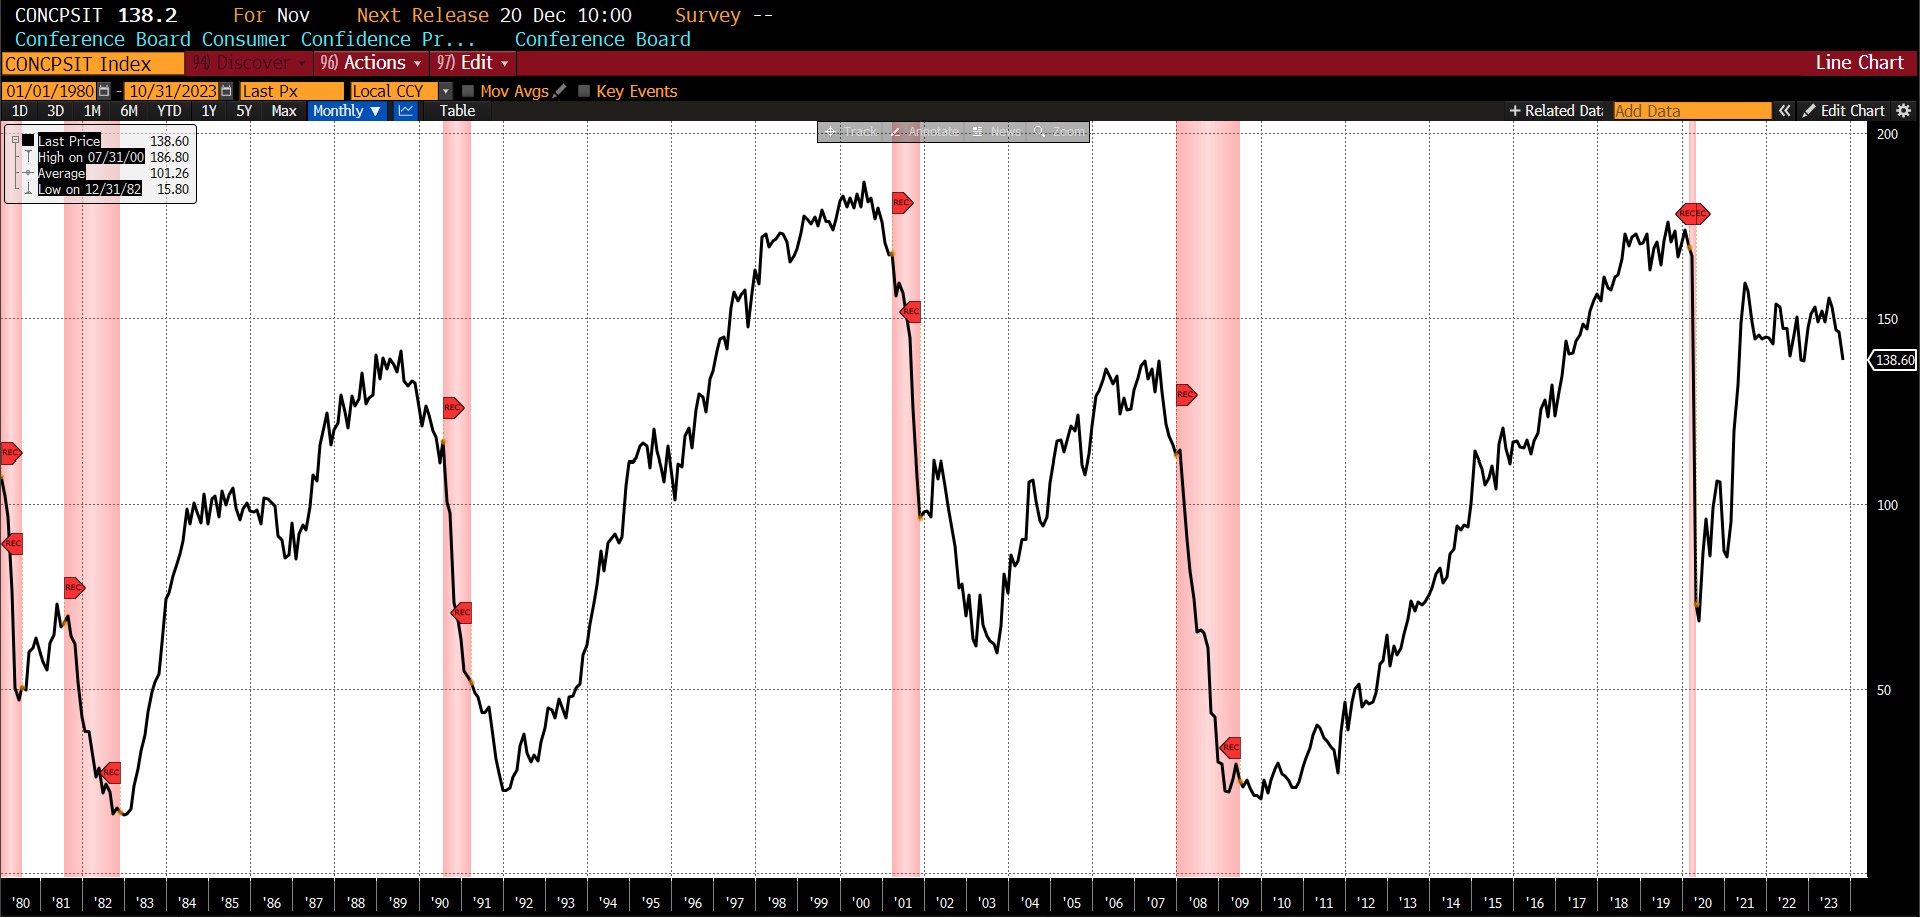
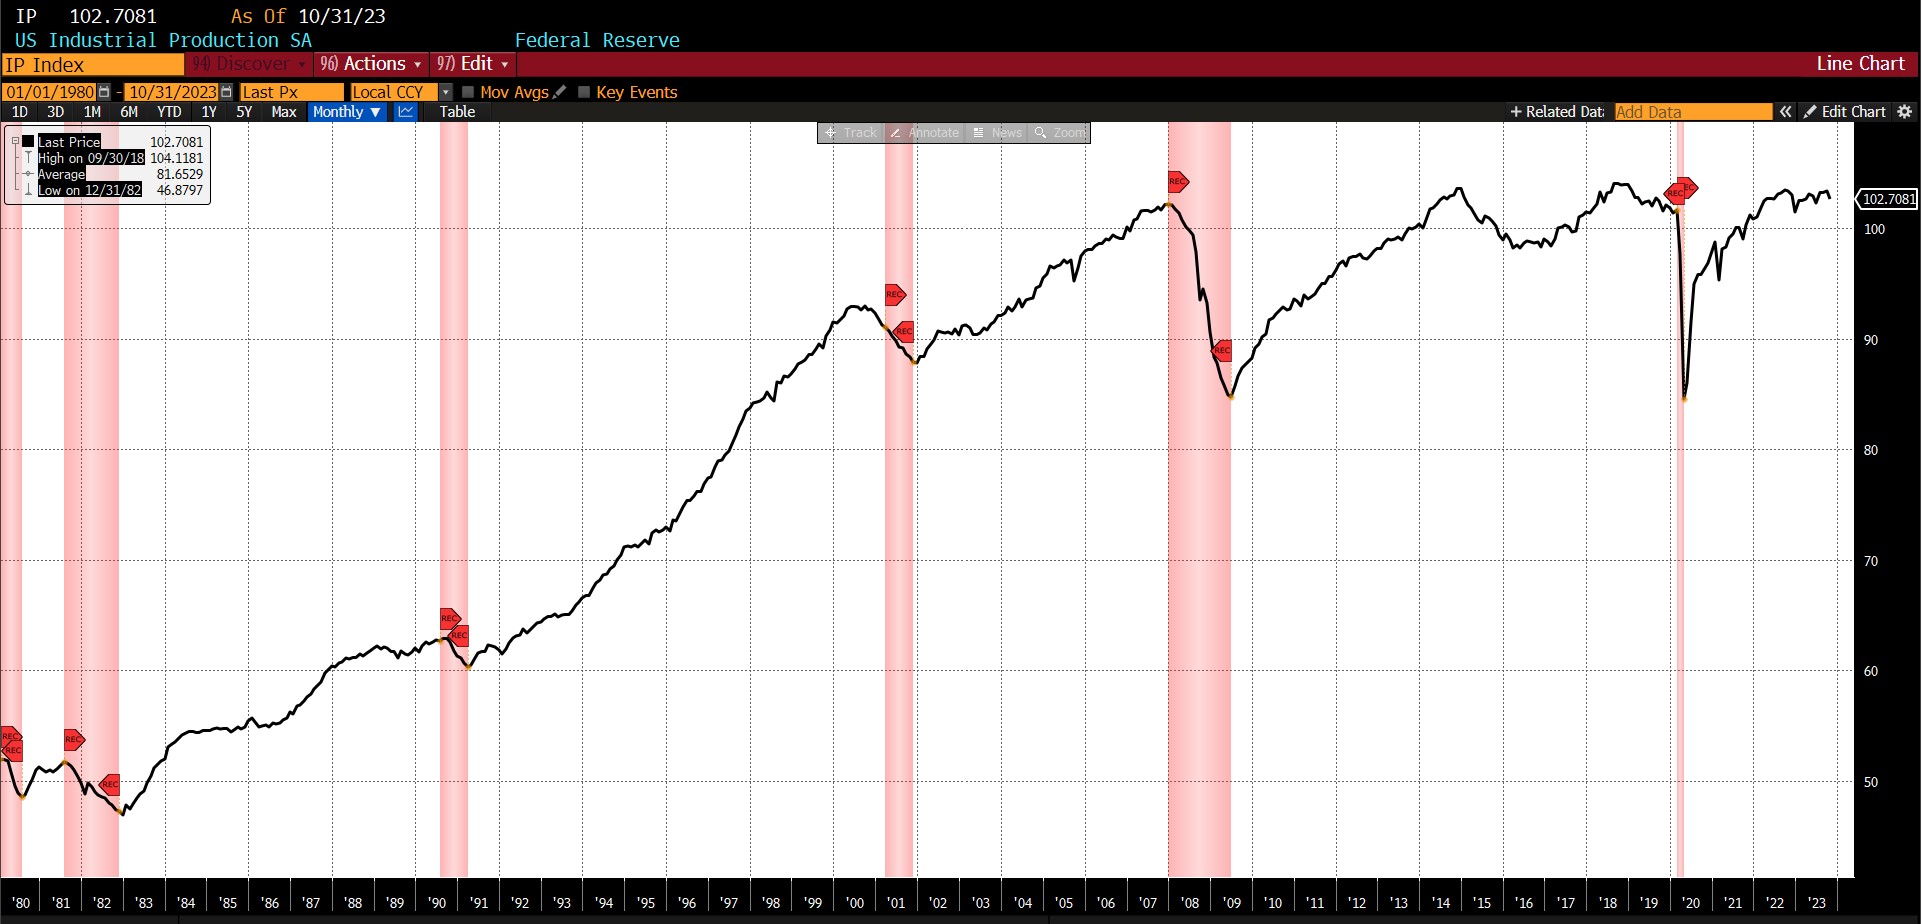
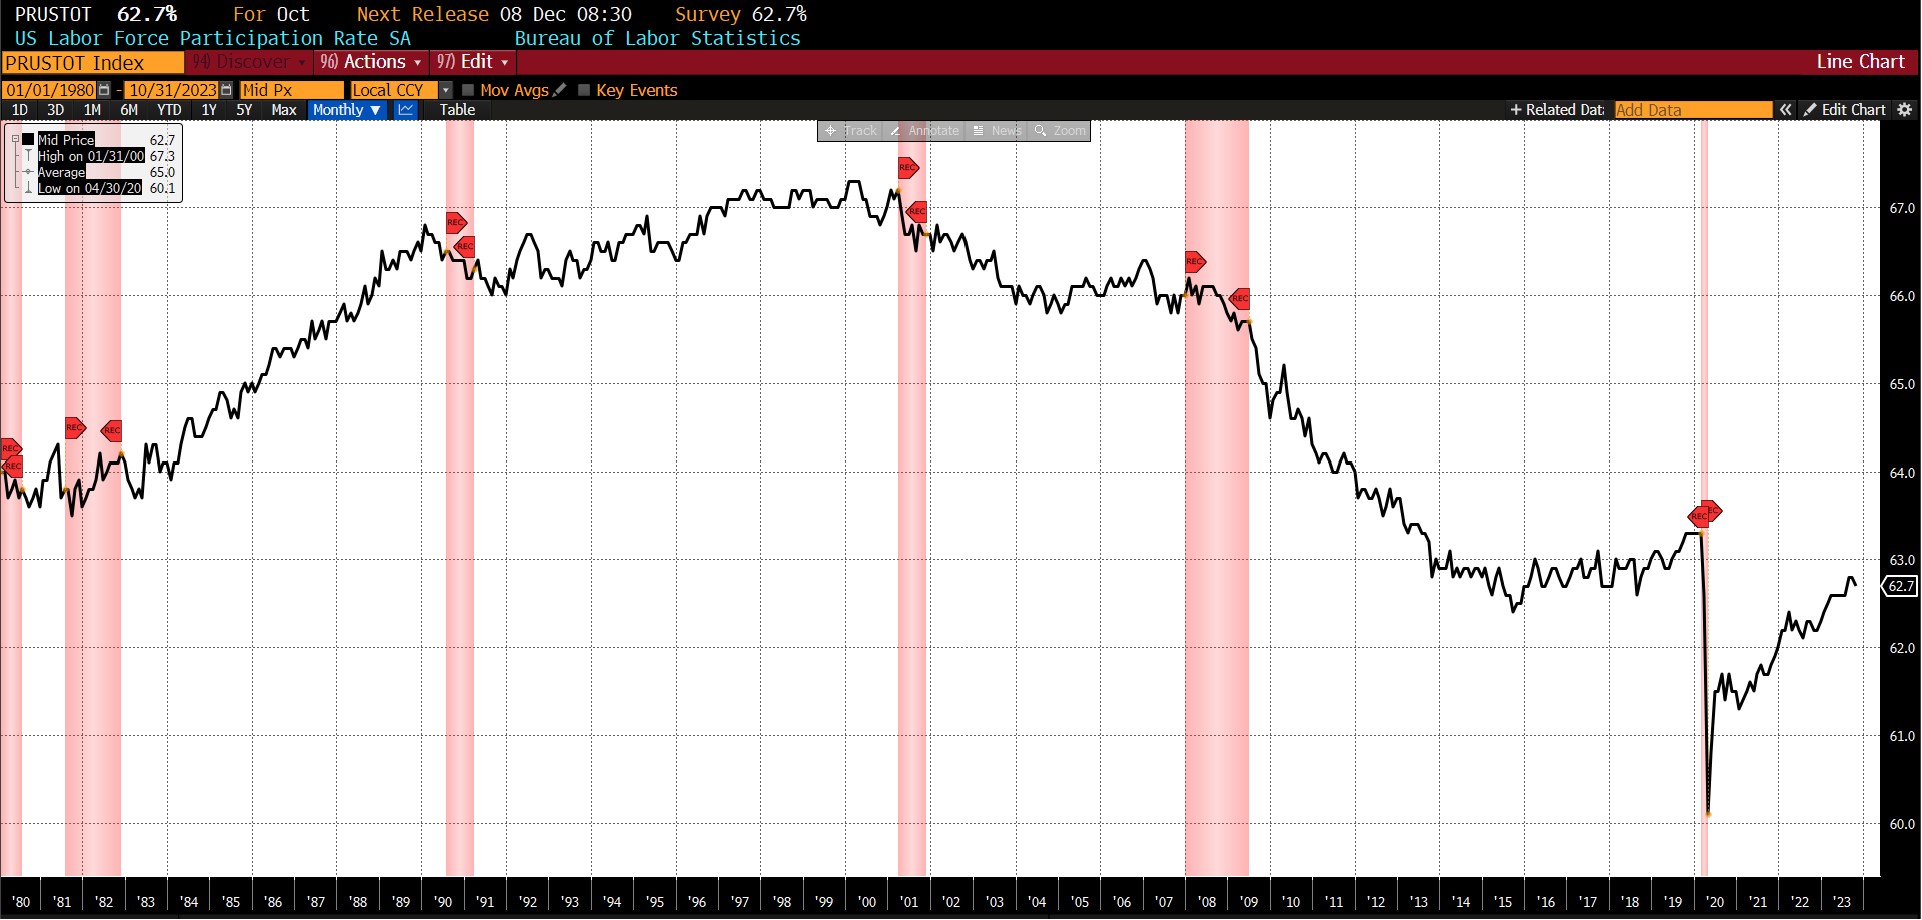
Among the constituents of the Roughly Coincident Indicator, declines occurred in the Conference Board Consumer Confidence Present Situation (-5.2 percent), US Industrial Production (-0.6 percent), and in the US Labor Force Participation Rate (-0.2 percent). Total US Employees on Nonfarm Payrolls rose by 0.1 percent, as did the Conference Board’s Coincident Manufacturing and Trade Sales (0.2 percent) and Coincident Personal Income Less Transfer Payments (0.2 percent) measures.
With the exception of a single reading of 50 in January 2023, the last time AIER’s Roughly Coincident Indicator reached and fell below the neutral level was between March and October 2020, inclusive.
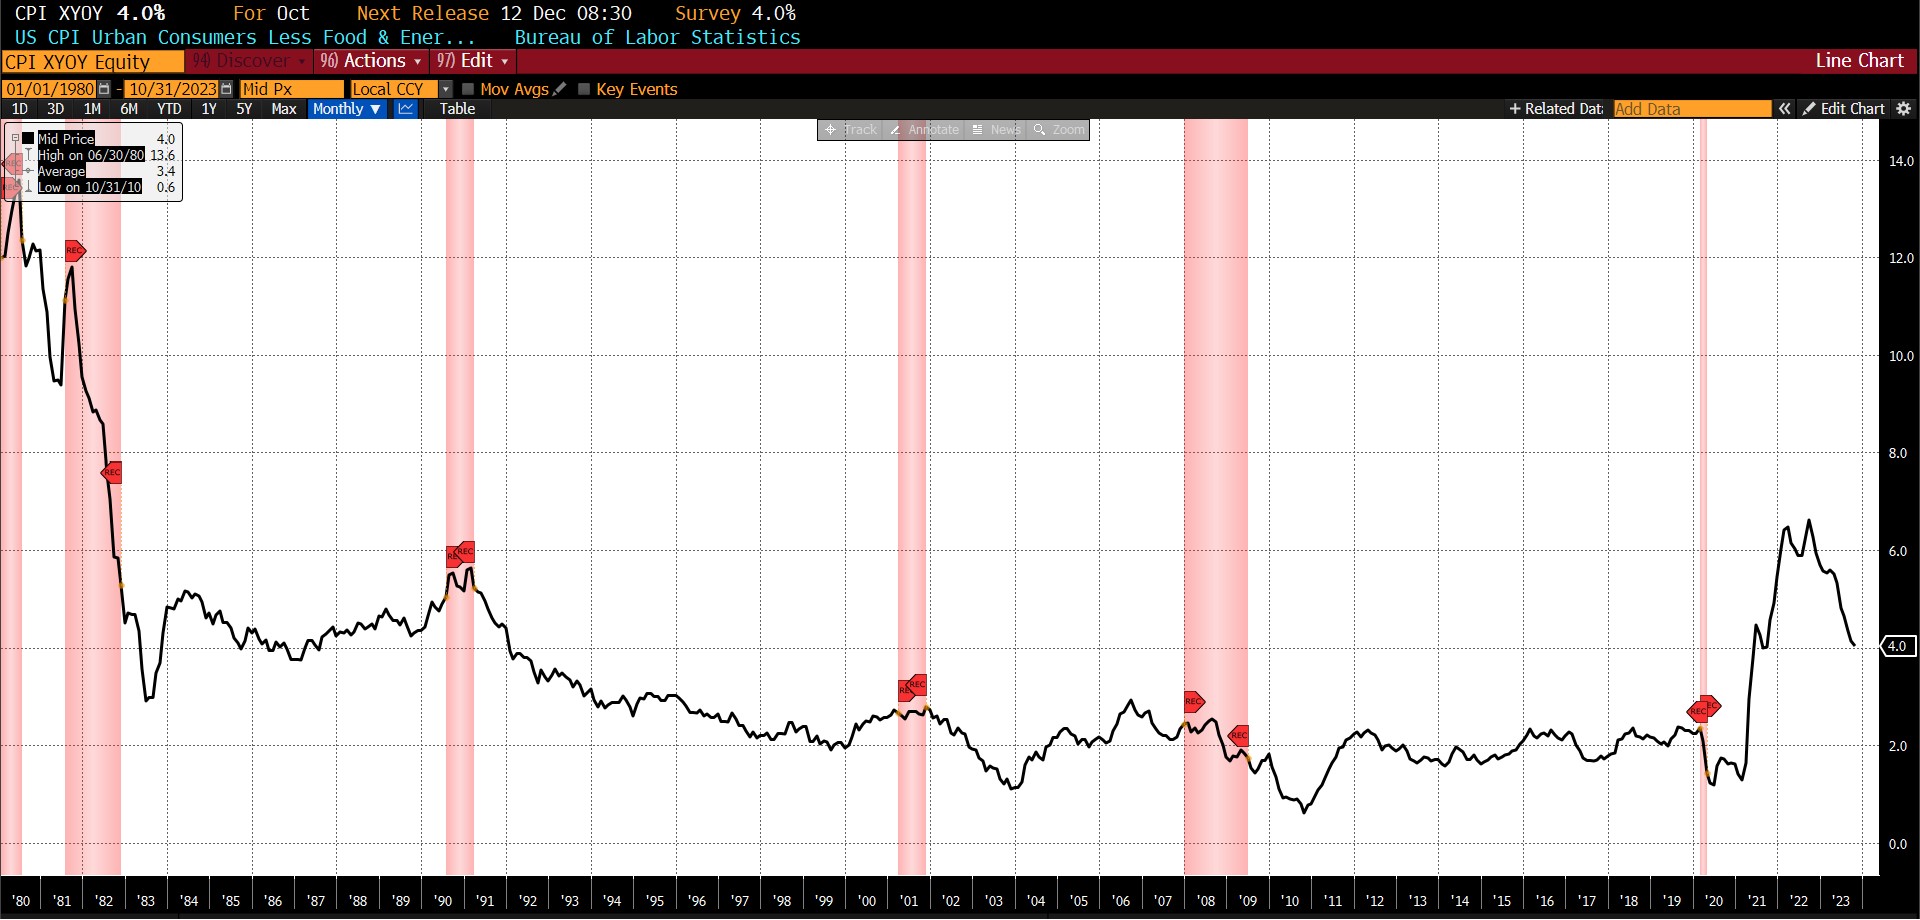
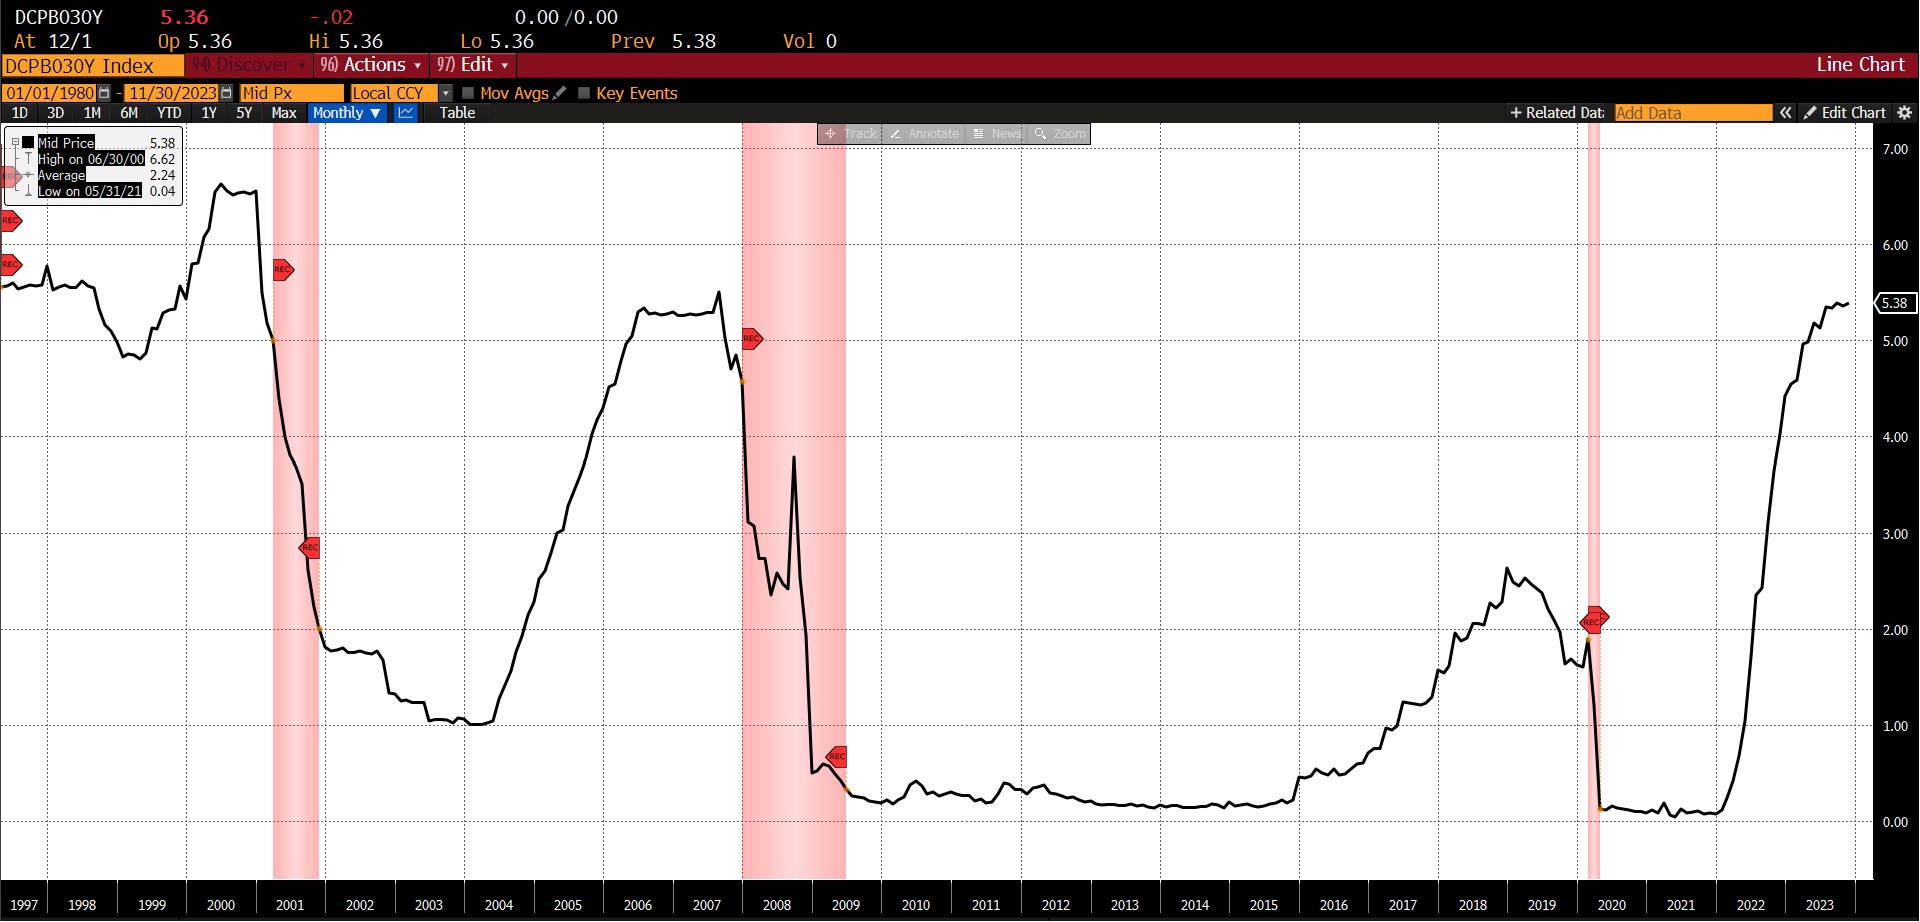
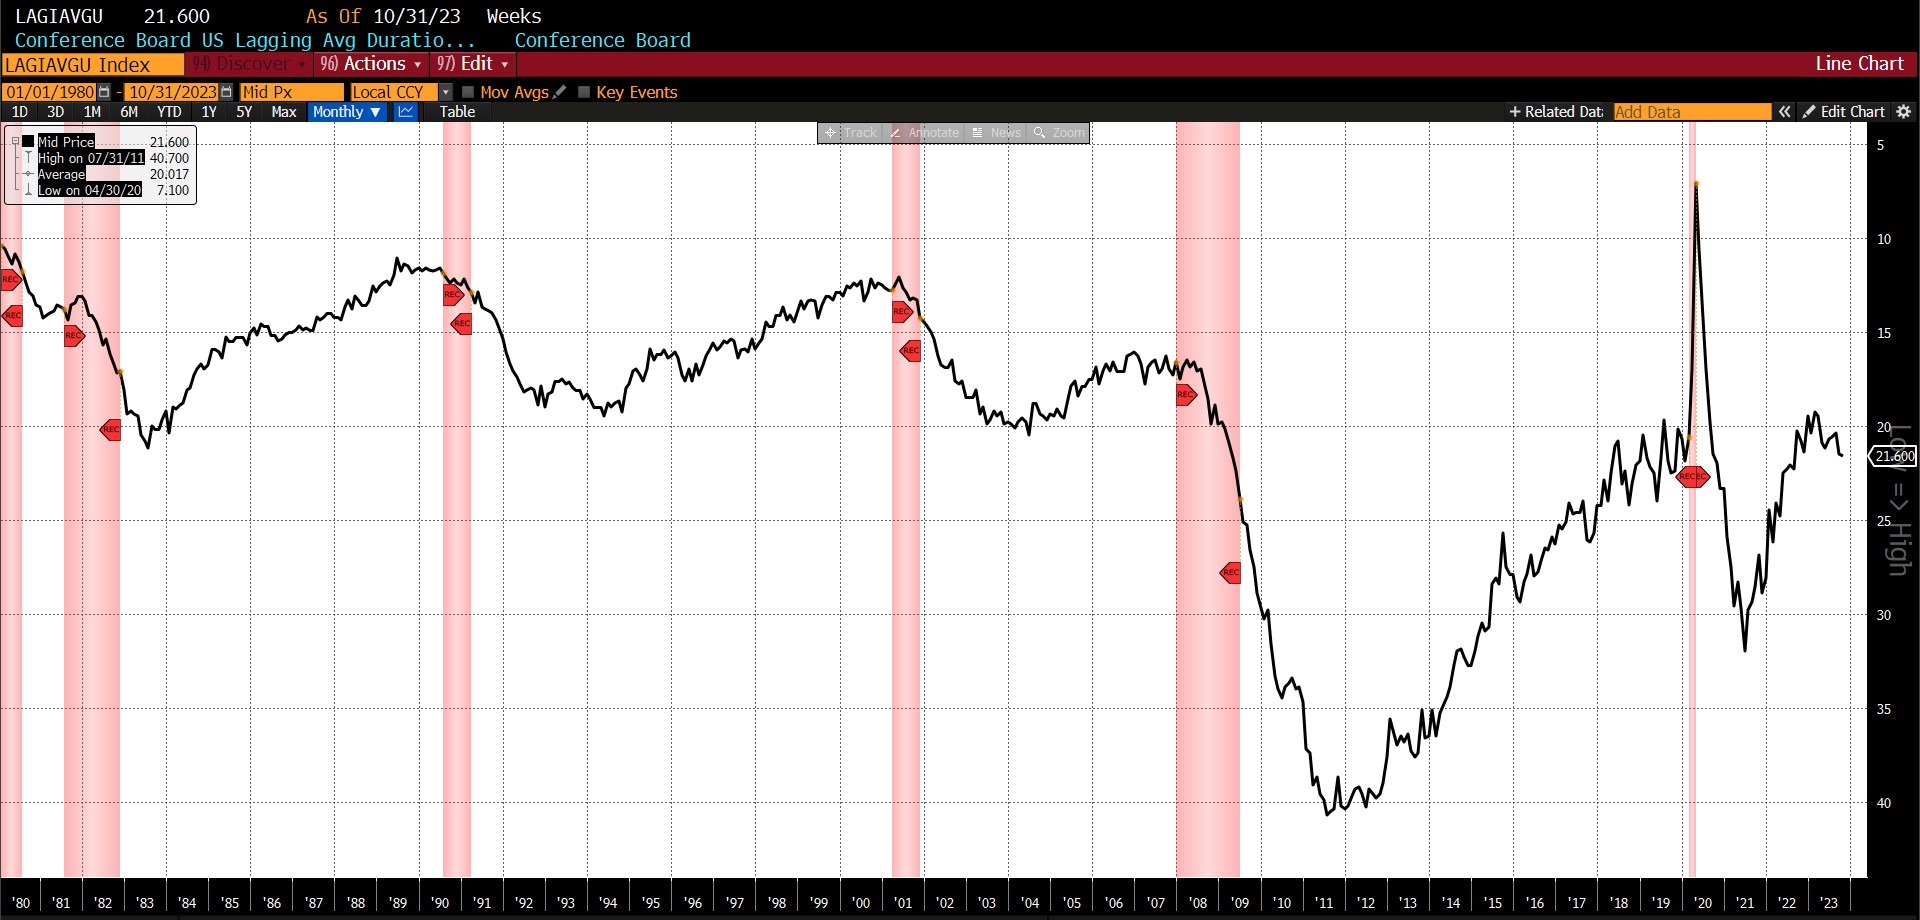
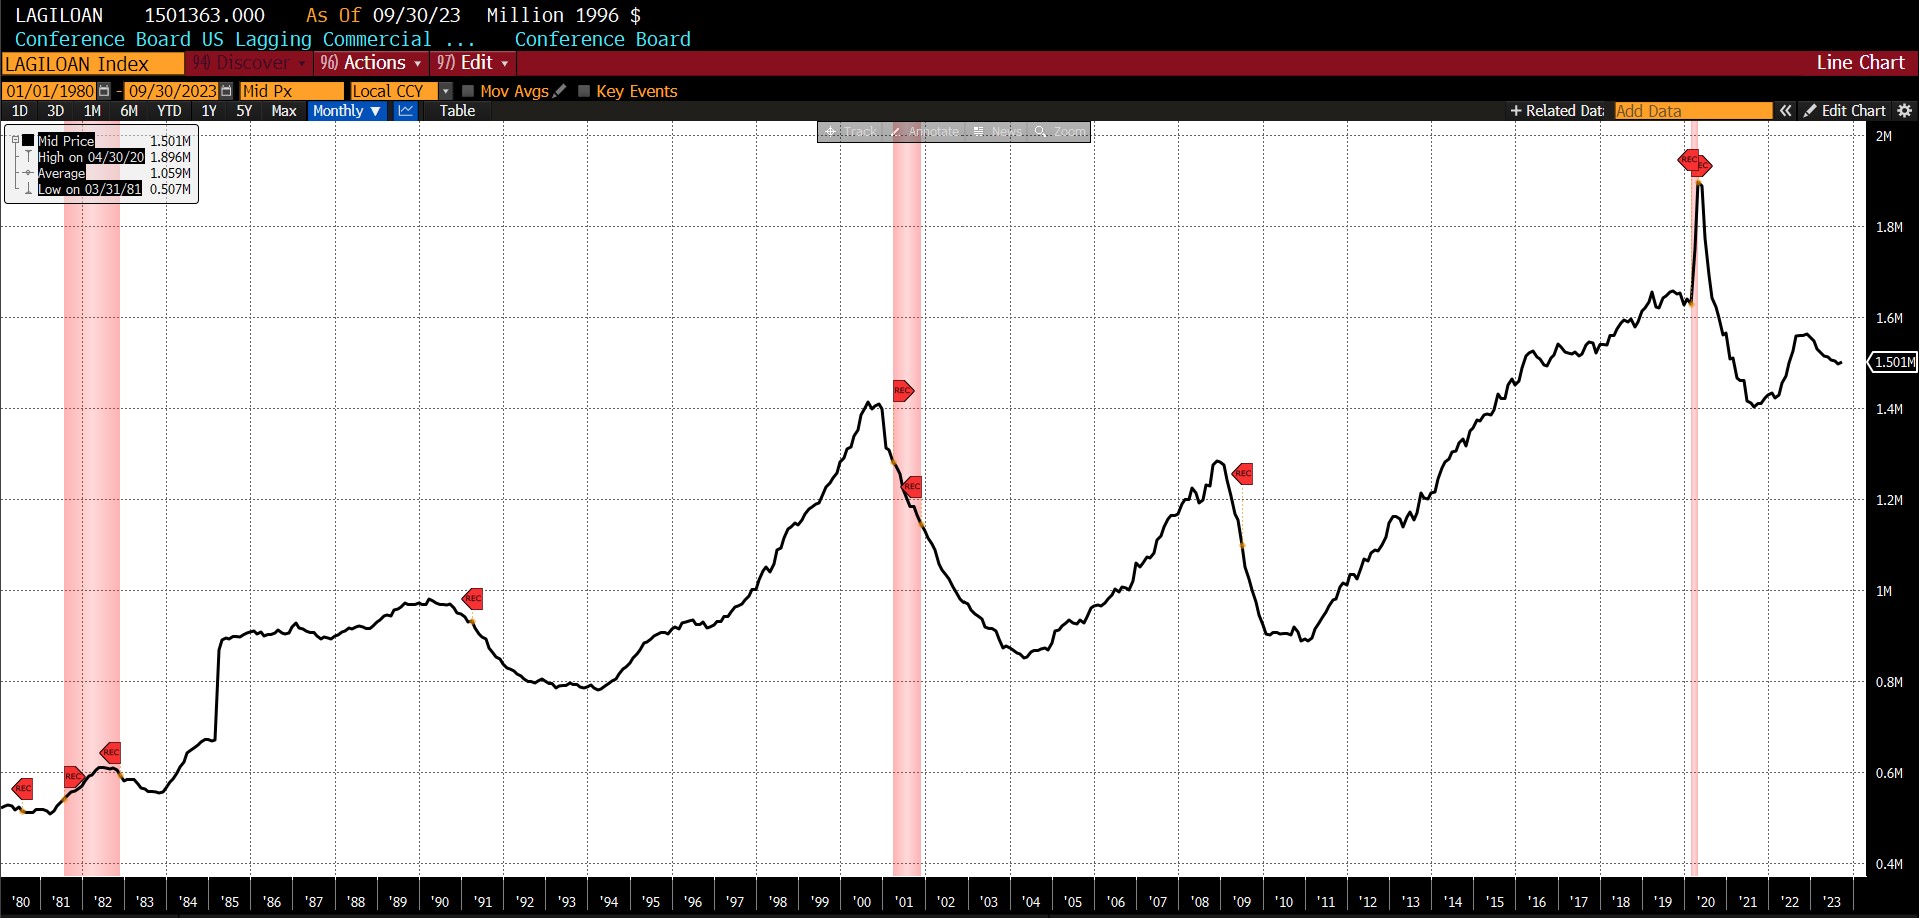
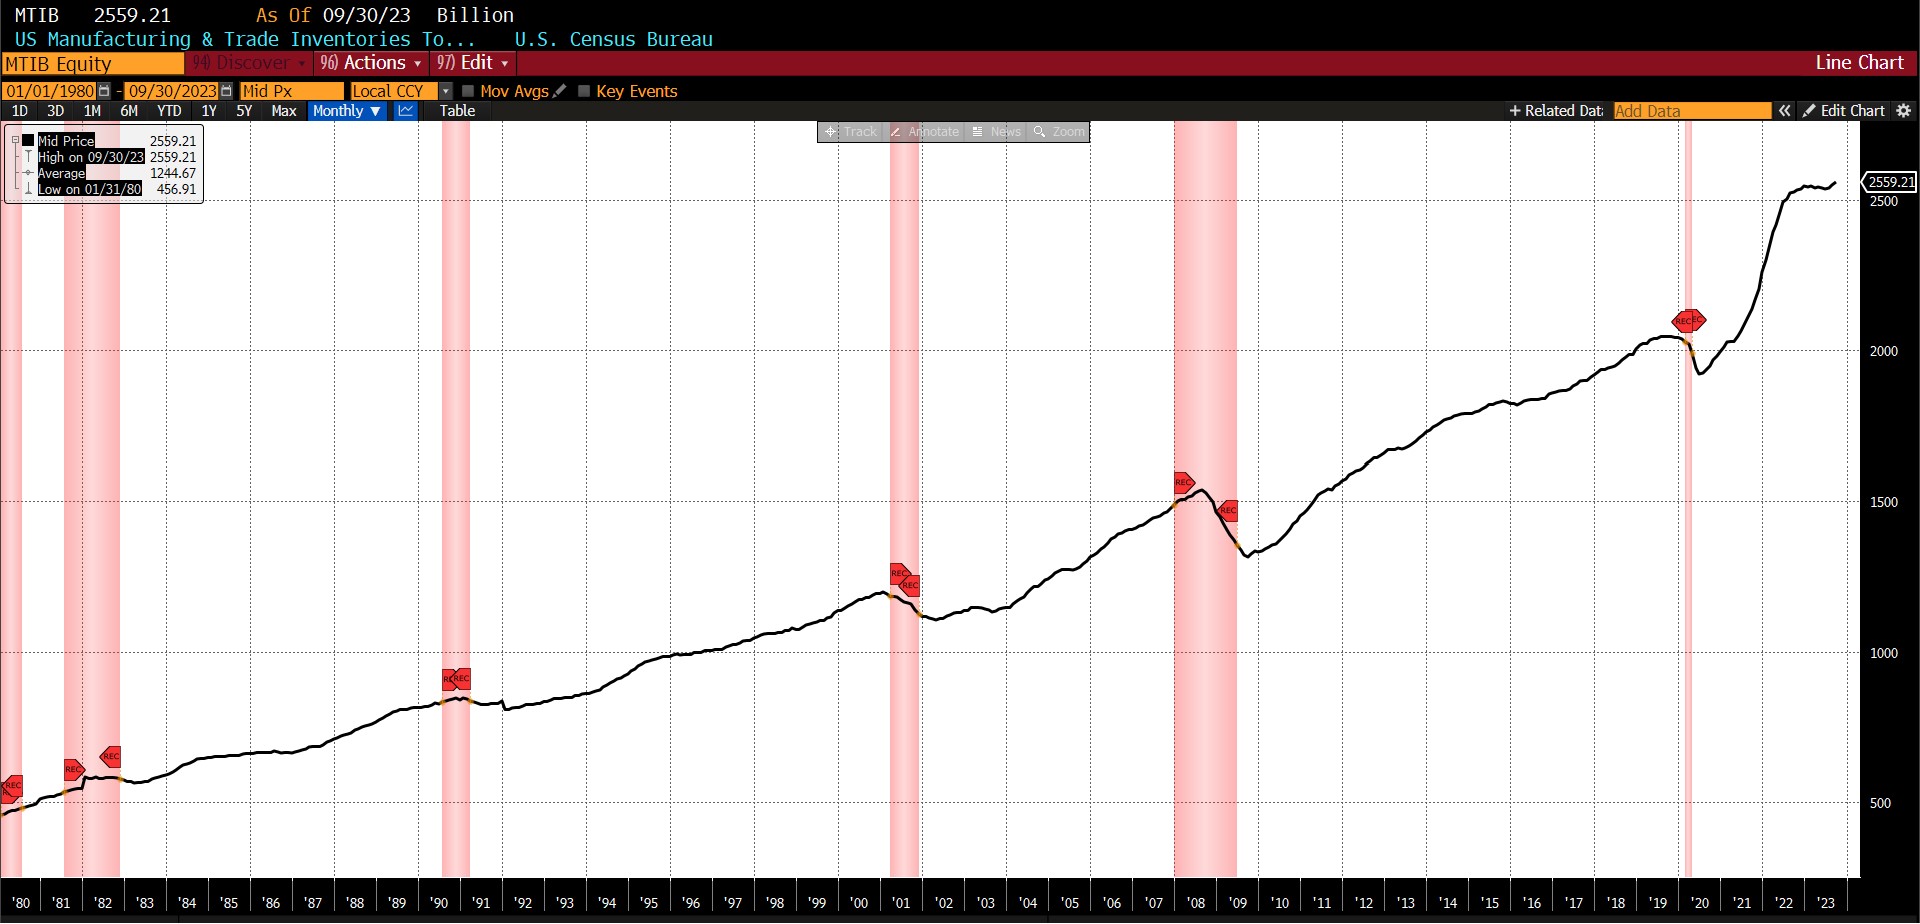
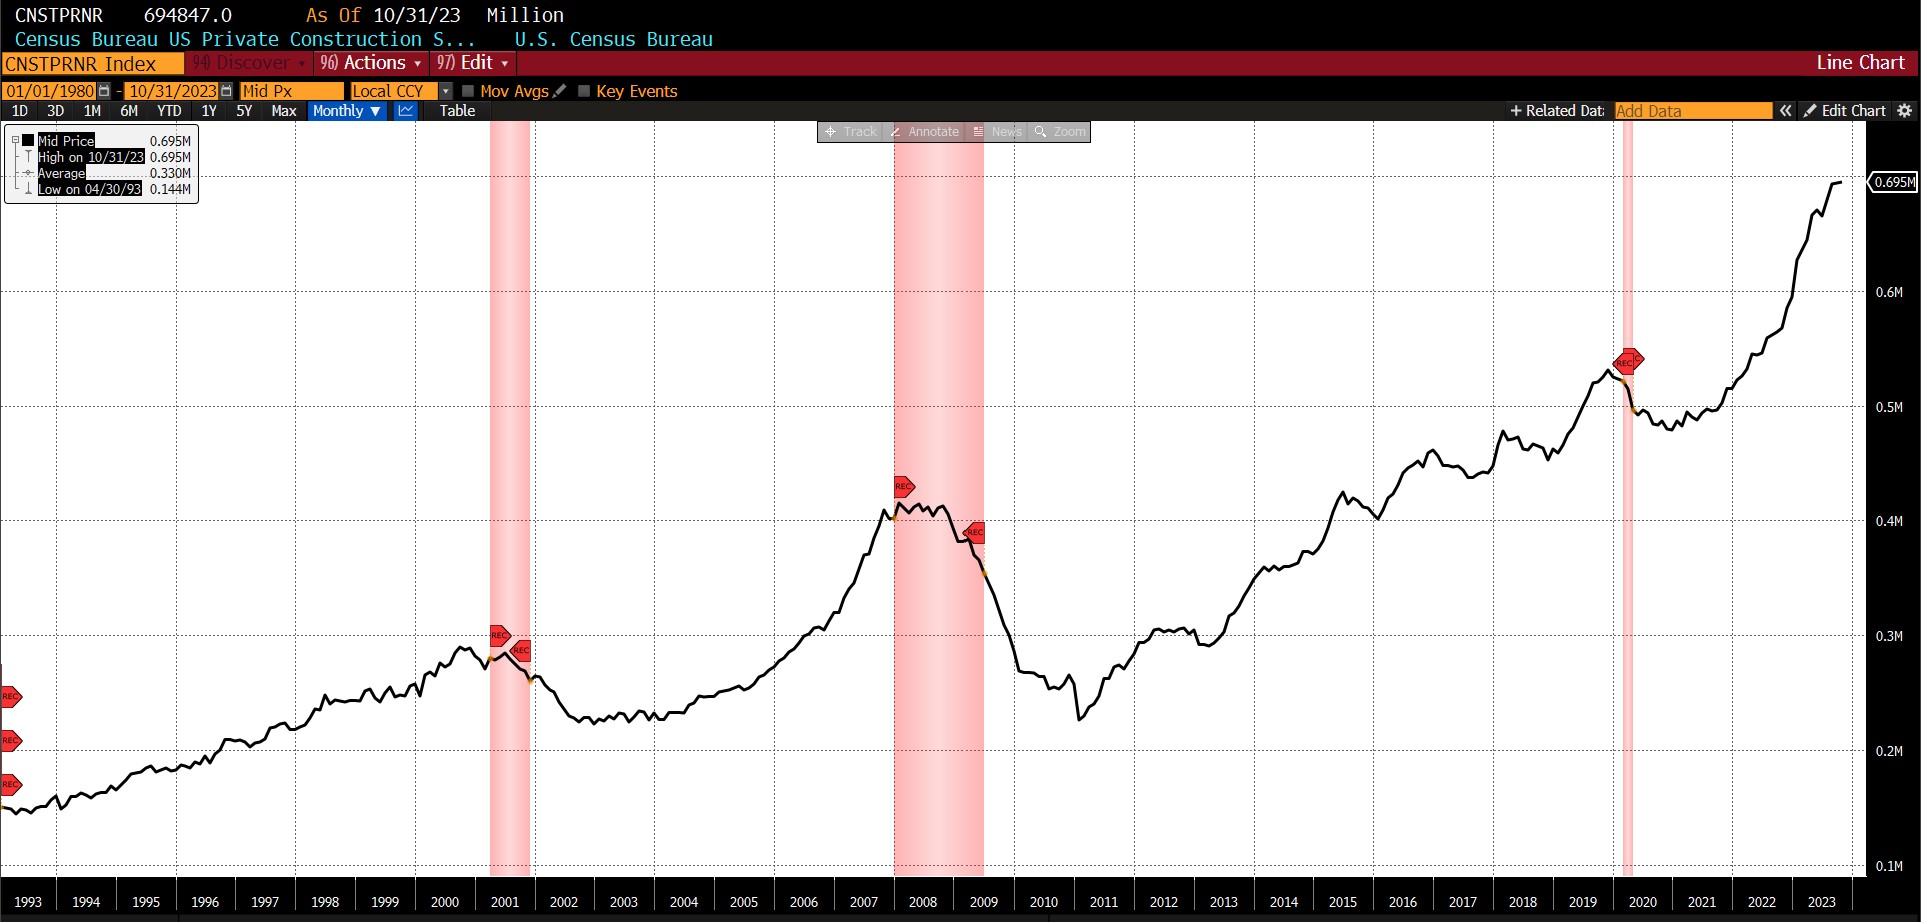
The components of the Lagging Indicator were also evenly split. The Conference Board US Lagging Commercial and Industrial Loans rose by 0.4 percent, with total US Manufacturing & Trade Inventories and the Census Bureau’s Private Construction Spending (Nonresidential) increasing 0.4 and 0.1 percent respectively. Headline CPI (month-over-month) declined by 2.4 percent, as did average 30-day yields (-0.5 percent) and Conference Board US Lagging Average Duration of Unemployment (-0.5 percent).
In sinking back to the neutral 50 level, as it also reached in January, May, and September, the Lagging Indicator’s average value throughout 2023 is 49.1, revealing a slightly contractionary bias over the course of the year to this point. As the following discussion will indicate, this is the first time in over one year that the three AIER Business Conditions Monthly indicators are in some agreement with recent macroeconomic data.
Discussion
The second run of the 3rd quarter GDP number saw it revised from 4.9 percent up to 5.2 percent annualized. Those changes primarily came from an increase in estimates of residential investment (3.9 percent to 6.2 percent) and nonresidential fixed investment (-0.1 percent to 1.3 percent). Consumer spending, however, was reduced from 4.0 percent to 3.6 percent.
Our recent focus on consumption continues this month with early data from both Black Friday and Cyber Monday as well as anecdotal information. The National Retail Federation predicts that holiday sales (from November 1st to December 31st 2024) would grow between 3 and 4 percent from last year. Yet because that forecast is not adjusted for inflation, in light of October 2023’s year-over-year core CPI reading of 4 percent the change in the movement of merchandise may in fact be flat from 2022. Similarly, Mastercard reported a 2.5 percent increase in online and physical sales between last year and this year – also not adjusted for inflation.
On Cyber Monday, engagement of “buy now pay later” (BNPL) plans hit an all-time high, vaulting over 42 percent from last year’s levels according to Adobe Analytics. While there are some differences, BNPL services are similar to what were at one time called “installment plans.” US consumers are likely turning to them for convenience and to avoid current record rates on credit cards which as of December 1st stood at an average annual percentage of 21.19 percent.
US consumers are evincing fatigue. Household disposable income is sliding, with personal consumption expenditures (in nominal dollars) following them and savings continue to fall. Given the outsized role of consumer spending in GDP, a continuation of this trend into 2024 is quite likely to correspond with slower economic growth.
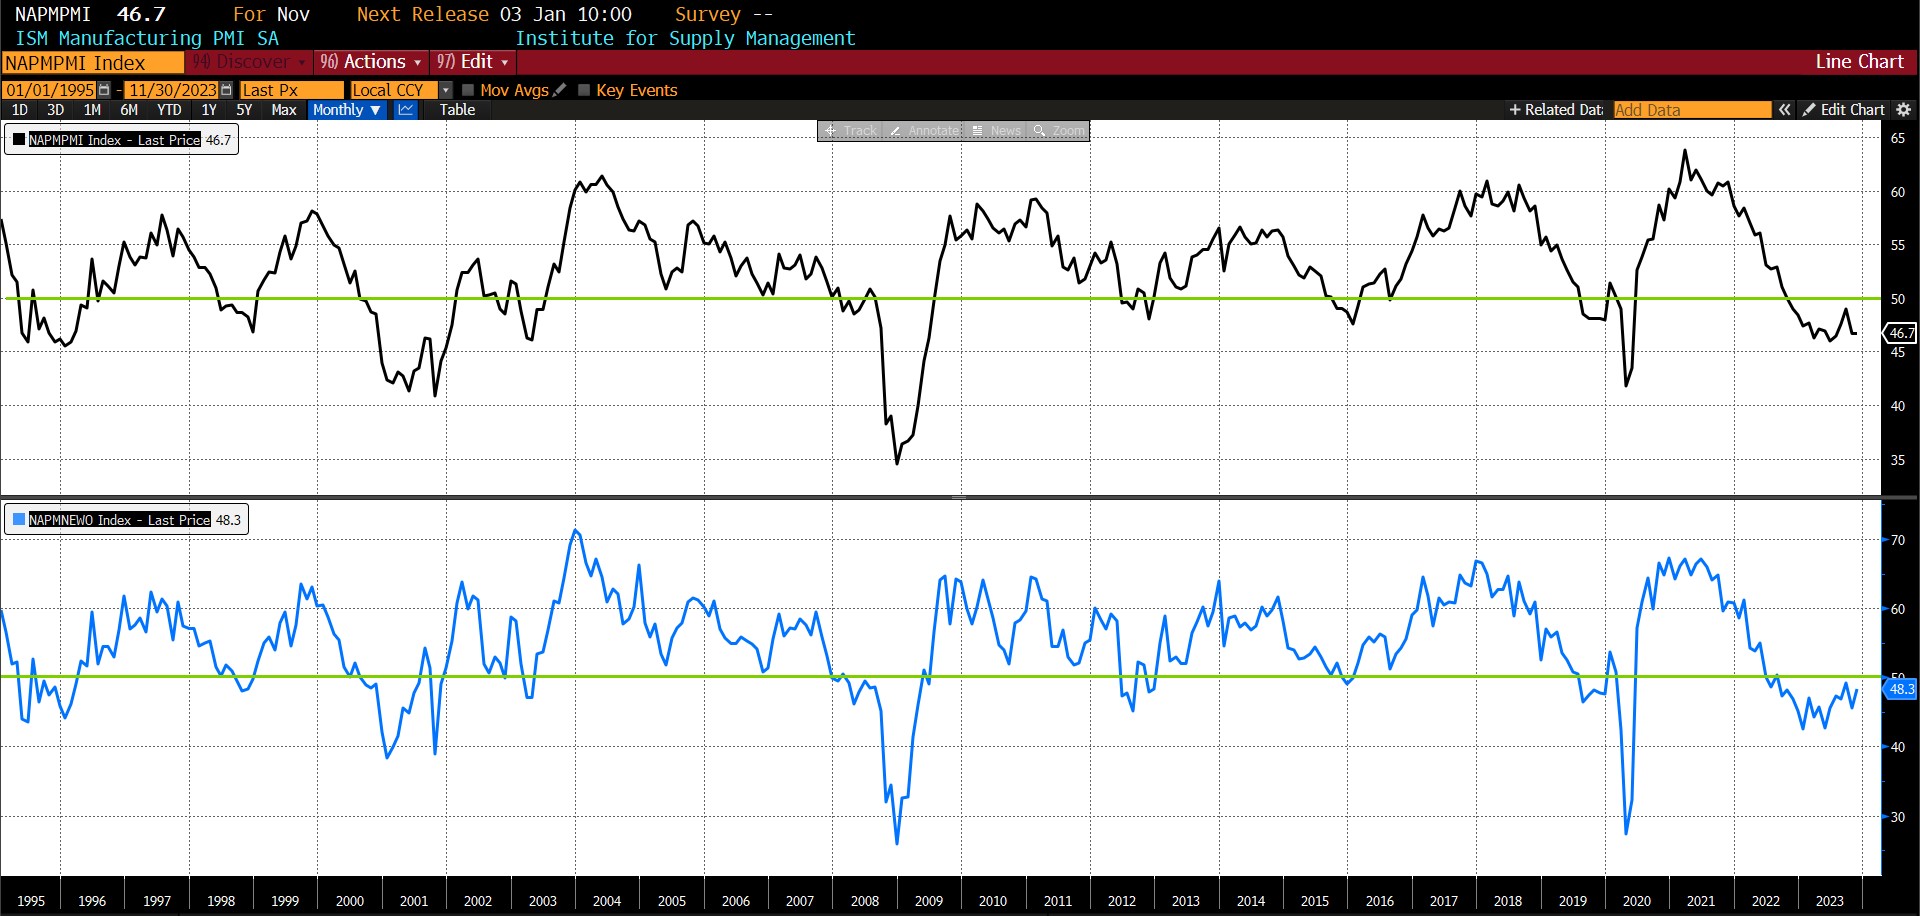
On a separate front, the Institute for Supply Management’s manufacturing index remained at 46.7 in November, adding to evidence that the US economic growth is slowing. This is the 13th straight month of declines, the longest since the bursting of the dot com bubble. Although there was a slight rise in the index of new orders (from 45.5 to 48.3) that portion of the survey remains at contractionary levels (below 50). Higher interest rates and a retrenching of capital expenditure in light of growing sluggishness have led to the index of new orders also remaining in contractionary territory (under 50) for 15 months, the longest negative streak since the 1981 – 1982 recession.
Institute for Supply Management Purchasing Managers Survey and Index of New Orders (1995 – present)
Among a number of long-observed economic patterns in business cycles is that once the US employment rate surpasses a certain level, it develops a sort of inertia. At that point it rises nonlinearly before returning to fuller levels of employment. Since World War II, from the trough the rate either rises by less than 0.5 percentage points or more than 1.9 percentage points, coinciding with recessions. Based upon the recent uptrend in the U-3 measure (US Unemployment Rate Total in Labor Force, Seasonally Adjusted), the recent trough occurred at the 3.4 percent level in both January and April 2023. Since July the rate has ticked up steadily to 3.9 percent in October 2023. (The next data point will be released on 8 December 2023.)
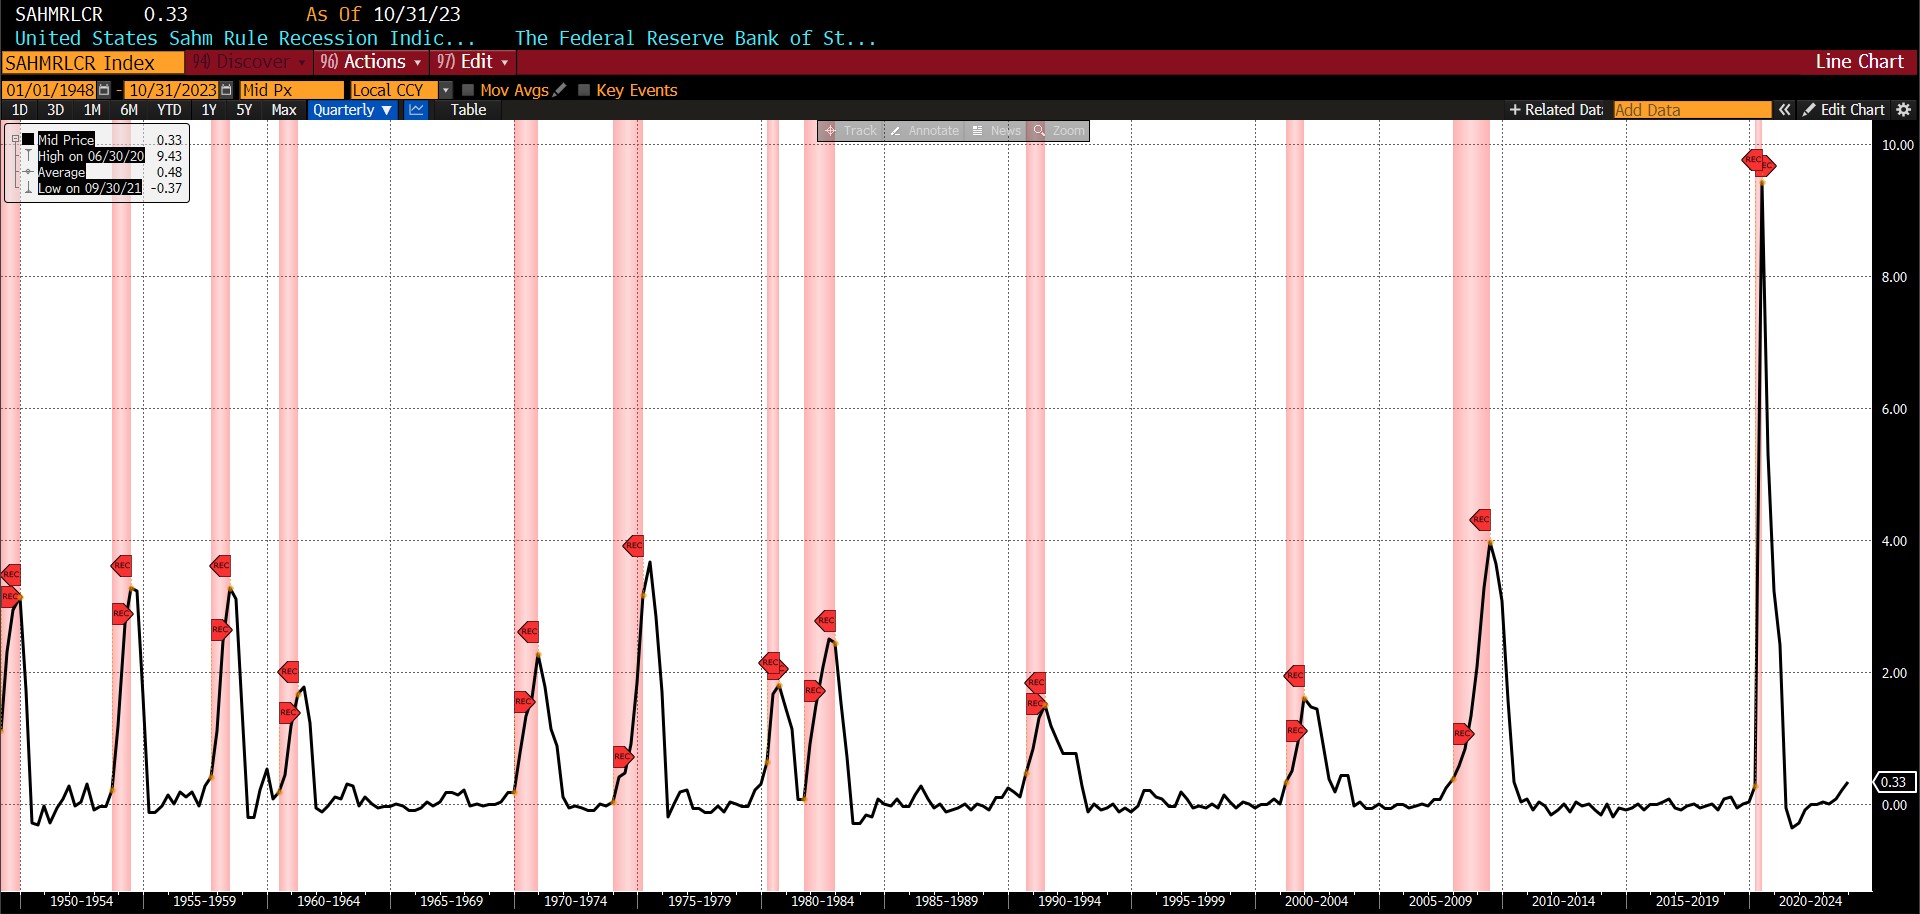
A measure which has demonstrated high empirical reliability in forecasting recessions is the Sahm Rule. It posits that an 0.5 percent change in the three-month moving average of the U-3 rate relative to its 12 month minimum is a threshold which has generated no false positive going back to the 1950s, correctly identifying recessions an average of four months after they have begun. The current Sahm Rule level is 0.33. Although Goldman Sachs has proposed that a 0.35 percent change is sufficient to trigger the rule, if the U-3 rate hits 4 percent within the next two months the trigger will be definitively struck.
Sahm Rule with NBER-dated US recessions (1948 – present)
Another indicator is based upon US unemployment inflows and outflows: when inflows surpass outflows for four consecutive months, on average the US economy has already been in recession for two months. Unlike the Sahm Rule, the data behind the inflow/outflow matching indicator only goes back to 1990, but also has a high degree of reliability. Based upon that rule, the US has already entered a recession. Having said that, we are cautious about the exceptional nature of the current economic environment where established historical signals are considered. While we have expressed (and maintain) our view that the US will enter a recession by September 2024, thoughtful scrutiny requires considering two factors which may undermine these typically reliable signals.
The natural rate of unemployment in the United States is currently estimated at between 4 and 5 percent. If true, an uptick in U-3 could settle into a range which would not generate substantial economic slack and thus make “soft landing” scenarios more likely. If true, though, the implication is that the non-accelerating inflation rate of unemployment (NAIRU) is higher than the current 3.9 percent U-3 level, which would likely generate upward pressure on wage and price inflation. Instead, though, both have declined this year, suggesting a lower NAIRU than required by this explanation.
We have focused upon consumers in the last few installments of AIER’s Business Conditions Monthly, and it is regarding them that a second reason for which “it’s different this time” derives. Before previous recessions, the balance sheets of both households and corporations have been far weaker than they are currently. As will be discussed in a subsequent section, consumers are beginning to show long-expected signs of wallet fatigue, but household debt service-to-income levels are substantially lower now than they have been before previous downturns: 9.8 percent currently versus 12.1 percent in 2001 and 13.1 percent in 2007.
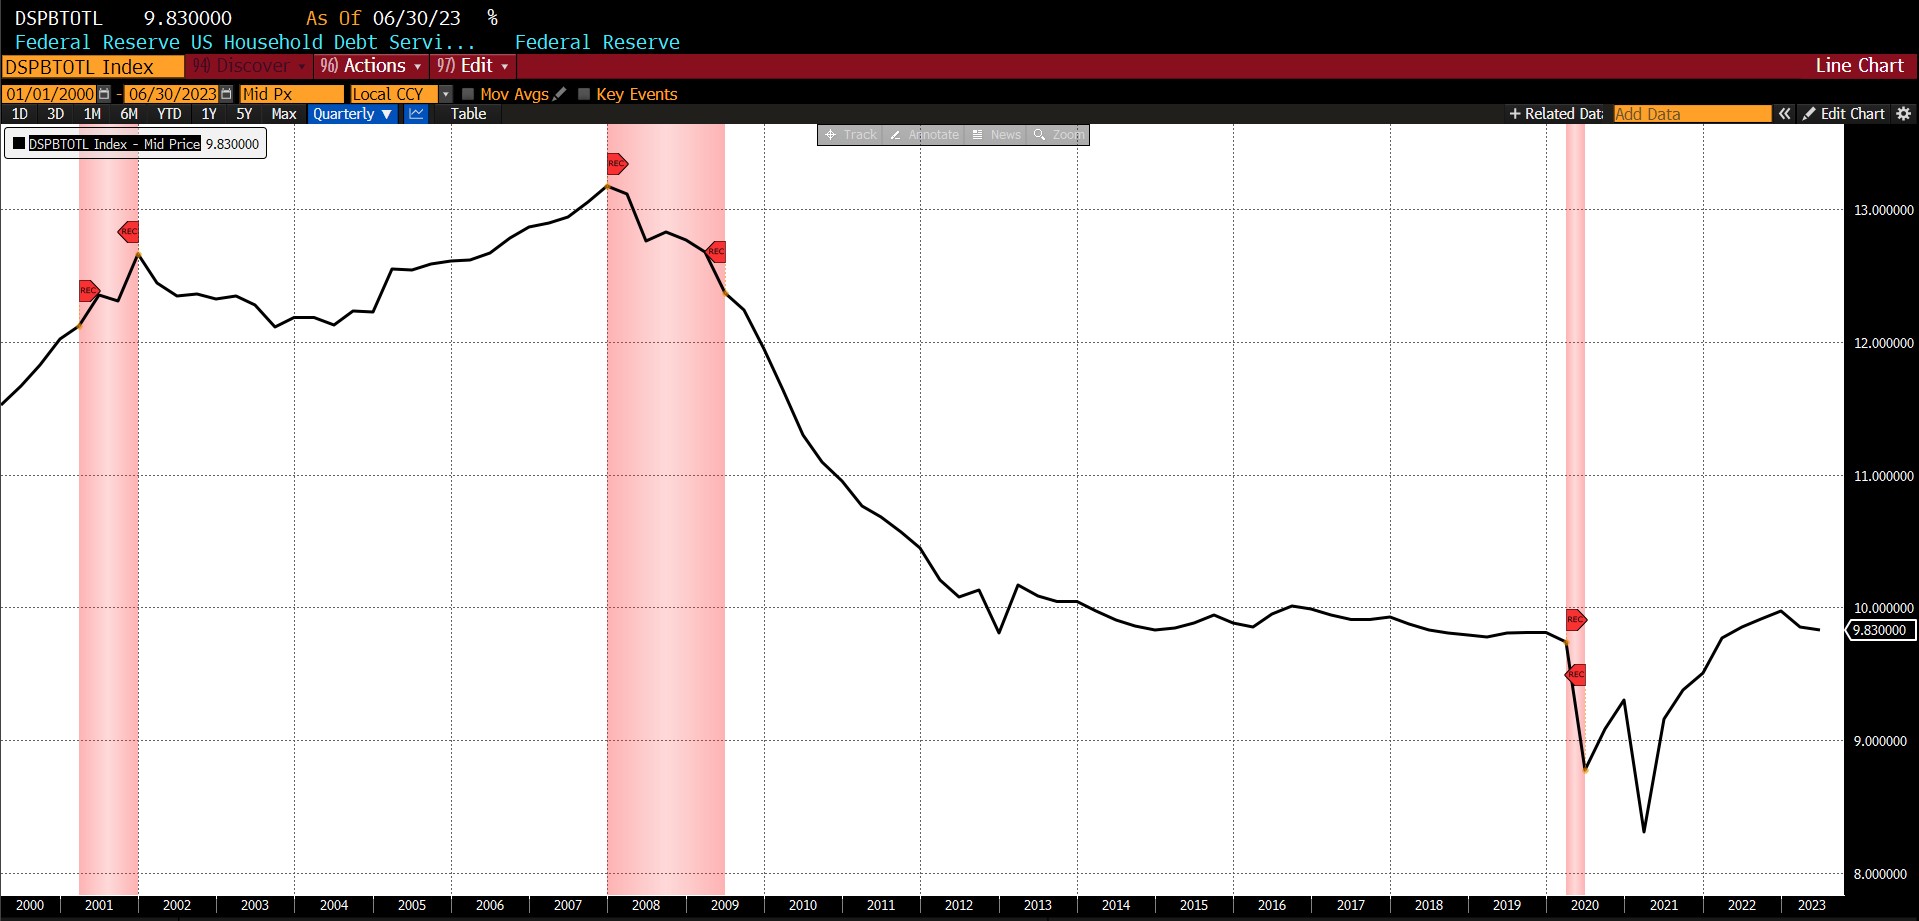
Yet the credit contraction continues and interest rates are continuing to rise as savings dwindle, likely leading to a greater debt service burden in the coming months.
In short, while those reasons have some degree of merit they do not dissuade us from our recession forecast. Having said that, while we are loath to predict the severity of a forthcoming recession we tentatively concede that those facts suggest a shorter or perhaps shallower recession than might be otherwise.
A more immediately overarching factor in how the current economic slowdown develops, in our view, are the policy actions of the Federal Reserve. Market implied policy rates currently anticipate Fed Fund rates at roughly 5.08 percent in May 2024, essentially pricing in a 25 basis point cut by that time. If the “higher for longer”/”right here for longer” mantra were reversed in the face of accelerating unemployment and growing slack (and by substantially more than 25 basis points), the ongoing labor market weakness and deteriorating sentiment might be arrested. This tension is the very essence of monetary policy uncertainty, a topic which has seen no shortage of research over the past decade (see Husted, Roger, and Sun 2020 for more information).
A final word in this month’s Business Conditions report. A growing number of economic forecasts are leaning toward a soft landing in 2024. This may indeed be the case. Yet Bloomberg reports that on the eve of the 1990 to 1991, 2001, 2007 to 2009, and even 2020 Covid policy recessions, predictions of soft landings dominated discourse. It may be that predicting a recession which does not occur is more damaging to one’s reputation (it is certainly more stereotypical) than a soft landing projection which crumbles. A more conclusive reason may be found in the distribution of monthly unemployment rates between 1968 and 2023. (For the mathematically inclined, this is the kernel-fitted distribution.)
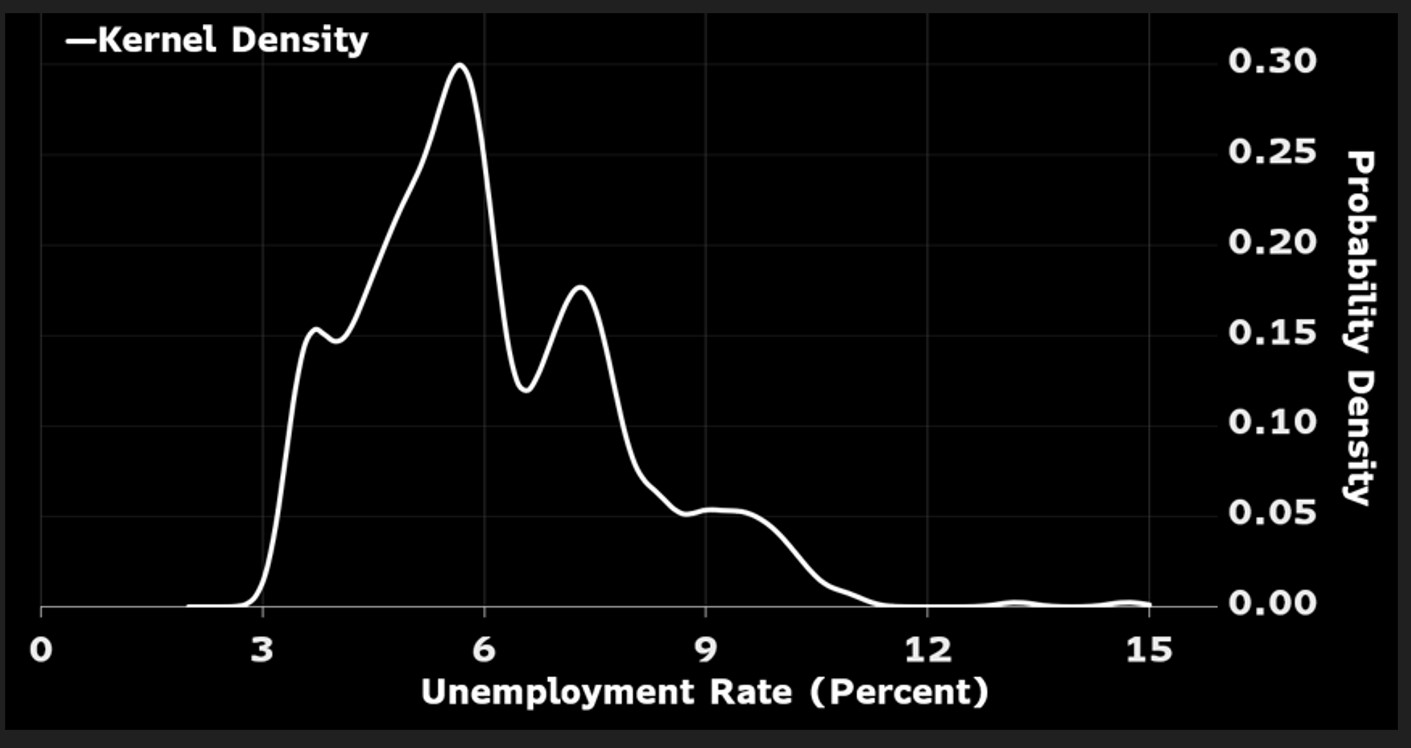
The distribution of unemployment rates is highly bimodal, meaning not normally distributed, and with a long right tail. In short, we see a large cluster of unemployment in the 4 to 5 percent range, with a small but appreciable cluster of employment at the 7 percent and higher range. Forecasting models which rely on normal distributions, as many likely do, will thus consistently and predictably understate those worse outcomes represented by the long, fat right tail of the distribution.
While we maintain an open-minded stance toward scientifically defensible alternative perspectives and will continue to impartially and vigilantly assess incoming data, our current analysis still points to a recession occurring before September 2024 as the most probable scenario.
LEADING INDICATORS

ROUGHLY COINCIDENT INDICATORS

LAGGING INDICATORS
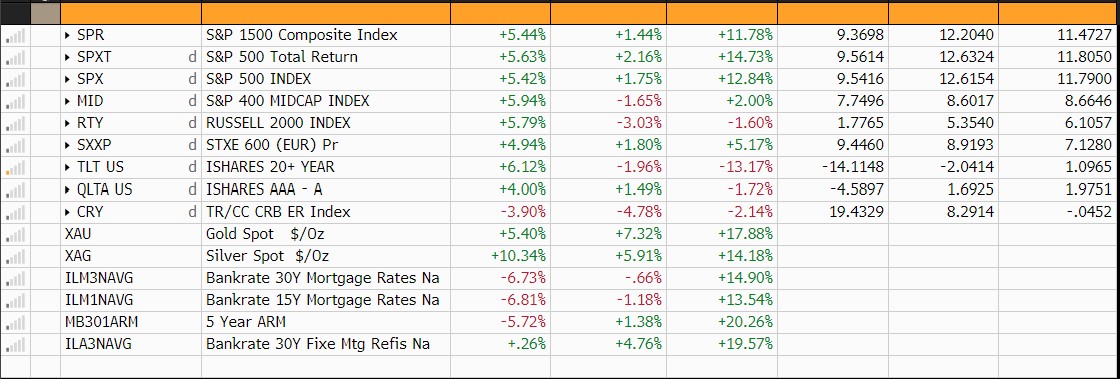
CAPITAL MARKET PERFORMANCE
(All charts and data sourced via Bloomberg Finance, LP)