Volatility Signals Inflation Risk
When prices first begin to move, they do not all change at the same time. Commodities, unbranded goods, and goods with high demand and high frequency of purchase move first.
A product like oil jumps first, then levels out. Its impact is felt on other goods which then move up in price. Because these goods move at different times and are weighted differently in price indices and budgets, the indices show a lot of volatility from month to month. These changes may also cause seasonal adjustments to mislead.
Energy is pushing most of these swings. Even as oil prices have stabilized quite a bit from the startling swings of the fourth quarter of 2012 and the first quarter of 2013, seasonal swings in energy prices remain exaggerated.
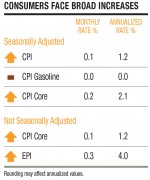
The resulting changes in the broad indices, however, are modest. According to the May Consumer Price Index just released by the Bureau of Labor Statistics, consumer prices rose 0.1 percent on a seasonally adjusted basis. This provides evidence that the modest inflationary pressures that are normal in a recovery are intact. Inflation is not poised to explode, nor is deflation likely.
On the wholesale front, prices are firming at the crude materials and intermediate goods stages of production. Much of the firming came from energy and food prices. Yet another month of falling import prices, low-cost labor, productivity gains, and adoption of new capital equipment has helped limit price increases at the final goods level. As capacity utilization grows and unemployment falls, inflationary pressures will increasingly outpace cost savings.
In economics, expectations rule. People form expectations based on what they see, and make their decisions accordingly. In terms of prices, people see the prices of the goods they buy day to day, and that are not contractually bound. AIER’s Everyday Price Index measures exactly this and provides a glimpse of the public’s anticipation of broader price inflation.
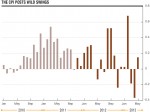
The EPI rose by 0.3 percent in May after falling 0.8 percent in April. The EPI confirms the feeling of most consumers that the inflation they experience is substantially higher than headline CPI suggests. While normal seasonal inflation drove much of the EPI’s upswing in May, broad-based inflationary pressures are also at work and may signal greater inflation to come.
Consumer Prices
Rising prices are evident in a wide array of important goods and services, and there are reasons to expect price pressures to spread. The seasonally adjusted core CPI, which eliminates food and energy, rose 0.2 percent. If the index continues at this pace, it will annualize above the upper end of the Fed’s target range of 2 percent.
Energy costs are contributing to inflationary pressures more than is readily apparent. According to the widely quoted seasonally adjusted indices, gasoline prices were flat in May. But the unadjusted gasoline index, which measures what Americans pay at the gas pump, rose 0.8 percent, about 10 percent on an annualized basis.
The idea behind seasonal adjustment is that while prices may rise one month, there will be offsetting declines in other months. But even if there are offsetting price changes later, Americans are still going to pay 0.8 percent more for gasoline this month. And there’s no guarantee the offsetting changes will come about.
The seasonal adjustment process is simply treating a proportion of the price increase as if it were seasonal. It removes the usual seasonal price swings from the data. In a changing economic environment, the seasonals can simply be wrong.
Energy costs affect household fuel and utilities costs as well as gasoline. The non-seasonally adjusted prices of fuel and utilities rose 1.4 percent in May. Electricity rose 0.8 percent more than the usual May price swings. That is a 2.6 percent increase in the non-seasonally adjusted dollars you pay for electricity—all in a single month. Electricity prices should peak over the next few months and begin to decline with the cool autumn air. But the increase is big enough to affect budgets now.
At the same time electricity prices rose, fuel oil prices fell by 2.9 percent before seasonal adjustment. This is little consolation, since you don’t run the furnace much in the summer.
The price of utility natural gas service rose 1.7 percent—2.4 percent over typical seasonal price changes. Since natural gas gets used year-round for cooking, hot water heaters, and clothes dryers, as well as heating, prices may continue to rise for a while.
The food index fell 0.1 percent in May, with or without seasonal adjustments. The prices of food for home declined 0.3 percent, while the prices of food consumed away from home increased 0.2 percent.
The service sector, which is less vulnerable to competition from low-cost imports, saw increases last month. Services (other than energy services) rose a seasonally adjusted 0.2 percent. Airline fares rose an adjusted 2.2 percent and motor vehicle maintenance and repair prices rose 0.3 percent.
Over the last 20 years or so, there has a large body of research based on real-world data to support the link between higher inflation volatility and higher inflation rates. As the new inflationary environment takes hold, wide variances in prices across goods will narrow, but overall volatility will likely persist. There is also reason to believe that the broad upward movement in prices will continue, although many factors are in place to moderate inflation increases.
Chief among these is the outlook for oil. OPEC recently reached an agreement to maintain current production levels, while the U.S. is producing record amounts of oil. World energy demand is soft. Together this suggests that, absent significant political obstacles, oil prices should be stable with some steady upward drift as world economies recover.
Some upward pressure on prices will come over the next months from additional increases in meat prices in a delayed response to widespread drought conditions last summer.
Wholesale Prices
Oil price changes ultimately have a pervasive effect on the prices of goods and services throughout the economy.
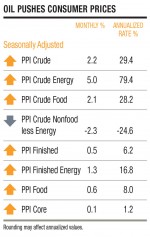
This was made especially clear with wholesale prices in May. The Producer Price Index for Finished Goods rose 0.5 percent after falling 0.7 percent last month. More than 60 percent of the broad-based rise in finished goods prices came from increases in the PPI for Finished Energy Goods. It advanced a seasonally adjusted 1.3 percent after falling 2.5 percent last month.
Increases in the wholesale price of food also contributed to the overall rise in the finished goods index. The PPI for Food was up a seasonally adjusted 0.6 percent in May, compared to a 0.8 percent decrease the month before.
Low-cost labor and productivity enhancements have offset higher energy and materials costs to keep finished goods price increases contained. The PPI Core Finished Goods Index—the prices of finished goods excluding food and energy—rose only 0.1 percent in May.
Inflationary pressures are more pronounced at the intermediate level. As before, we gain a certain amount of clarity by looking behind the adjustments to observe the raw data. The unadjusted PPI Intermediate Index, which measures the costs of products produced for wholesalers, firmed up. It was flat for May after falling 0.6 percent last month. The decline in actual, unadjusted, real-world prices stopped. Food was an important part of the reason. Unadjusted intermediate food and feed prices rose 1.4 percent. Intermediate materials for food manufacturing also rose 0.9 percent.
The prices of raw commodities are rising broadly. Crude materials prices rose a seasonally adjusted 1.3 percent, or 2.2 percent after seasonal adjustment. A bigger increase after seasonal adjustment can only mean that these prices usually fall this time of year, but this year rose substantially instead.
Seasonally adjusted nonfood crude materials rose 2.2 percent and nonfood crude materials except fuel rose 1.4 percent. Crude material less agricultural products also rose an adjusted 2.1 percent.
Demand
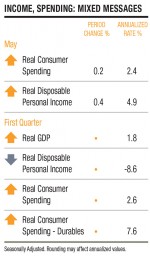
Late last month, the Commerce Department revised first-quarter GDP downward from 2.5 percent to 1.8 percent. The economy is slowing, but the expansion continues.
About two-thirds to three-quarters of total demand comes from consumers, who use their paychecks, savings, and consumer debt to make purchases. Decreased personal consumption expenditures largely drove the first quarter’s revision.
The good news is that in May, real disposable personal income, which represents households’ buying power and the primary source of demand in the economy, rose by 0.4 percent. Disposable income is made up of inflation-adjusted personal incomes less taxes, but includes transfer payments from the government. Government transfers rose $19.4 billion in May after falling $15.7 billion in April, including a big swing in Social Security payments.
It appears that the loss of consumer buying power from payroll tax increases and inflation were offset by government payments, which is not really the best way to grow an economy. We want private sector growth to be able to sustain itself. Although disposable income has risen, it is, in some sense, artificial.
May’s increase in buying power resulted in a consumer spending increase of 0.2 percent.
As the consumer comes back stronger in the second half of 2013, business expectations will improve, along with business investment. This suggests that incomes will exhibit stronger growth in the second half and into 2014 as higher payroll taxes are absorbed. The improvements should be gradual, as should the growth of inflationary pressures.
Supply
Growing demand in the face of stagnant supply growth is a formula for inflation. Currently, supply is not rising much, and it is not clear how quickly it will grow.
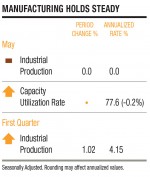
An important supply index, the Index of Industrial Production, was unchanged in May after declining 0.4 percent decline in April. This brings the index to 98.7 percent of its pre-recession peak, up 1.6 percent year-to-year. Manufacturing production rose 0.1 percent after falling for two months.
Manufacturers have adopted a wait-and-see attitude, holding production at current levels until they get a clearer picture of the future of the economy. Most indices at the Institute for Supply Management are hanging around the 50 percent level, indicating neither contraction nor expansion in manufacturing. The ISM’s Purchasing Managers Index, for example, fell 1.7 percentage points to 49 percent in May before rebounding to 50.9 percent in June.
As with prices, unevenness prevails. While some industries are staying in holding patterns or slowing production, 12 of the 18 manufacturing industries are reporting growth in June.
Looking forward, the Business Roundtable’s second quarter CEO Economic Outlook Survey provides evidence that CEOs are expecting demand and therefore output gains in the year’s second half. According to the survey, they believe GDP will grow at a 2.2 percent annual rate, up from 2.1 percent in last quarter’s survey.
If they are right, increased production will mean increased incomes, which will fuel additional spending. Plenty of available capacity, high unemployment, and modest productivity growth will help limit inflation in final retail goods prices.
[pdf-embedder url=”https://www.aier.org/wp-content/uploads/2014/01/IR20130701.pdf“]