Use Forecasts for Trends Only
The import sector was another source of very slight upward pressure on prices in June. The Import Price Index inched upward, bringing the 12-month change to 1.2 percent. This represents a turnaround in import prices, which decreased 1.1 percent during 2013.
The Producer Price Index (PPI) increased 0.4 percent for June and was up 1.9 percent on a year-over-year basis. While PPI Final Demand Foods actually fell 0.2 percent for the month, for the last 12 months, the increase in this volatile category was 3.5 percent.
Demand and Supply Measures
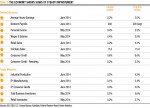
Retail sales figures for June were not outstanding, but the 12-month change remained a robust 4.3 percent (See Table 2). Average hourly earnings inched upward 0.2 percent, and now stand at a 12-month increase of 2 percent, in line with inflation.
The biggest driver of consumer demand over the last year was a 6.6 percent increase in consumer credit. Banks have ample money to lend. If consumer borrowing continues to accelerate, it could contribute to an increase in prices.
Trends Looking Forward
The modest increases in prices are keeping the inflation rate at or near the Federal Reserve’s annual 2 percent target rate, in line with the trend since early 2012.
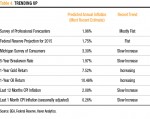
We find that current forecasts point to slowly increasing inflation in the near future. While the magnitude of the change may be unpredictable, there is a general expectation among forecasters of increasing inflation, which fits with our understanding of the current economy.
While the odds of predicting a precise value 12-, six-, or even three-months out, are very small, we think it’s possible to use economic activity to gain a more nuanced picture of future trends than provided by forecasts alone. Several measures of expectations have proven to be reasonable predictors of the general trend of inflation, even while the magnitude may be off. However, inflation shocks that occurred during the Great Recession and during the Volcker era were not well predicted.
Professional Forecasters
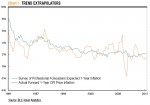
To judge the accuracy of professional forecasts, we look at the quarterly Survey of Professional Forecasters since the third quarter of 1981. As seen in Chart 1, professional forecasters have done a reasonable job of predicting the general direction of inflation in times of normal, average inflation. From 1991 through 1995, for instance, the consensus forecast was never more than 1 percentage point different from actual inflation.
However, consensus estimates tend to miss sharp increases and declines. For example, in the third quarter of 2007, the Survey of Professional Forecasters projected one-year forward price inflation of 2.2 percent, in line with the 2.3 percent inflation of the prior 12 months. The next year, however, saw inflation of 5.3 percent.
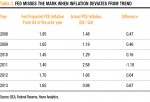
The Federal Reserve offers a forecast of price inflation for fourth quarter over fourth quarter from the previous year. It updates the forecasts each quarter as more data become available. It does not offer a rolling forward one-year projection, which makes it difficult to analyze its accuracy. The data in Table 3 show fourth-quarter Fed projections for the following year since the data became available in the fourth quarter of 2007.
These projections were generally in the vicinity of actual inflation, where the mark was overshot by only 0.04 percentage points in 2012 in the best case and underestimated by 1.18 percentage points in 2011. While we have data for only six years for this period, the Fed projections seem to fluctuate little from year to year.
Market Indicators
Can market indicators do a better job of predicting inflation than the pros? We analyze three common indicators for their success in prediction: break-even inflation rates, gold prices, and oil prices.
Break-even inflation is the difference between two bonds of similar term and quality, where one is adjusted for inflation and the other is not. Bond yields are affected by investor expectations of future inflation over the life of the bond. So comparing yields of traditional bonds and inflation-adjusted bonds offers one view of market expectations of future inflation.
The most common indicator of break-even inflation is the difference between the yield on five-year Treasury bonds and the current Treasury Inflation-Protected Securities (TIPS), a Treasury bond with a yield that is adjusted for inflation. When the difference is small, it indicates slack demand for TIPS over traditional Treasuries and that the market expects little need to buy inflation protection in the form of TIPS.
Chart 2 shows the comparison of the break-even inflation rate and actual CPI price inflation since the data became available in 2003. (Note that five years of inflation data are necessary for comparison so the data only run through mid-2009.) Even during this period of relatively stable inflation, this market indicator is a poor predictor of actual inflation.
Next we look at two traditional measures of expected inflation: gold and oil prices. Chart 3 clearly shows that gold and oil prices are far more volatile than general price inflation. For this reason, these indicators may be a poor forecast of a specific level of inflation.
But one-year gold returns offer a moderate correlation (0.54) with inflation one year out. This means that gold prices historically have at least trended in the same direction as price inflation, albeit at a much more volatile rate. Oil prices, on the other hand are as volatile as gold prices and show no correlation (0.00) with inflation one year out.
Consumer Expectations
Finally, we turn to the Michigan Survey of Consumers for a measure of consumers’ expectations for the coming year. This survey offers monthly data going back to 1978. Historically, it has been a good predictor of the price increases measured by the CPI. (See Chart 4).
This accurate forecast may reflect that consumers’ expectations of future inflation are highly influenced by their recent experience.
Much like professional forecasters, consumers seem to do a good job of predicting price inflation so long as it remains stable. In January 1979, respondents to the Michigan Survey correctly forecasted that inflation was on the rise, projecting inflation of 7.8 percent. However, they missed the magnitude of the rise when inflation sored to 13.9 percent in following year.
Current Projections
Professional forecasters, surveys, and market indicators each seem to offer some value when it comes to predicting inflation. The point estimates they provide may be unreliable in identifying swings, but these estimates tend to perform fairly well in periods of economic stability.
Our Business-Cycle Conditions report has not seen any indication that a recession is on the short-term horizon, so we can expect inflation forecasts to be reasonably accurate over the next year.
At the same time, most current projections point to a slow and upward trend in future inflation (See Table 4). If we expect that forecasts generally predict the direction of inflation, we should be in line for slightly increased levels over the next year.
[pdf-embedder url=”https://www.aier.org/wp-content/uploads/2014/07/IR20140801.pdf“]


