The EPI Reflects Basic Economic Change
To uncover these trends, we extended the EPI series to 1987. One of the challenges with comparing price levels over longer periods is that people change their buying behavior over time. The Bureau of Labor Statistics periodically uses a survey to capture these changes. In common terms, the economists at the bureau ask people what they buy and then adjust the CPI shopping list accordingly. They do this infrequently to capture longer-term shifts in consumer behavior, rather than changes caused by short-term price reactions.
For example, in the early 1980s, medical studies and a general increased interest in health led people to consume less beef and more chicken and fish. They also became more likely to join health clubs. In addition, as incomes increased, people chose to eat out more and eat at home less. BLS surveys picked up these trends, and the bureau adjusted the CPI accordingly.
In the shorter and intermediate terms, when people are faced with a higher price for an item, they simply buy less of it. Eventually, they may substitute cheaper goods. These effects are fairly small, but can add up over time.
To address this, we have revised the Everyday Price Index to allow for constantly adjusting weights. Weights are simply the proportion of your total expenditure that you spend on each good or service you purchase each month. Dynamic weights allow for day-to-day changes in consumer behavior related to price changes.
This weighting results in a 2011 average annual inflation rate of 8 percent as measured by the Everyday Price Index, compared to a mere 3.1 percent from the CPI. (The unweighted EPI inflation rate for 2011 was 7.2 percent, as reported in the last issue of the Economic Bulletin.)
Besides weighting, another factor that impacts long-term analysis is the emergence of new products and services. In 1997, the BLS significantly changed the list of goods and services that make up the CPI. Many new products, such as mobile phones, movie discs, and Internet services, were added. Other products were reclassified into new categories. Instead of tracking the cost of a long-distance phone call, for example, the new classification simply tracks the cost of telephone services. This partly reflects the emergence of long-distance telephone plans that no longer charged per minute but rather used a fixed fee.
Because of this reclassification, the categories that make up the CPI, and consequently the EPI, are different before and after 1998. This affected the EPI in two ways.
In 1998, two new categories were added to the EPI. One is communication, which includes telephone services, Internet services, and electronic information providers. The other is child care and nursery school fees, which were not collected prior to 1998.
Secondly, new types of products and services were added to the recreation category. Among the new inclusions were club dues for participant sports and movie discs and rentals. Price data for these types of goods and services were not collected in earlier years. Changes in composition are a common and unavoidable feature of any price index. But in this case, they mean that the set of everyday products that make up the EPI in 2011 has changed somewhat from the set of products that made up the EPI in 1990.
Chart 1 shows that the CPI and EPI trended closely until around the early years of the last decade. (Both indices are set to 100 in January 1987 to ease comparison.) After 2002, the prices of everyday goods and services began to increase faster than the overall price level, becoming much more volatile
From January 1987 to December 2011, the CPI roughly doubled: it increased from 100 to 202.9. During the same time, the EPI increased substantially more—from 100 to 234.5. This translates into an inflation rate of about 2.9 per year on average for the CPI and 3.6 per year on average for the EPI.
There are several possible reasons for the divergence of the two indices that came about in the early 2000s. Rapid technological change restrained prices of products, especially those related to information technology. Quality-adjusted prices for mobile phones, personal computers, and televisions fell or increased much more slowly than prices of other consumer goods and services. The same was true for household appliances and even cars. At the same time, increasing globalization and reduction in trade restrictions drove down prices of apparel and other imported goods.
These prices, which are included in the CPI, helped restrain growth in the overall cost of living. But the prices are for products AIER deliberately excludes from the EPI. The price-reducing force of technological improvements and globalization does not restrain prices of everyday purchases quite as much as it does for less frequently purchased items. Toothpaste ain’t so high-tech.
Chart 2 shows an increase in the volatility of everyday prices as compared with the CPI beginning in the year 2000. Increased volatility means increased uncertainty, making it more difficult for people to plan for their everyday expenditures.
Since 2000, rapid growth in many of the developing economies significantly boosted the demand for, and prices of, oil and other fuels. Prices of energy commodities rose rapidly and became much more volatile. (Market changes have made it easier to speculate in the energy futures and spot markets, which may have contributed to this.) Because the EPI takes into account only a subset of all consumer expenditures, fuel and energy costs account for a larger portion of the EPI than they do for the CPI. Rising and volatile fuel and energy prices made the CPI more volatile in recent years as well, but they had a much stronger effect on the EPI.
This is the “sticker shock” that motivated AIER to develop an index of inflation that tracks the price changes ordinary people see in their everyday experience.
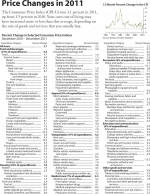
The table lists the major categories of goods and services in the EPI and the 2011 inflation rate for each. Most of the last year’s 8 percent EPI increase (as measured with dynamic weights), for example, comes from increases in the cost of fuel (both motor fuel and household fuel) and from the cost of food and beverages.
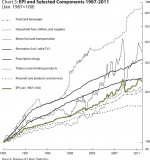
Chart 3 takes a longer-term look at price changes in the key components of the EPI. It also shows where the price pressures were greatest for everyday purchases since 1987.
During this period, the EPI increased by 135 percent. But increases in the prices of individual components affected the EPI differently. Food and beverage expenditures, for example, constitute a major part of everyday spending—between 38 and 47 percent over the years. Even small changes in the price of food affect the EPI significantly.
On the other hand, even large increases in prices of goods that account for only a small portion of everyday spending will not move the EPI by much. One significant example is prescription drugs. Prices of prescription drugs rose faster than the overall EPI, more than tripling since 1987. But during this period, the share of prescription drugs in everyday spending fluctuated between a mere 3.3 and 1.9 percent.
Among the categories that make up the EPI, the largest increase occurred in prices for tobacco products. These rose more than six-fold, likely the result of rising tobacco taxes. But because tobacco products account for only a small portion of everyday expenditures—between 4.5 and 1.9 percent over the years—this huge increase in their prices did not contribute all that much to the overall rise in EPI.
The second-largest increase, of more than three-and-a-half times, occurred in the prices of motor fuel and transportation. This category accounts for a much larger share of everyday expenditures—between 14 and 20 percent over the years. Fluctuations in fuel prices not only translated into significant fluctuations in the overall EPI, they contributed to its rapid rise.
At the other end of the spectrum, prices for personal care products and services increased much more slowly than the overall EPI. Since 1987, they rose by only 65 percent, less than half as much as the overall index.
In essence, we each have our own Everyday Price Index. People who spend more of their money on products with rapid price increases have seen their cost of living rise even more dramatically than the EPI suggests. This includes people who spend more on fuel and transportation, prescription drugs, tobacco, cable TV (part of the recreation category), and child care.
On the other hand, people who are very healthy or who do not smoke are not at all affected by rapid price increases in prescription drugs and tobacco. People who spend more on products that are experiencing falling prices—such as personal care products and services, household supplies, food and beverages, and phone and Internet service—saw their everyday cost of living rise more slowly than the EPI suggests. But the everyday cost of living is likely to have risen faster that the official CPI would imply for everyone.
Prior to 2002, CPI inflation may have been a reasonable approximation for the price increases people faced in their everyday purchases. But this is no longer the case.
This means that indexing various payments—Social Security benefits, for example—to the increase in the overall CPI no longer adequately compensates recipients for rising everyday costs. This has the strongest impact on individuals who rely on fixed incomes from savings or Social Security. These people need to plan for essentially uncontrollable changes in everyday costs.
How to Convert Past and Present Values
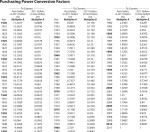
The table above provides a simple way to convert values from the past into their equivalent value today (or vice versa). To convert a value from a particular year to its 2011 equivalent, simply multiply the original price by the conversion factor Multiplier A shown in the table for the appropriate year.
For instance, say you want to know if the value of your house has “kept pace with inflation.” Multiply the original price of the house by the Multiplier A factor shown for the year you purchased it.
Example: A house was purchased in 1965 for $25,000. Adjusting for price inflation, this price in terms of 2011 dollars is $25,000 x 7.1388 = $178,470. This is approximately how much the house would have to sell for today just to keep up with price inflation.
To convert 2011 dollars into past dollars, simply multiply today’s dollar amount by the conversion factor Multiplier B shown in the table for the appropriate year.


