Spring Ahead


These severe weather patterns disrupted economic activity and weighed on a wide range of economic indicators, including several of our BCC indicators. The result was a sharp decline in our March index of leading indicators to 67 percent—the lowest reading since September 2009—from 100 percent in the prior month.
In last month’s report, we stated our belief that much of the weakness was likely due to weather and our expectation that the economy, and our indicators, would rebound over the coming months. The reversal process seems to have begun, right on cue.
Outlook Brightening
Our Business-Cycle Conditions indicators improved in the latest month, partially reversing the decline from the prior month. The share of leading indicators that expanded in March rose to 75 percent, a gain of 8 percentage points from the prior month. Notably, the percentage of leaders expanding again stands above 50 percent—meaning that more than half of our leading indicators still suggest ongoing economic growth. We also note that an unusually high number of our indicators were judged to have a neutral trend—neither positive nor negative—reflecting the partial rebound from temporary weather distortions.
The cyclical score for the leading indicators, derived from a separate mathematical analysis, fell slightly, to 86 from 87 in the prior month. This result supports the notion that the economic outlook, while impacted by recent weather events, is still positive.
Key takeaways from the latest readings of AIER’s BCC indicators include:
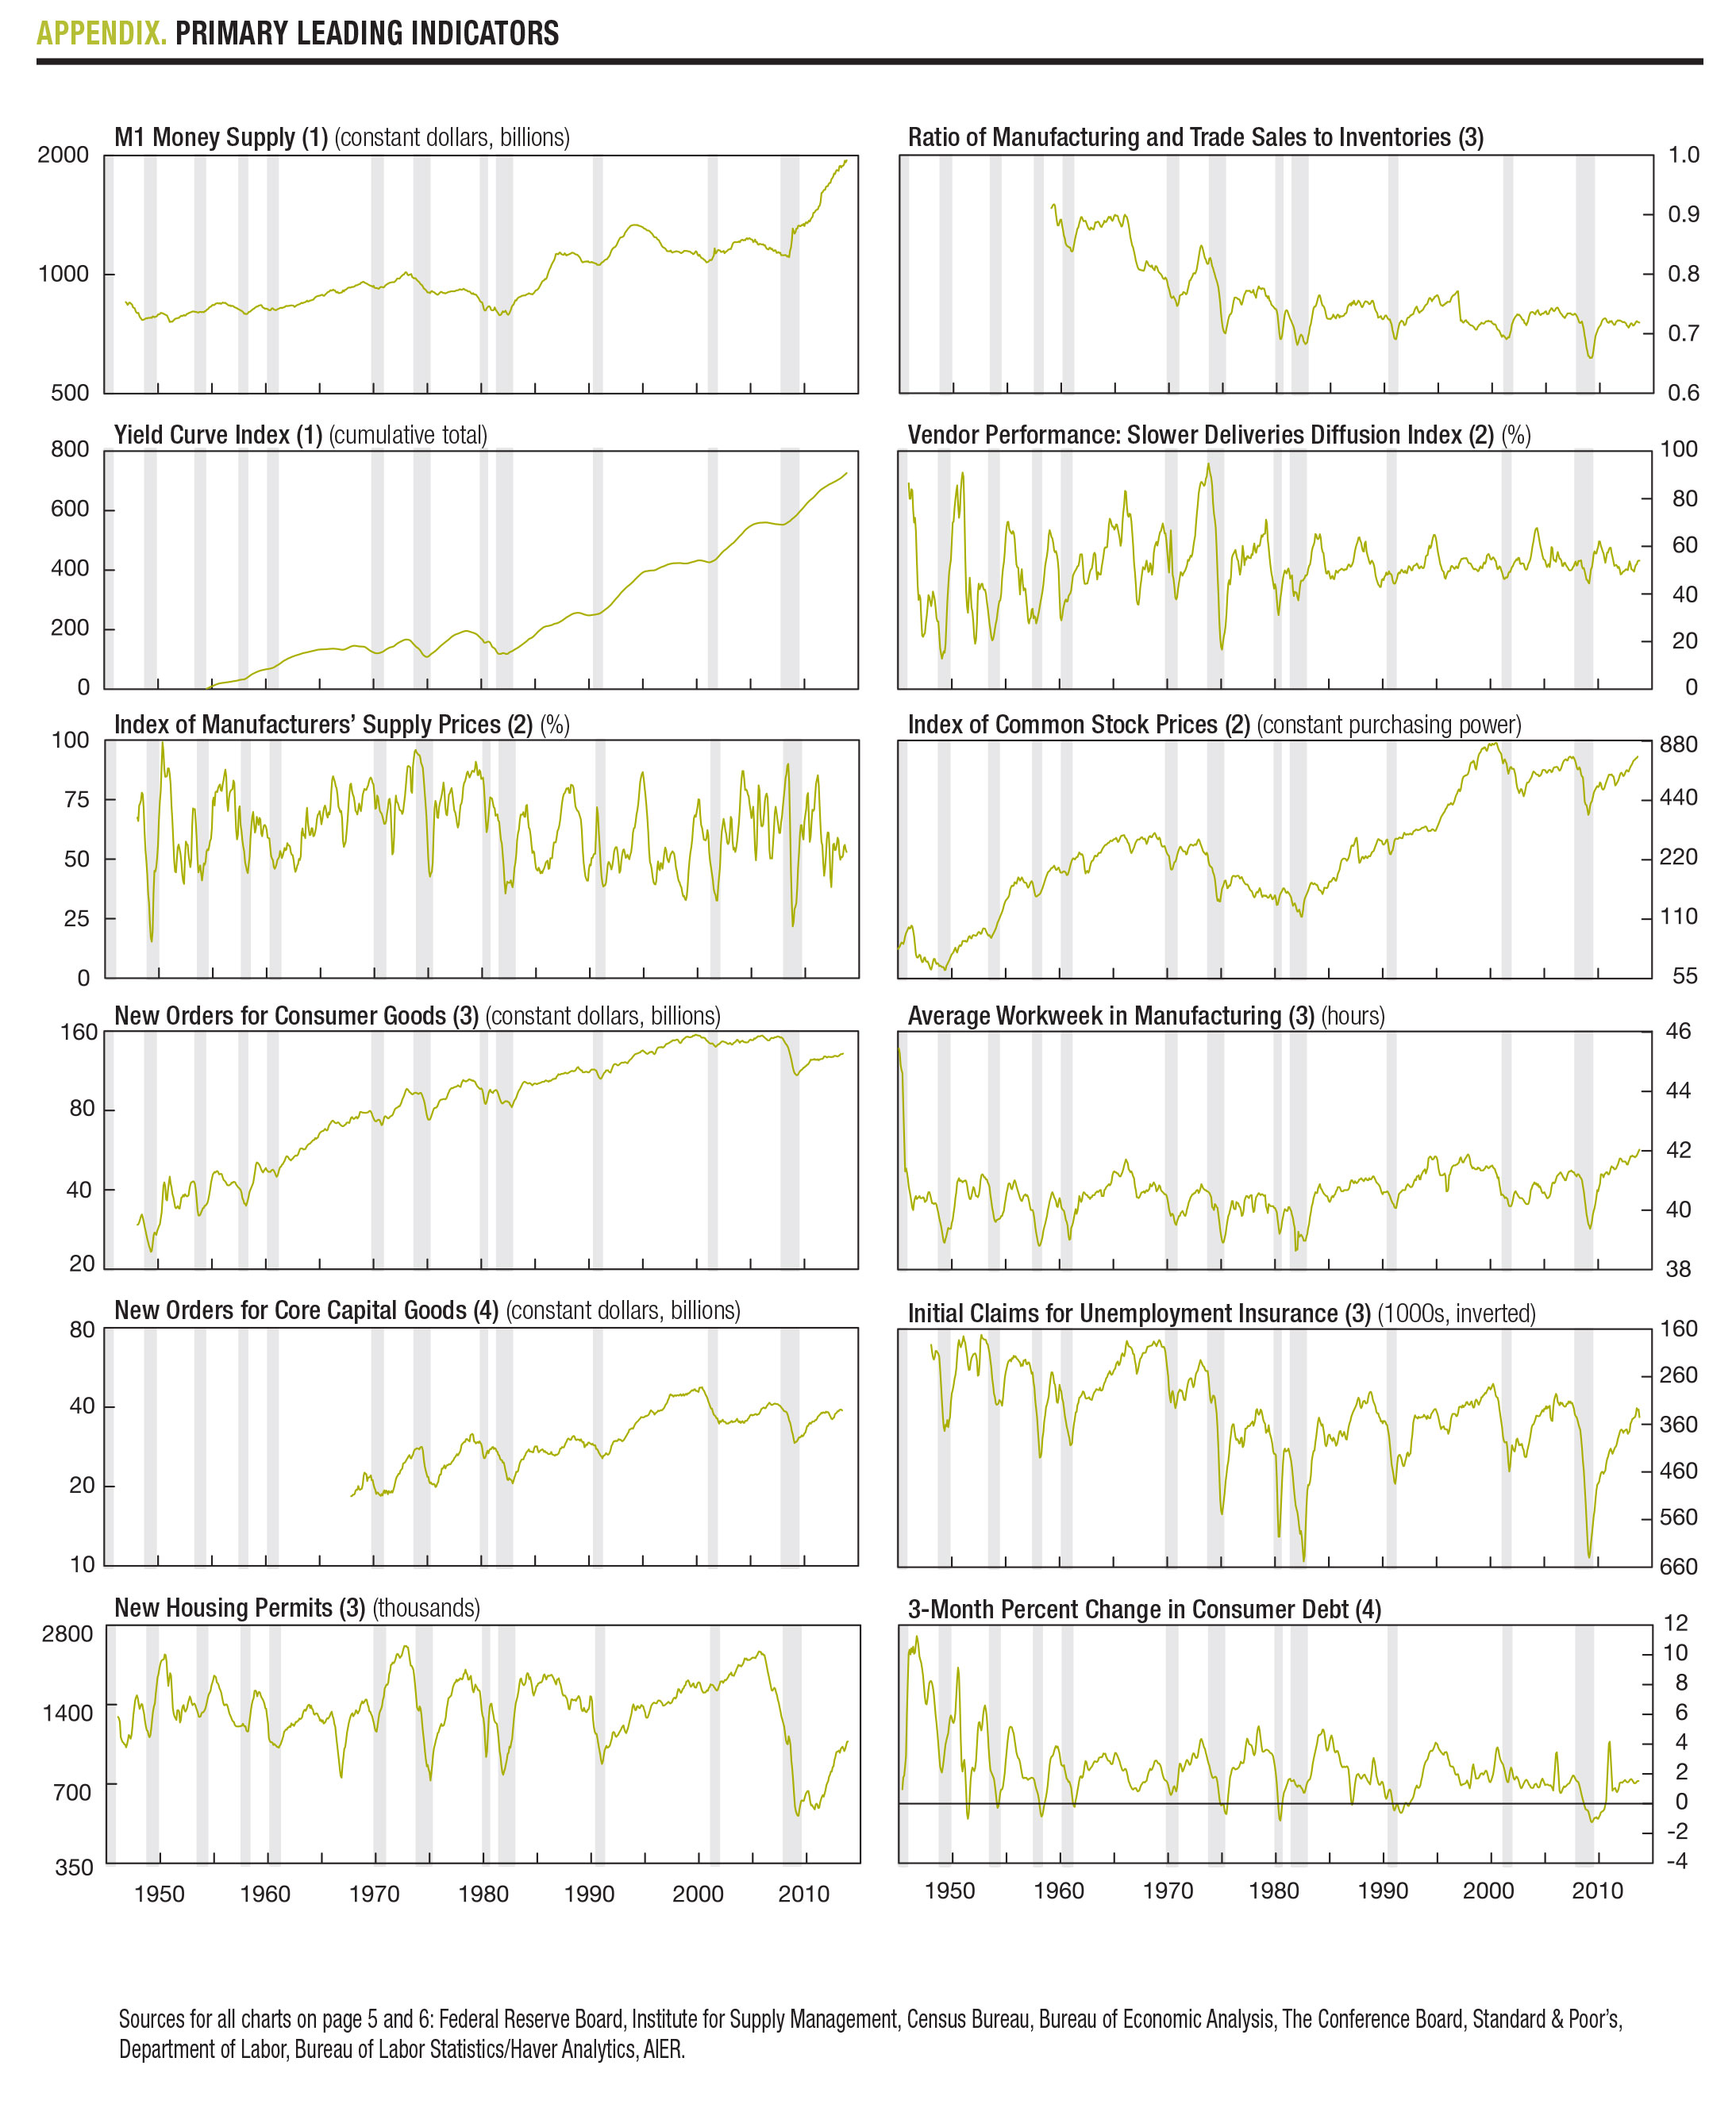
Leading: Among the leading indicators, six were judged to have a positive trend in February, with two of those six hitting new cycle highs: M1 money supply and the yield curve index. Conversely, two were judged to have a negative trend: new orders for consumer goods and average workweek in manufacturing. As mentioned above, four indicators were assessed as neutral, a result consistent with a higher degree of uncertainty in the economic data.
Coincident: Five out of six of our coincident indicators continue to show positive trends, resulting in a perfect 100 reading for the 27th month in a row. All five of these indicators also hit new cycle highs: nonagricultural employment, index of industrial production, manufacturing and trade sales, civilian employment to population ratio, and gross domestic product. Personal income excluding transfers was judged to be neutral last month.
Lagging: AIER’s index of lagging indicators weakened slightly last month as the portion of laggers that had a positive trend fell to 75 percent from 80 percent in the prior month. Among the individual indicators, change in labor costs per unit of output for manufacturing continued its negative trend in the latest month, while new highs were recorded for commercial and industrial loans, manufacturing and trade inventories, and the ratio of consumer debt to income. The composite of short-term interest rates and average duration of unemployment were neutral last month.
In aggregate: Fourteen of our 24 indicators were judged to have positive trends, with 10 again hitting new cycle highs last month; seven were considered neutral, and three remained in downtrends. Overall, our three composite indexes remain well above 50 percent, which suggests continued economic growth in the months ahead (Chart 1).
Housing Divergence
Housing Divergence
Along with the many traditional signs of spring—snow melting in the North, crocuses budding underfoot, the arrival of daylight savings time—is a modern-day harbinger of the season: “For Sale” signs sprouting across the landscape.
The housing market is widely regarded to be a good indicator of the broader economy because of its sensitivity to interest rates and the labor market. As a result, housing market data often are included in economic models, including our own Indicators of Business Cycle Conditions.
Given the housing boom, bubble, and bust over recent years, housing market data needs to be analyzed and interpreted carefully. Since the end of the recession in 2009, most housing indicators support the view of an ongoing recovery, but within the details, a more nuanced story emerges.
Total housing permits, one of our leading indicators, have risen about 90 percent from their cycle low of 478,000 in April 2009 to 907,000 in February 2014 (Chart 2). Within that total, there has been a sharp divergence between single-family units and multi-family units. Permits for new single-family home construction have risen 75 percent from their cycle low, while multi-family permits for new construction have jumped more than 300 percent (Chart 3). Within the multi-family segment, structures with five or more units have accounted for over 90 percent of multi-family construction over the past few years (Chart 4). These five-plus-unit structures that have become the rage have a couple of characteristics distinguishing them from traditional single-family homes: They tend to be in urban areas, and they tend to have a higher share of renters.
Renters Return
A quick look at historical rental market data shows that shifts in the popularity of renting versus buying is an important factor in both the single-family and the multi-family markets.
From 1985 through 1995, the proportion of all housing units that were rented held relatively steady around 36 percent. In 1995, that figure began to fall. Over the next 10 years, through 2004, the share of housing units rented fell to around 31 percent, with home ownership rates rising to 69 percent.
We believe there were a variety of drivers of that shift 10-20 years ago. First, a rising stock market, driven by the tech bubble, created substantial paper wealth that some investors converted into real estate. Next, efforts by politicians to increase home ownership, especially for lower-income families, converted some renters to buyers. Additionally, the combination of the Clinton tax reform that allowed more frequent capital gains exclusions on home sales and rising home prices likely drew more buyers out of the rental market as homeownership now included the possibility of short-term capital gains. Finally, easier lending standards that lowered the requirements for first-time home buyers likely amplified the shift away from renting to buying.
After hitting a low in 2004, the trend toward renting began to reverse, with the share of renters rising to around 35 percent currently (Chart 5). Just as the shift away from renting to buying contributed to the housing bubble, the return of the renter has resulted in a number of important divergences between the single-family market and the multi-family market.
No Vacancy
Going hand in hand with the quick recovery of construction activity in the multi-family segment have been falling vacancy rates for the multi-family rental market. These vacancy rates have retreated to nearly 30-year lows, and the low rates of vacancy are pushing rents higher (Chart 6).
Economic principles would suggest that as the tight rental market drives rents higher, more people will choose to move back to the home-buying market, where similar monthly outlays could buy them equity as well as a place to live. However, this process is likely to take a while. In the meantime, with vacancy rates low and rents rising, multi-family construction is likely to remain an important driver of growth in the housing market.
[pdf-embedder url=”https://www.aier.org/wp-content/uploads/2014/04/BCC20140401.pdf“]Robert Hughes

Robert Hughes joined AIER in 2013 following more than 25 years in economic and financial markets research on Wall Street. Bob was formerly the head of Global Equity Strategy for Brown Brothers Harriman, where he developed equity investment strategy combining top-down macro analysis with bottom-up fundamentals. Prior to BBH, Bob was a Senior Equity Strategist for State Street Global Markets, Senior Economic Strategist with Prudential Equity Group and Senior Economist and Financial Markets Analyst for Citicorp Investment Services. Bob has a MA in economics from Fordham University and a BS in business from Lehigh University.


