Slight Price Pressures Visible
The unemployment rate, average duration of unemployment, and long-term unemployment all decreased in the second quarter of 2014. Real disposable personal income continues to rise, up 2.3 percent in the last year. Non-revolving consumer credit (e.g., student loans and auto loans) continues to rise at over 8 percent annually. Home prices and equity values have increased, boosting households’ net worth.
For Digital or Print Copies of AIER Research, Click Here
The short-term forecast is for moderate persistent inflation. However, these indicators suggest that consumers may be more willing to spend rather than save, thus increasing upward pressure on prices. Unsurprisingly in July, the University of Michigan Inflation Expectation rose slightly, reversing the downward trend of the last several years, confirming a growth in inflation expectations.
Consumer Prices
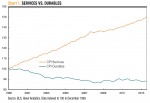
Consumer prices, as measured by the CPI, have increased 2 percent over the last year. But certain elements of inflation have accelerated faster than others, while some have shown no price increases at all. Specifically, there is a dichotomy between goods prices and services prices, as Chart 1 shows.
CPI Durables includes items such as cars, electronics, furniture, and sports equipment. These “big ticket” items are not purchased on an everyday basis and are expected to last at least three years. CPI Services includes things such as medical services and day care services, purchases that are consumed immediately.
Among durables, for example, the CPI for new and used vehicles is essentially unchanged since the middle of 2011. In contrast, the CPI for hospital services has increased 6 percent in just the last year. This type of difference is precisely the reason that we hear people complaining about price increases even during a period of low inflation.
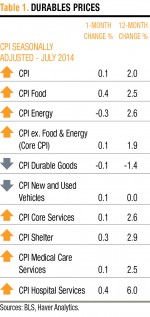
Table 1 provides CPI price changes in the last month and the last year. While many prices have increased between 2 and 3 percent in the last year, there was a decrease of 1.4 percent for CPI Durables. Durables represent about 9 percent of the overall CPI Index and help to restrict its overall increase.
Producer and Import Prices
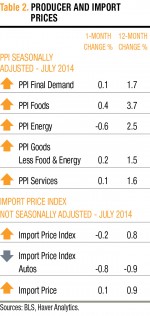
The PPI tracks how much producers receive for goods, which may offer a glimpse of future CPI. As Table 2 shows, the July PPI for finished goods increased by a seasonally adjusted 0.1 percent, a smaller increase than those seen earlier in the year. The year-over-year PPI increased 1.7 percent, and has maintained its range between 0.3 percent and 2.3 percent since April 2012. This indicates slow and steady inflation across the economy. That is not to say that low inflation is benign, as any inflation above zero can hurt personal finances in a world with near-zero interest rates.
Import prices have continued to put downward pressure on overall prices. Import prices have increased less than 1 percent in the last year and have shown little to no price increases since 2011. There exists a relationship between import prices and durables’ prices. Many imported products include durable items such as electronics and cars.
Supply Measures
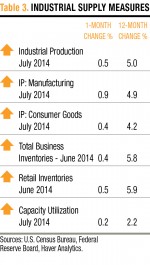
When supply is unable to keep pace with demand, prices can increase. On the other hand, as demand for goods and services increases, a subsequent increase in supply can help lessen inflationary pressures. That is what is happening now. The production and manufacturing of durable goods, for example, has increased at fast enough rates to restrict price increases. The Industrial Production Index indicates that expanded production has increased supply by 0.5 percent in July and 5 percent year-over-year.
The Industrial Production Index has been expanding since mid-2009 and has once again reached a new all-time high. Supply seems to have maintained pace with demand to this point. Likewise, capacity utilization increased 0.2 percent to 79.2 percent in July, the highest level since June 2008. But without an expansion of manufacturing capability, continually increasing capacity utilization will eventually lead to manufacturing bottlenecks. Currently, there may be limited room for capacity expansion before a bottleneck is reached and supply begins to struggle to keep pace with demand, which has led to price increases in the past (See Chart 2).
Measuring the supply of services is more difficult, but one way to approximate it is to look at the level of employment in services. As the number of employees in service-producing jobs increases, the labor supply tightens. This creates a supply constraint that can cause prices to rise. Chart 3 shows that service-providing industry employment has seen a steady upward trend that can indicate the possibility of price pressures in service-providing industries.
Demand Measures
As the economy slowly improves, consumer demand increases, potentially causing increased pricing pressure. Real discretionary income, the amount of income left for spending after saving and basic needs, has been rising. Real discretionary income has increased by an average of 1.7 percent annually over the last five years. This measure is adjusted for inflation, meaning that nominal, or unadjusted, discretionary income has increased at an even faster rate.
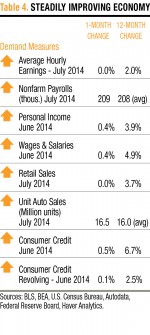
Revolving consumer credit, such as credit cards, has grown by 2.5 percent in the last year, as Table 4 shows. This remains about 15 percent below its peak in mid-2008. All consumer credit, including non-revolving credit, has risen by 6.7 percent in the last year. All of these indicators of demand suggest a steadily increasing demand for products and services.
[pdf-embedder url=”https://www.aier.org/wp-content/uploads/2014/10/IR20140903.pdf“]
