Rebound May Bring Higher Prices


Throughout this recovery, people have feared a return to recession. Instead of a second downturn, the economy went into a soft landing in the fourth quarter of 2012, with GDP growth slowing nearly to a halt. (See chart below.)
The slowdown resulted in weakness in headline CPI from November to April, with February being the single exception. This accounts for consumer prices rising only 2 percent over the last 12 months. But this is changing as the economy slowly rebounds.
June’s CPI increase annualizes to 2.4 percent. While this is hardly runaway inflation, consumer prices have risen for three months in a row. Expanding demand for a wide range of goods—from large-ticket items to nondurable merchandise—is being translated into modestly higher prices.
The energy index has risen 4.7 percent over the last 12 months, with this month’s increase representing fairly uniform advances in the prices of all
major energy commodities and services.
The economic rebound is supported by the Federal Reserve’s continuing expansionary monetary policy and a recovering world economy.
This is an economy that is returning to a normal inflationary pattern.
Consumer Prices
The CPI rose by 0.2 percent after seasonal adjustment, the third monthly increase. This was the result of broad-based increases rather than an increase in a single category.
Higher CPI prices came about despite weak consumer demand. As demand increases in the second half and beyond, supported by accommodative monetary policy and rising consumer confidence, we should expect an acceleration of prices.
The recently released minutes of the July 30-31 Federal Reserve Open Market Committee (FOMC) meeting support this projection.
Some of the FOMC members—the committee members who sit on the Fed board and are responsible for making monetary policy—feel that the recent low inflation rates are unlikely to persist and that reported inflation numbers may be revised upward later. They suggest that as transitory factors recede and the pace of recovery improves, inflation as measured by the Fed’s target index could double relatively quickly.
The factors that have been keeping inflation low are transitory because the U.S. economy is recovering from the burdens of new taxes and reductions in government spending. In addition, we are now operating in a recovering world economy.
The U.S. enjoyed some economic serendipity this month when, as a category, energy prices rose by only 0.2 percent because of offsetting changes in the prices of energy goods. Increases in gasoline prices (up 1.0 percent) and fuel oil (up 1.1 percent) were offset by lower residential natural gas (down 2.8 percent) and electricity prices (down 0.3 percent).
There was some upward pressure on prices elsewhere. Housing market improvements led to shelter prices rising 0.2 percent. Apparel sales were particularly good last month, with the increased demand resulting in price pressure. The price rise of 0.6 percent was the third monthly increase in a row. Food prices were mixed. The prices of medical care commodities rose 0.4 percent.
Overall, though, a lot of price changes in both directions cancelled each other out, and the CPI increase matched the Core CPI increase.
Core CPI, which excludes food and energy, is not as susceptible to random swings as the headline index. Core CPI rose 0.2 percent in July. As with the CPI, this is the third increase in as many months, and it confirms the increase in the broader headline CPI.
AIER’s Everyday Price Index (EPI) rose by 0.1 percent in July, following increases of 0.3 and 0.5 percent in May and June. This index measures the prices of commonly purchased goods and services paid at the cash register. Small reductions in food and energy prices this month explain the small increase. Purchases of food and beverages make up 38 percent of the typical American’s daily expenditures, while purchases of motor fuel and transportation make up 20 percent.
Wholesale Prices
Softness in prices resulting from the slowdown was evident at the wholesale level as well. Seasonally adjusted, the Producer Price Index for Finished Goods (PPI) was unchanged in July, after rising 0.8 percent in June and 0.5 percent in May.
The major factor was energy prices, which declined 0.2 percent after rising 2.9 percent in June. Led mostly by the 3.9 percent decrease in the prices of residential natural gas, this month’s figure may be dominated by transitory factors.
Core PPI, the finished goods index less food and energy prices, rose 0.1 percent in July, its ninth consecutive increase. Rising prices of pharmaceutical preparations, light motor trucks, and communication equipment were key factors.
Weak world markets kept the pressure off intermediate goods, as the prices of materials and components for manufacturing fell by 0.4 percent. But we continue to feel price pressure from last year’s drought in the prices of prepared animal feeds, which rose 4.9 percent. In fact, the prices for intermediate food and feeds rose 1.2 percent in July, the largest increase since August 2012.
Energy price pressure appears in intermediate goods. Intermediate energy goods prices advanced 0.3 percent, the third monthly increase in a row.
At the crude level, energy prices are still a dominant factor. July’s crude materials price increase was mostly due to a 4 percent increase in the price of crude energy materials, a 10.6 percent increase in crude petroleum prices, and higher prices for coal. Crude materials prices rose 1.2 percent in July, and 3.5 percent for the three months ending July.
Demand
Last month, we reported that second quarter GDP numbers had just been released, showing 1.7 percent growth. An August 29 Bureau of Economic Analysis release revised the second quarter estimate to a more encouraging 2.5 percent, exceeding the 2.2 percent consensus forecast of economists. This is yet another sign of continued expansion, a recovering private sector, and modest inflation ahead.
Taken at face value, the most recent data suggests both a decline in buying power and a decline in the potential for robust consumer spending. For June, the most recent month for which we have data, personal income increased $45.4 billion, or 0.3 percent, unadjusted for inflation. The same measure after taxes and transfers, disposable personal income (DPI), increased $33.6 billion, also 0.3 percent. After inflation, (real) DPI fell 0.1 percent.
Digging into the underlying data shows why expansion remains on the horizon, and with it, modest inflation growth.
Consumers must have jobs to have paychecks to spend, and jobs are coming back. In July, 36 states and the District of Columbia had unemployment rate decreases from the previous year. Monthly growth in private wages and salaries nearly doubled in June to $38 billion from $19.1 billion in May, with bigger increases in the services industries than elsewhere.
In addition, the growth of government net transfers slowed and made up a smaller portion of household incomes. Transfers increased $6 billion in June, down from an increase of $18.4 billion in May. Among these transfers, payments to Social Security beneficiaries increased $4.2 billion, down from an increase of $11.5 billion in May.
All in all, there has been an increase in buying power, with less of it coming from transfers. This is a sign of a strengthening economy.
However, data from this same period show that consumer spending is relatively weak, increasing $59.4 billion, or 0.5 percent, in June, after rising 0.2 percent in May. After inflation adjustment, real consumer spending increased only 0.1 percent in June.
Consumers remain optimistic, and optimism, like increases in income, will translate into spending. The Conference Board’s Consumer Confidence Index is over 80 percent (80.3), as is the University of Michigan’s Index of Consumer Sentiment (85.1). Both are trending upward.
AIER’s proprietary Primary Leading Indicators point to future expansion, with 83 percent of the indicators rising, and the Conference Board’s Leading Economic Indicators rose 0.6 percent in July. At the FOMC meeting, participants predicted in June that gross domestic product would grow this year from 2.3 percent to 2.6 percent. All the models point toward an accelerating expansion and rising price pressure in the future.
Supply
The growth of supply has been stagnant at best.
In the face of weak demand during July, producers reduced the use of their capacity by 0.1 percentage point, for a 77.6 percent capacity utilization rate. This is 0.3 percent less than last year’s level. Total industrial production was flat after rising 0.2 percent in June, and manufacturing production declined 0.1 percent. Compared to a year ago, total industrial production in July was a modest 1.4 percent.
If supply does not begin to accelerate sufficiently as demand increases, inflation rates will rise. For now, the weakness surrounding consumer goods production seems to be a response to slowing demand and the working off higher inventory levels coming out of the first half. Overall, consumer goods production fell 0.5 percent in July, with durable consumer goods falling 1.5 percent and nondurables falling 0.2 percent. As inventories decrease and consumer spending revives, production should come back stronger.
Consistent with the recovery of the housing market, production of construction supplies rose 0.5 percent, 4.4 percent more than a year ago, a bright spot in the supply picture.
As with demand, a deeper look reveals a strengthening outlook. Businesses are enjoying higher productivity. Nonfarm productivity rose 0.9 percent (annualized) in the second quarter. Higher productivity means higher capacity: The increase in productivity reflects a 2.6 percent increase in output. This means that capacity utilization could fall even as output increases.
On a quarterly basis, manufacturing productivity showed the most growth: It rose 2.7 percent in the second quarter. Manufacturing output rose only 0.1 percent, but hours worked fell 2.6 percent. Quite simply, manufacturers were able to produce more with less. Combined with weak demand, these productivity gains should help contain price inflation in manufactured goods for the near future.
While this was good for competitiveness and prices, productivity growth was not so good for job creation. Over the last four quarters, for example, manufacturing productivity increased 2.2 percent, output increased 2.1 percent, and hours decreased 0.1 percent.
International
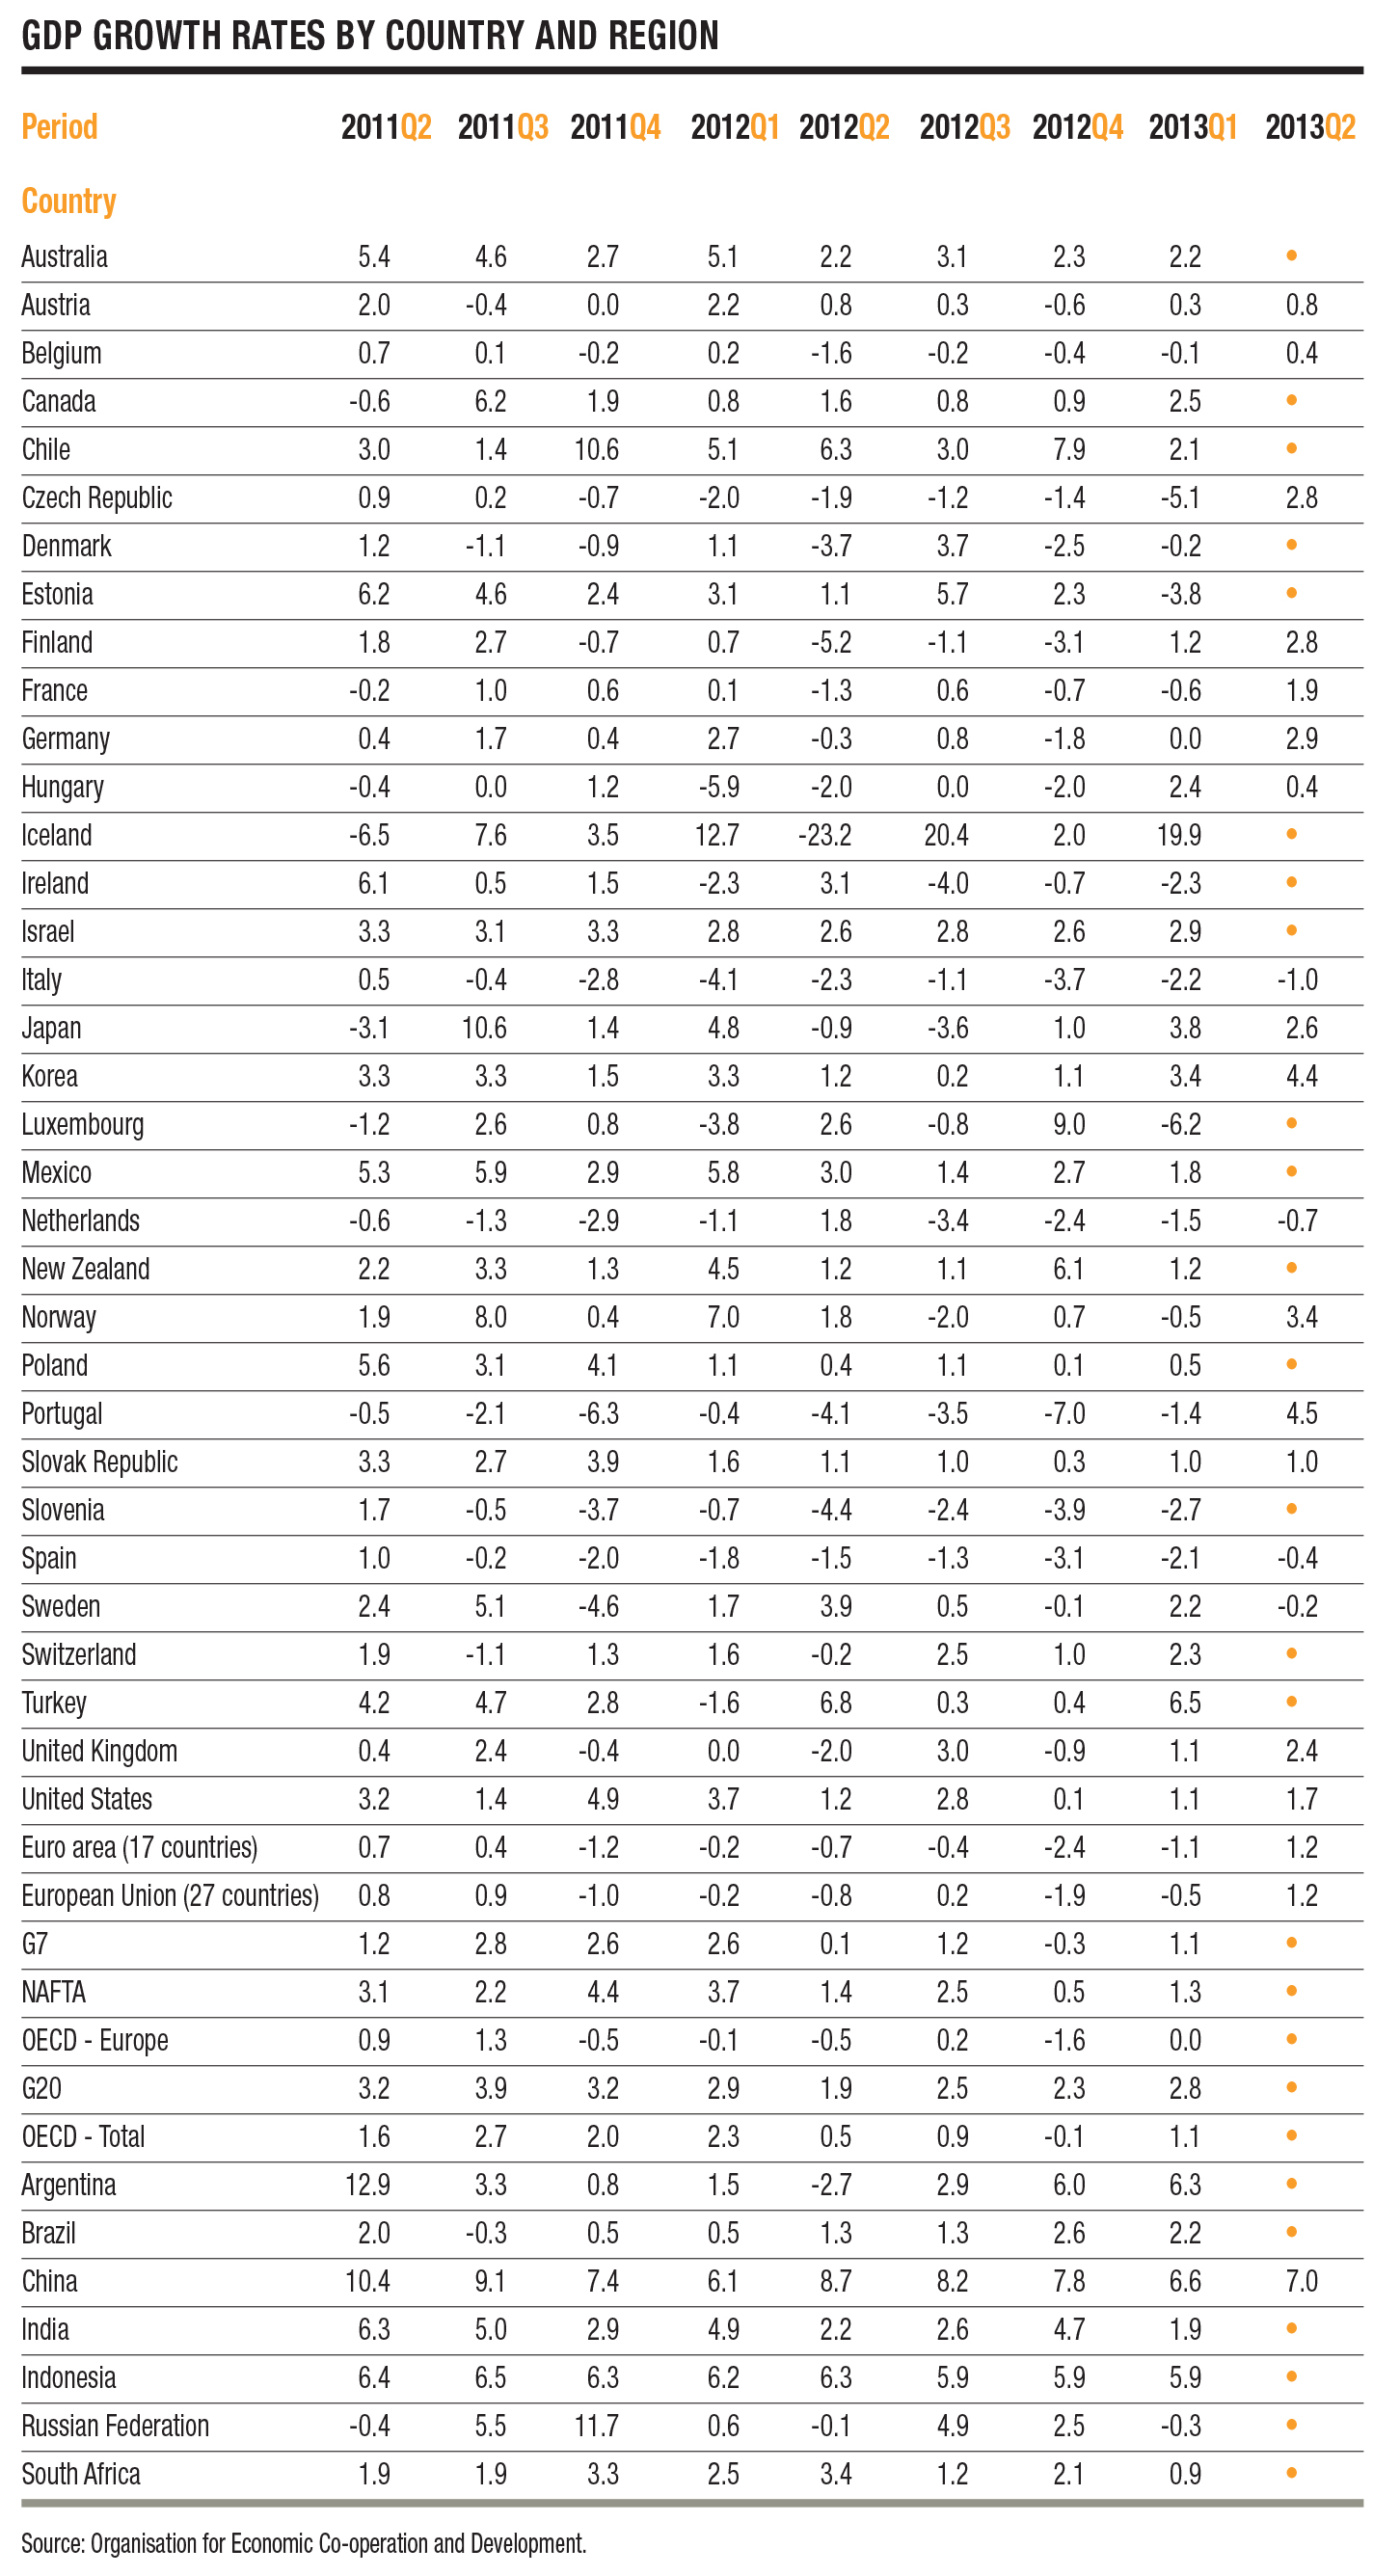
Early numbers suggest that Europe is coming back from recession and that Asia is coming back from slowdown. (See table, right.)
In the most recent quarter, the Eurozone grew at 1.2 percent after six quarters of decline, and China’s manufacturing sector shows signs of picking up steam. This will bring firming prices on exports, as well as increased demands for energy commodities. At press time, Brent Crude Oil was approaching $115 a barrel, and WTI Crude was over $107.
This implies higher energy prices and, eventually, higher prices for imported manufactured goods coming into the United States.
This will contribute to a broad-based firming of prices. In fact, according to the Bureau of Labor Statistics, prices for U.S. imports rose 0.2 percent in July after falling for four months.
Imported capital goods, fuels, feeds, and beverages all went up, while nonfuel industrial and vehicles fell in price. The increase was largely driven by fuel prices, which went up by 2.5 percent after falling 1.7 percent in May and 0.8 percent in June. Petroleum prices rose by 3.2 percent, while natural gas fell by 13.6 percent.
Nonfuel prices continued their decline for the fifth straight month, falling 0.4 percent in July.
As the world economic recovery broadens and accelerates, it will bring higher incomes, higher demand, and higher inflationary pressures. This will support the U.S. recovery, but will also open the door to domestic higher inflation rates.