Private Sector Soldiers On


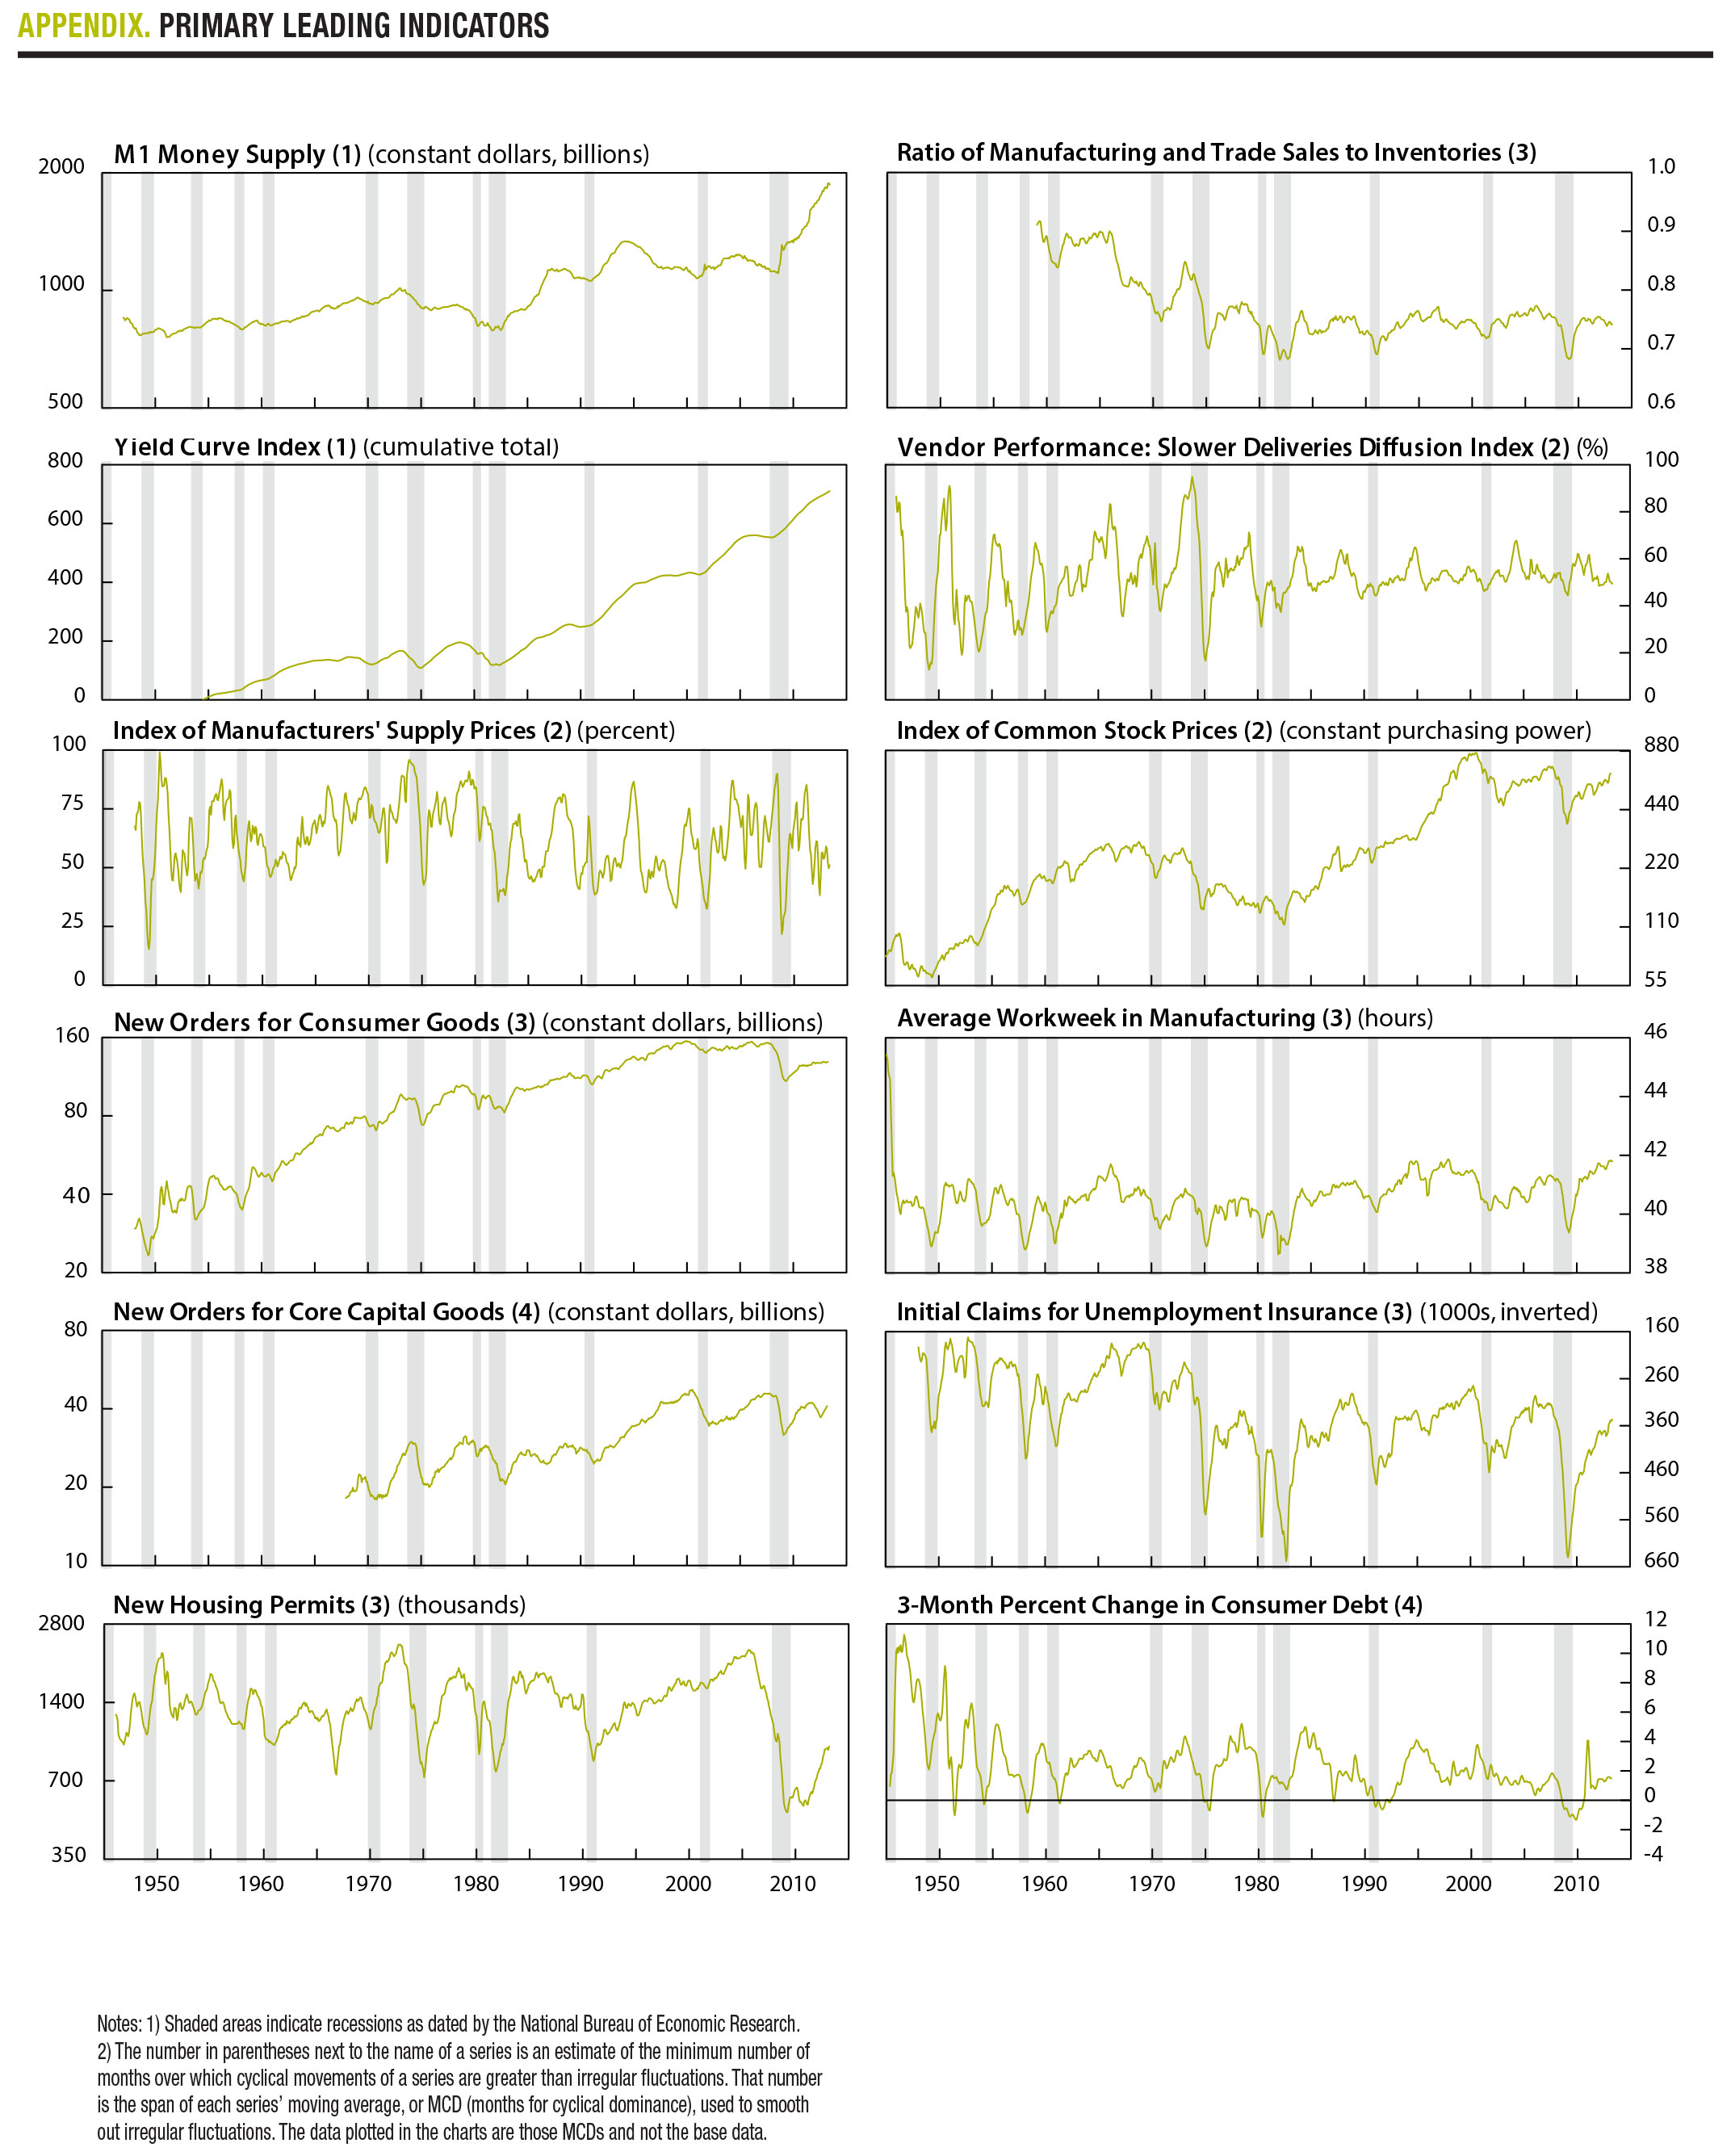


Despite employment woes, the recovery remains intact. AIER experts find that 82 percent of our leading indicators (9 out of 11 for which a trend is apparent) are expanding—practically unchanged since last month’s score of 83. The cyclical score of leading indicators, derived from a separate, mathematical analysis, increased marginally last month to 88 from 83. Values above 50 suggest that economic expansion is likely to continue.
AIER’s coincident and lagging indicators confirm a steady expansion of the U.S. economy with 100 percent expanding.
Several leading indicators show that the recovery is firm. The number of new housing permits issued per month continues the steady rise that began in early 2011, though the level remains far below where it was before the recession.
New orders for consumer goods remains on an upward trend that began in March 2009, when this measure of consumer demand was at its lowest point since the 1991 recession. New orders for capital goods, our leading business indicator, has been steadily rising since the second half of 2012. It now stands at approximately $41 billion, where it was in early 2006, but it remains 9 percent below its prerecession peak.
Even the beleaguered jobs market is improving—at least when it comes to the private sector. The average workweek in manufacturing, one of our leading labor market indicators, stands at 42 hours, the highest since 2000. Employers in the manufacturing sector are buying more labor hours to expand production. At the same time, initial claims for unemployment insurance has been steadily falling since February 2009, four months before the recession ended.
Meanwhile, commercial and industrial loans, a lagging indicator, has been on a steady rise since early 2011. Businesses are borrowing to expand future production, as confirmed by the recent rise in the Purchasing Manager Index (PMI), produced by the Institute of Supply Management. After a dip in April and May, the PMI increased by 2.2 percentage points in June to 50.9—the sharpest one-month increase over the last year. A rising PMI means that employers are expanding production.
However, economic growth is being blunted by continued federal government job losses. Total government employment has been declining since May 2010, two months after private sector employment started rising. The sharpest drop began in May 2010: 735,000 government employees lost their jobs within a span of four months.
Public employment continues to decline. Over the last 12 months, the federal government cut its workforce by 65,000. This shaved 0.4 percent from total employment growth between June 2012 and June 2013. Employment growth has failed to reach 2 percent since the recovery began, one reason why unemployment has remained stubbornly high.
As of June 2013, total government employees, excluding military personnel, stood at 21.8 million compared to 22.6 million when the recession ended in June 2009. This contrasts with past recoveries, according to a recent study by the Economic Policy Institute, a nonprofit American think tank based in Washington, D.C.
The study compares the changes in government employment after the four recent recessions. After the recessions of 1981, 1991, and 2001, government employment increased by between 1 and 3 percent, helping to boost the recoveries. This gave the private sector some time to regain lost ground and eventually increase hiring.
After the most recent recession, government employment declined approximately 5 percent between May 2010 and June 2013. This slowed the pace of recovery and put additional pressure on the private sector to lower the unemployment rate.
The effect of rising public sector unemployment on the private sector is small, particularly when nonfarm payroll increased by 162,000 in June. In addition, federal spending cuts mandated by the 2011 Budget Control Act, which went into effect on March 1, have not yet resulted in more large-scale reductions in the federal payroll. Nevertheless, government employment will continue to decline as more spending cuts are implemented, meaning the number of government job losses will increase over time.
The cuts in the 2013 federal budget amount to only $85 billion—only 2.3 percent of total federal spending. But similar cuts are planned for every year until 2021, according to the Congressional Budget Office, implying a continued decline in government employment.
Cuts in planned federal government spending affect state budgets as well because many states depend on the federal government for some form of financial support. In all cases, states will receive less federal aid than expected, but the effect of the sequester will vary.
The March 1 sequestration will result in losses for some states. Massachusetts, for example, will receive $308 million less aid than the amount received in 2012, and 0.79 percent below what was expected. However, other states will receive more aid than last year. Despite the sequester, for example, Florida still will receive $571 million more federal aid than the amount received in 2012. This amount is still 0.84 percent below what was expected.
It is too early to know the precise employment effects of these cuts, but the possibility of reduced workforce and fewer working hours for state government employees in some states remains.
For now, a shrinking government sector means no paychecks for displaced government workers. This will reduce consumer spending on private sector goods and services, which in turn leads to lower labor demand. In addition, as federal spending slows, the government’s demand for private sector goods and services will be affected. This means less profit for the private sector and fewer private sector jobs. By confronting the federal budget deficit, lawmakers are explicitly choosing to trade some short-term economic growth for small improvements in the nation’s fiscal health. So far, the private sector appears to be growing just fast enough to withstand the effects.
NIPA Revisions Show Higher GDP —Julie Ni Zhu, Senior Research Analyst
The Bureau of Economic Analysis recently released the 14th revision to the National Income and Product Accounts (NIPA), the government’s measure of the U.S. economy. The BEA has revised NIPA about every five years since 1942 to keep pace with economic and technological changes and to offer better estimates of economic activity.
The revisions affect the numbers reported in most of AIER’s indicators for business-cycle conditions. The revised figures will appear in the September issue of the Business-Cycle Conditions report. This month’s report is based on pre-revision data.
The latest revisions do not change the general patterns of business cycles. (See chart.) But by incorporating new methods and new data, they increase the apparent size of the economy, causing the 2012 nominal Gross Domestic Product (GDP) to be revised upward by $559.8 billion.
Two changes constitute 84 percentage points of this upward revision:
• Recognition of research & development spending as a business investment rather than an intermediate expense accounted for 71 percentage points of the increase in GDP.
• Recognition of expenditures in the creation of entertainment, literary, and artistic originals as a business investment rather than an expense added 13 percentage points to the increase in GDP.
[pdf-embedder url=”https://www.aier.org/wp-content/uploads/2014/01/BCC_August2013_0.pdf“]

