October Business Conditions Monthly


AIER’s Business Cycle Conditions Leading Indicators index improved in September, hitting 88 following 83 in August. The Roughly Coincident Indicators index held at a perfect 100 reading while the Lagging Indicators index also held steady, posting an 83 (see chart below). The AIER business cycle indicators suggest broad-based economic expansion and support a positive outlook with a low probability of recession.
The current expansion has helped strengthen consumer and corporate balance sheets. Debt levels are relatively low, while the combination of low interest rates and moderate income gains have kept debt service near multi-decade lows. Federal debt and worsening deficits remain a significant risk.
Other lingering concerns include the impact of tariffs and other trade policies and the typical late-cycle risk of accelerating price increases. For now, the outlook remains positive, but careful monitoring of potentially destabilizing risks is warranted.
Leading Indicators Rose in September, the Second Monthly Gain in a Row
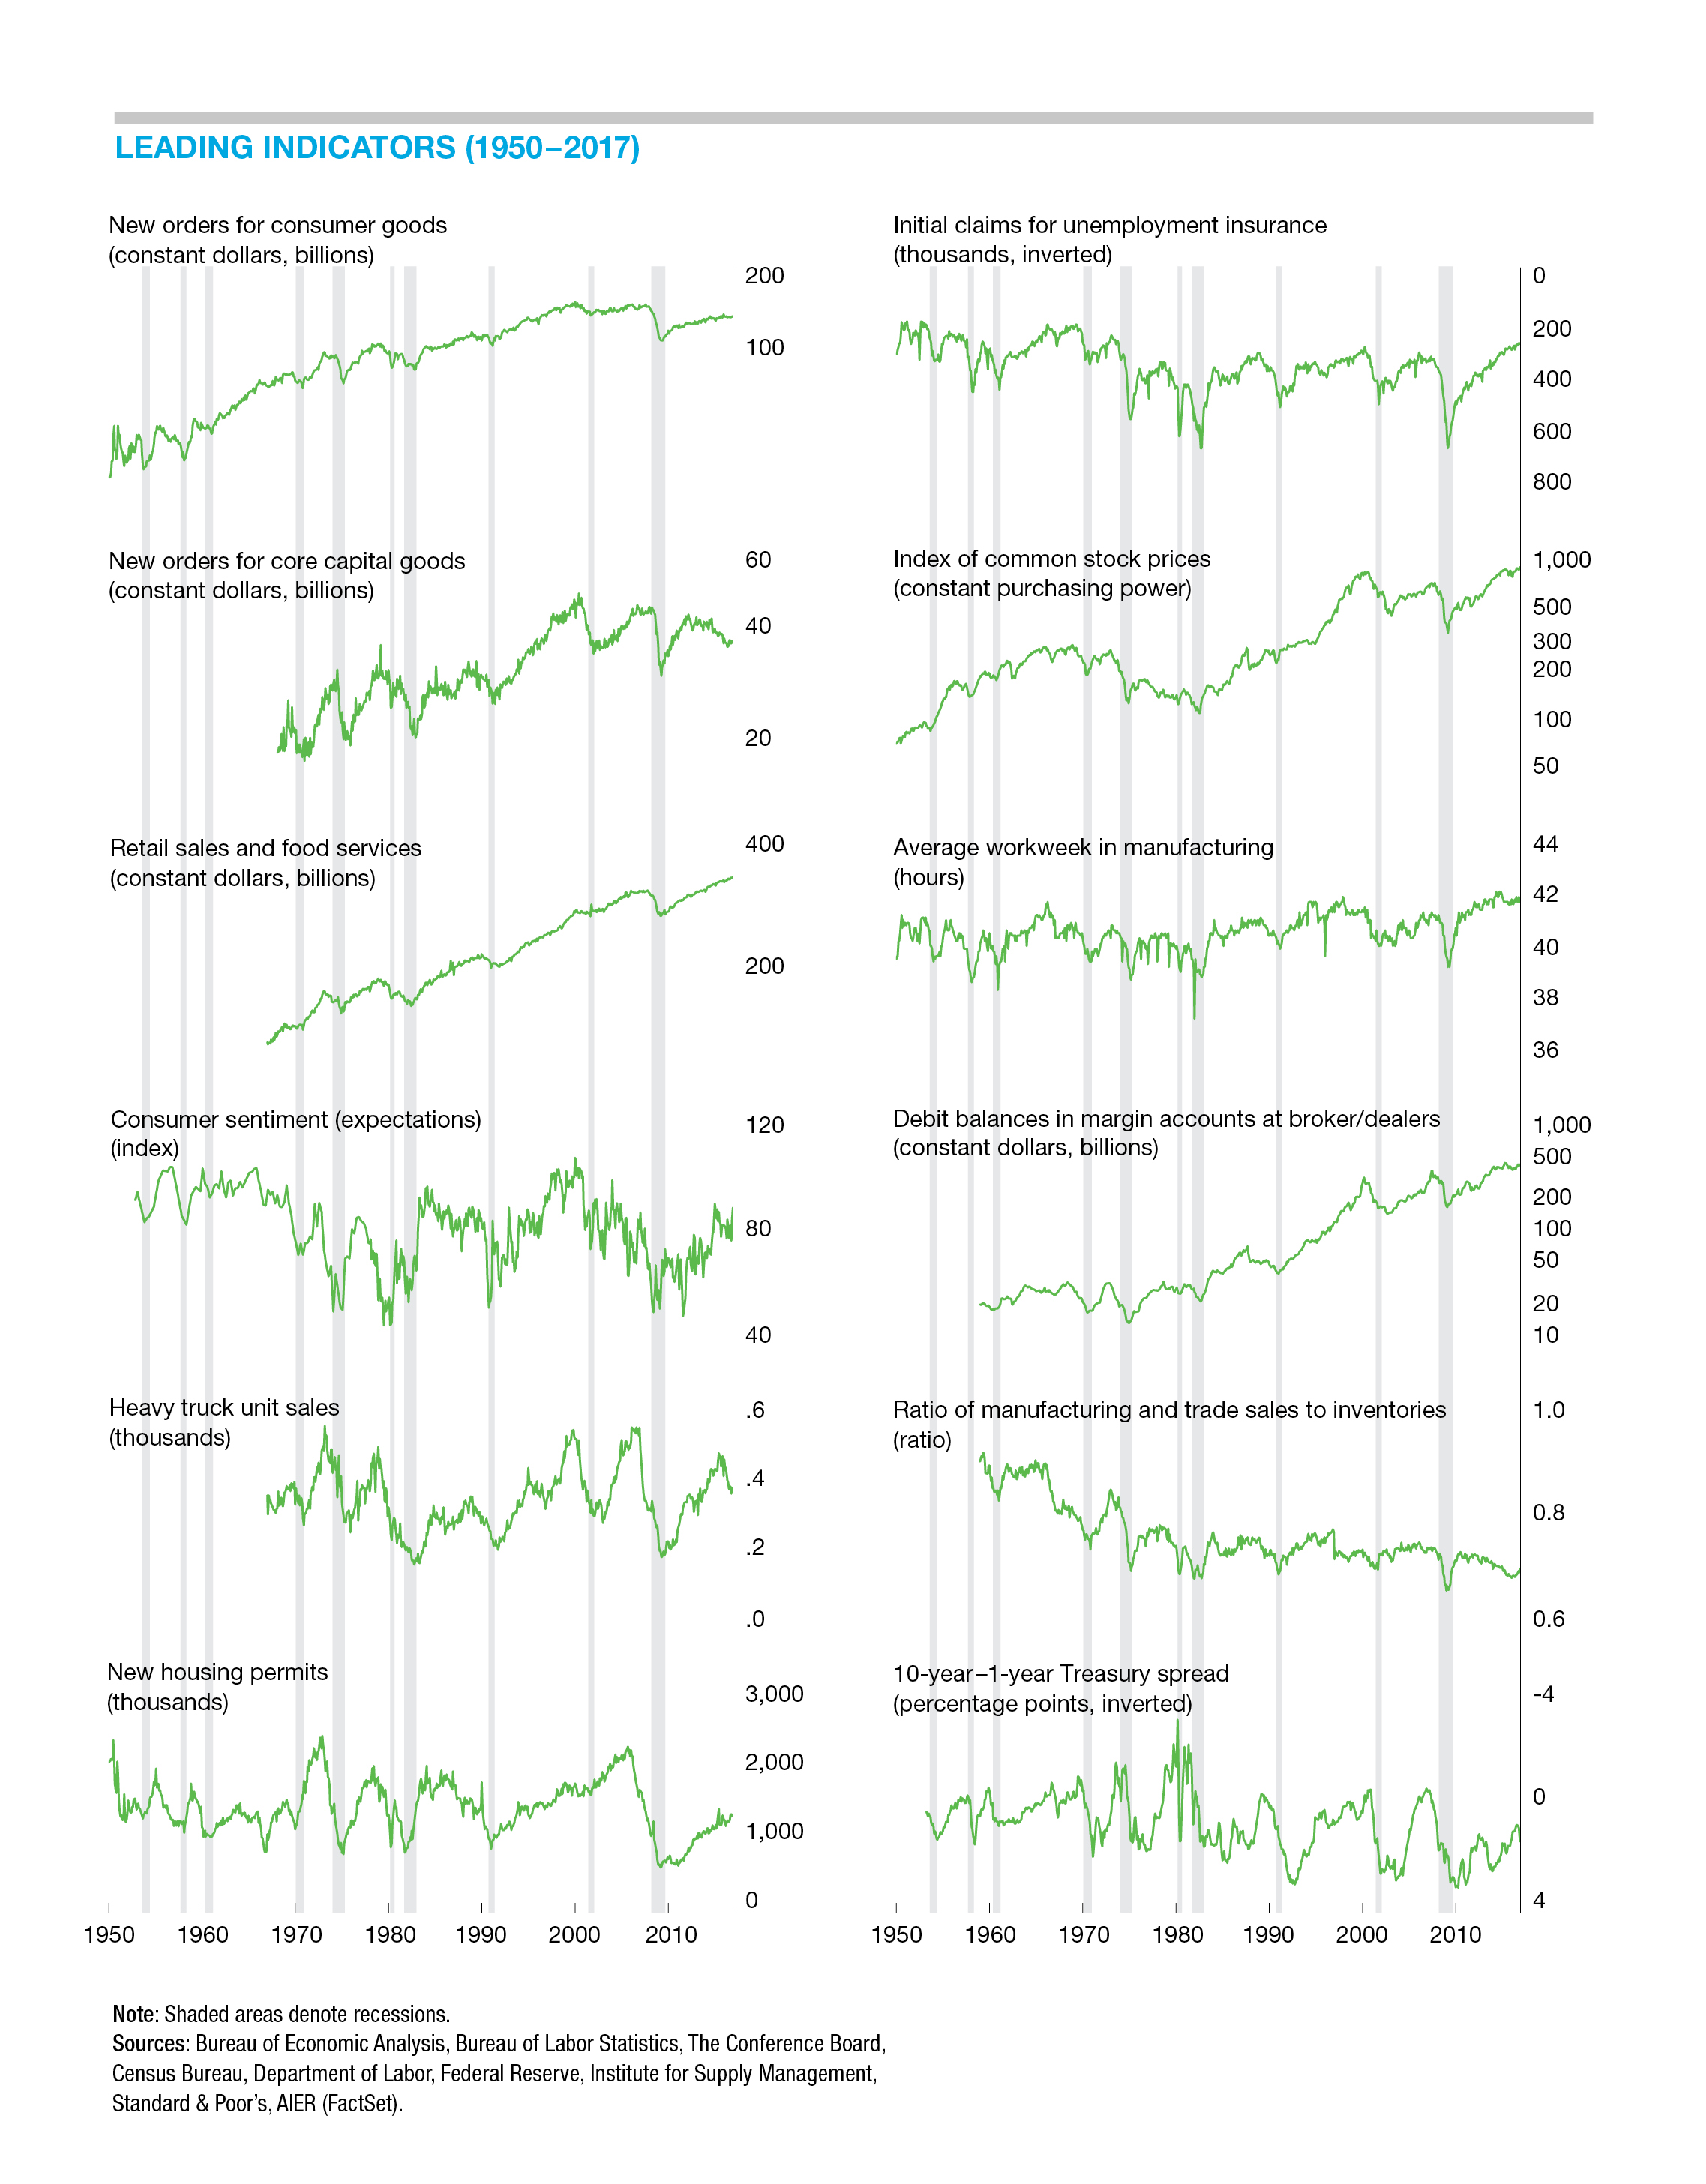
The AIER Leading Indicators index had just one change in September among the 12 indicators. The University of Michigan Index of Consumer Expectations returned to a positive trend after two months in a neutral trend. Consumer sentiment overall remains near record levels, supported by a strong labor market, low unemployment rate, relatively low increases in consumer prices, and gains in wealth.
Housing permits remained in a downtrend in September after turning downward in August and neutral in June. As discussed over the last few months, the housing market appears to be struggling with a combination of elevated home prices and rising interest rates. While affordability overall remains favorable, it has become significantly less favorable over the past few years. With interest rates likely to drift even higher over coming months and quarters, the outlook for housing is cautious.
Ten of the remaining 11 indicators maintained a positive trend in September, with debit balances in margin accounts trending sideways.
The Roughly Coincident Indicators index held at a perfect 100 in September. The index has hit perfect 100s in 15 of the past 19 months, with the most recent dip below 100 occurring in June. The strong performance of the index is consistent with the majority of economic data, from both public and private sources, that suggest the economy is performing well. With a duration of 112 months, the current economic expansion is the second-longest on record. The record will be broken if the current expansion continues through next June.
AIER’s Lagging Indicators index also held steady in the latest month, posting a reading of 83. September is the third month at that level following three months at 92 from April through June. Overall, four indicators are trending higher, none are trending lower, and two are neutral. Real manufacturing and trade inventories as well as real nonresidential construction remained neutral in the latest month.
The three AIER business cycle indicator indexes are well into favorable territory, suggesting a continued positive economic outlook with a low probability of recession in the coming months.
Consumer and Corporate Balance Sheets Remain Healthy
Household net worth hit a record $106.9 trillion in the second quarter, according to the latest data from the Federal Reserve. That is a gain of 2.1 percent over the first quarter. Total household assets rose 1.9 percent to $122.7 trillion as nonfinancial assets rose 1.8 percent to $34.9 trillion and financial assets rose 2.0 percent to $87.8 trillion.
Total household liabilities rose 0.8 percent in the second quarter to $15.7 trillion. Mortgage debt, which accounts for 65 percent of total liabilities, rose 0.6 percent to $10.2 trillion while consumer credit, 25 percent of total liabilities, rose 1.4 percent to $3.9 trillion. Owners’ equity in real estate reached 59.87 percent in the second quarter, the highest since 2002.
The personal savings rate, measured as a percentage of disposable income, was 11.0 percent in the second quarter. That compares to a 6.8 percent rate calculated by the Bureau of Economic Analysis, which uses its own definitions and data. Both series tend to be quite volatile. Measured as a three-year average, the savings rate from the Federal Reserve is 10.7 percent while the rate from the BEA is 6.9 percent, more than 400 basis points lower. Both sources suggest the savings rate has improved significantly from the early 2000s but remains well below rates from the 1970s.
The combination of moderate debt growth, moderate income growth, and relatively low (but rising) interest rates has helped keep the financial-obligations ratio (minimum payments of all financial obligations as a percentage of disposable income) at a relatively low 15.3 percent, below the 35-year average of 16.5 percent and well below the peak of 18.1 percent in 2007. The narrower debt-service ratio came in at 9.8 percent for the second quarter, below its 35-year average of 11.3 percent and well below the peak of 13.2 percent from 2007.
On the corporate side, nonfinancial corporate liabilities rose 5.5 percent from a year ago in the second quarter while total assets rose 3.6 percent. Because assets are so much larger than liabilities, even with a slower pace of growth for assets, the ratio of total liabilities to total assets for nonfinancial companies fell to 44.35 percent in the second quarter from 45.30 percent in the first quarter. The second- quarter result is below the 35-year average ratio of 45.52 percent and well below the peak of 50.44 percent in 1993.
The sector of the economy with poor financial health is the federal government. The latest data from the Treasury show the federal government ran a 12-month deficit of $890 billion through August. That amounts to 3.4 percent of gross domestic product. In total, the federal government has outstanding debt of $21.3 trillion as of July, or 103.84 percent of GDP. The federal government’s fiscal position is one of the most significant risks to the medium- and long-term health of the U.S. economy.
Fed Monetary Policy Continues as Expected
The Federal Open Market Committee raised the target for the federal funds rate by 25 basis points on September 26. The target range is now 2.0 to 2.25 percent. That is the third increase for 2018. Current consensus expectations are for an additional 25 basis-point increase at the December 18–19 meeting. That expectation is supported by the latest update to the Fed’s economic projections. Those projections suggest three increases for 2019 and an additional two increases in 2020. As with any projections, the degree of uncertainty increases the farther out in time the projections go. With most members believing the neutral rate to be 3 percent, the perceived necessity of moving rates into restrictive territory is likely to become a major focus over the course of 2019 and policy decisions made on that basis will be highly dependent on economic conditions.
In addition to the increases in the target rate for the federal funds rate, the FOMC is continuing to shrink the Fed’s holdings of Treasury and mortgage securities. The process of shrinking the balance sheet is not considered to be an active monetary policy tool, though here too a debate is developing as to the appropriate level of holdings given the changes to the banking system since the financial crisis.
Regardless of the debates, expect the FOMC to maintain a slow normalization process, which should help support the current economic expansion.
Partially in reaction to the decision to raise short-term interest rates, the yield on the benchmark 10-year Treasury note has been moving higher. The yield has risen from less than 1.4 percent in mid-2016 to over 3 percent in early October. Two significant forces are influencing current yields. First, domestically there is something of a Goldilocks scenario with strong economic growth, low but modestly accelerating consumer price increases, and slowly rising short-term interest rates pushing up yields. As the Fed raises the cost of capital without causing a recession (so far), longer-term yields reflect the higher shorter-term rates. Plus, the strong growth and accelerating price increases put additional upward pressure on yields.
Partially offsetting the upward pressure is the substantial accumulated liquidity in global markets resulting from extraordinary monetary policies in Europe and Japan. With yields relatively high in the United States compared to these other developed markets, capital tends to flow to the Treasury market, putting downward pressure on yields.
Core Consumer Price Increases Remain Relatively Low and Stable, but Energy Prices are Moving Higher
The price of West Texas Intermediate crude oil has risen from about $30 per barrel in mid-2016 to more than $75 in early October. At the same time, the CPI for energy has risen about 32 percent, contributing significantly to increases in the overall CPI. Over the last 12 months, the CPI has increased 2.3 percent while the CPI excluding energy is up 2.2 percent. Outside of energy commodities, few other goods are experiencing significant price increases. The core CPI for goods is down 0.3 percent for the 12 months through August and has seen falling prices for most of the past five years.
Services remain the main source of price increases. Within the core CPI for services, housing (particularly owners’ equivalent rent), restaurants, hospital services, many household services, and education services all are showing persistent significant price increases. These pressures are likely a result of the tight labor market and rising wages.
The price of motor vehicle insurance is also rising quickly, but this may be more related to poor driving habits such as texting while driving that have resulted in increased accidents and claims.
[pdf-embedder url=”https://www.aier.org/wp-content/uploads/2018/10/BCM_October_2018.pdf“]Robert Hughes

Robert Hughes joined AIER in 2013 following more than 25 years in economic and financial markets research on Wall Street. Bob was formerly the head of Global Equity Strategy for Brown Brothers Harriman, where he developed equity investment strategy combining top-down macro analysis with bottom-up fundamentals. Prior to BBH, Bob was a Senior Equity Strategist for State Street Global Markets, Senior Economic Strategist with Prudential Equity Group and Senior Economist and Financial Markets Analyst for Citicorp Investment Services. Bob has a MA in economics from Fordham University and a BS in business from Lehigh University.


