November Business Conditions Monthly


AIER’s Business Cycle Conditions Leading Indicators Index increased to 79 in October from a reading of 75 in the prior month. The Roughly Coincident Indicators Index fell to 92 following seven consecutive months at 100 while the Lagging Indicators Index fell back to 50 from 58 in the prior month (see chart below). The rebound in AIER’s leading indicators was expected as the impacts from Hurricanes Harvey and Irma began to fade. At least one additional leading indicator impacted by the storms is likely to show improvement in the next month or two, suggesting the overall index may improve in the coming months as well.
The preponderance of new economic data received over the past month still suggests continued economic expansion in the months and quarters ahead. However, while economic expansions do not die of old age, the extended duration of the current expansion suggests extra vigilance against unsustainable growth rates is warranted.
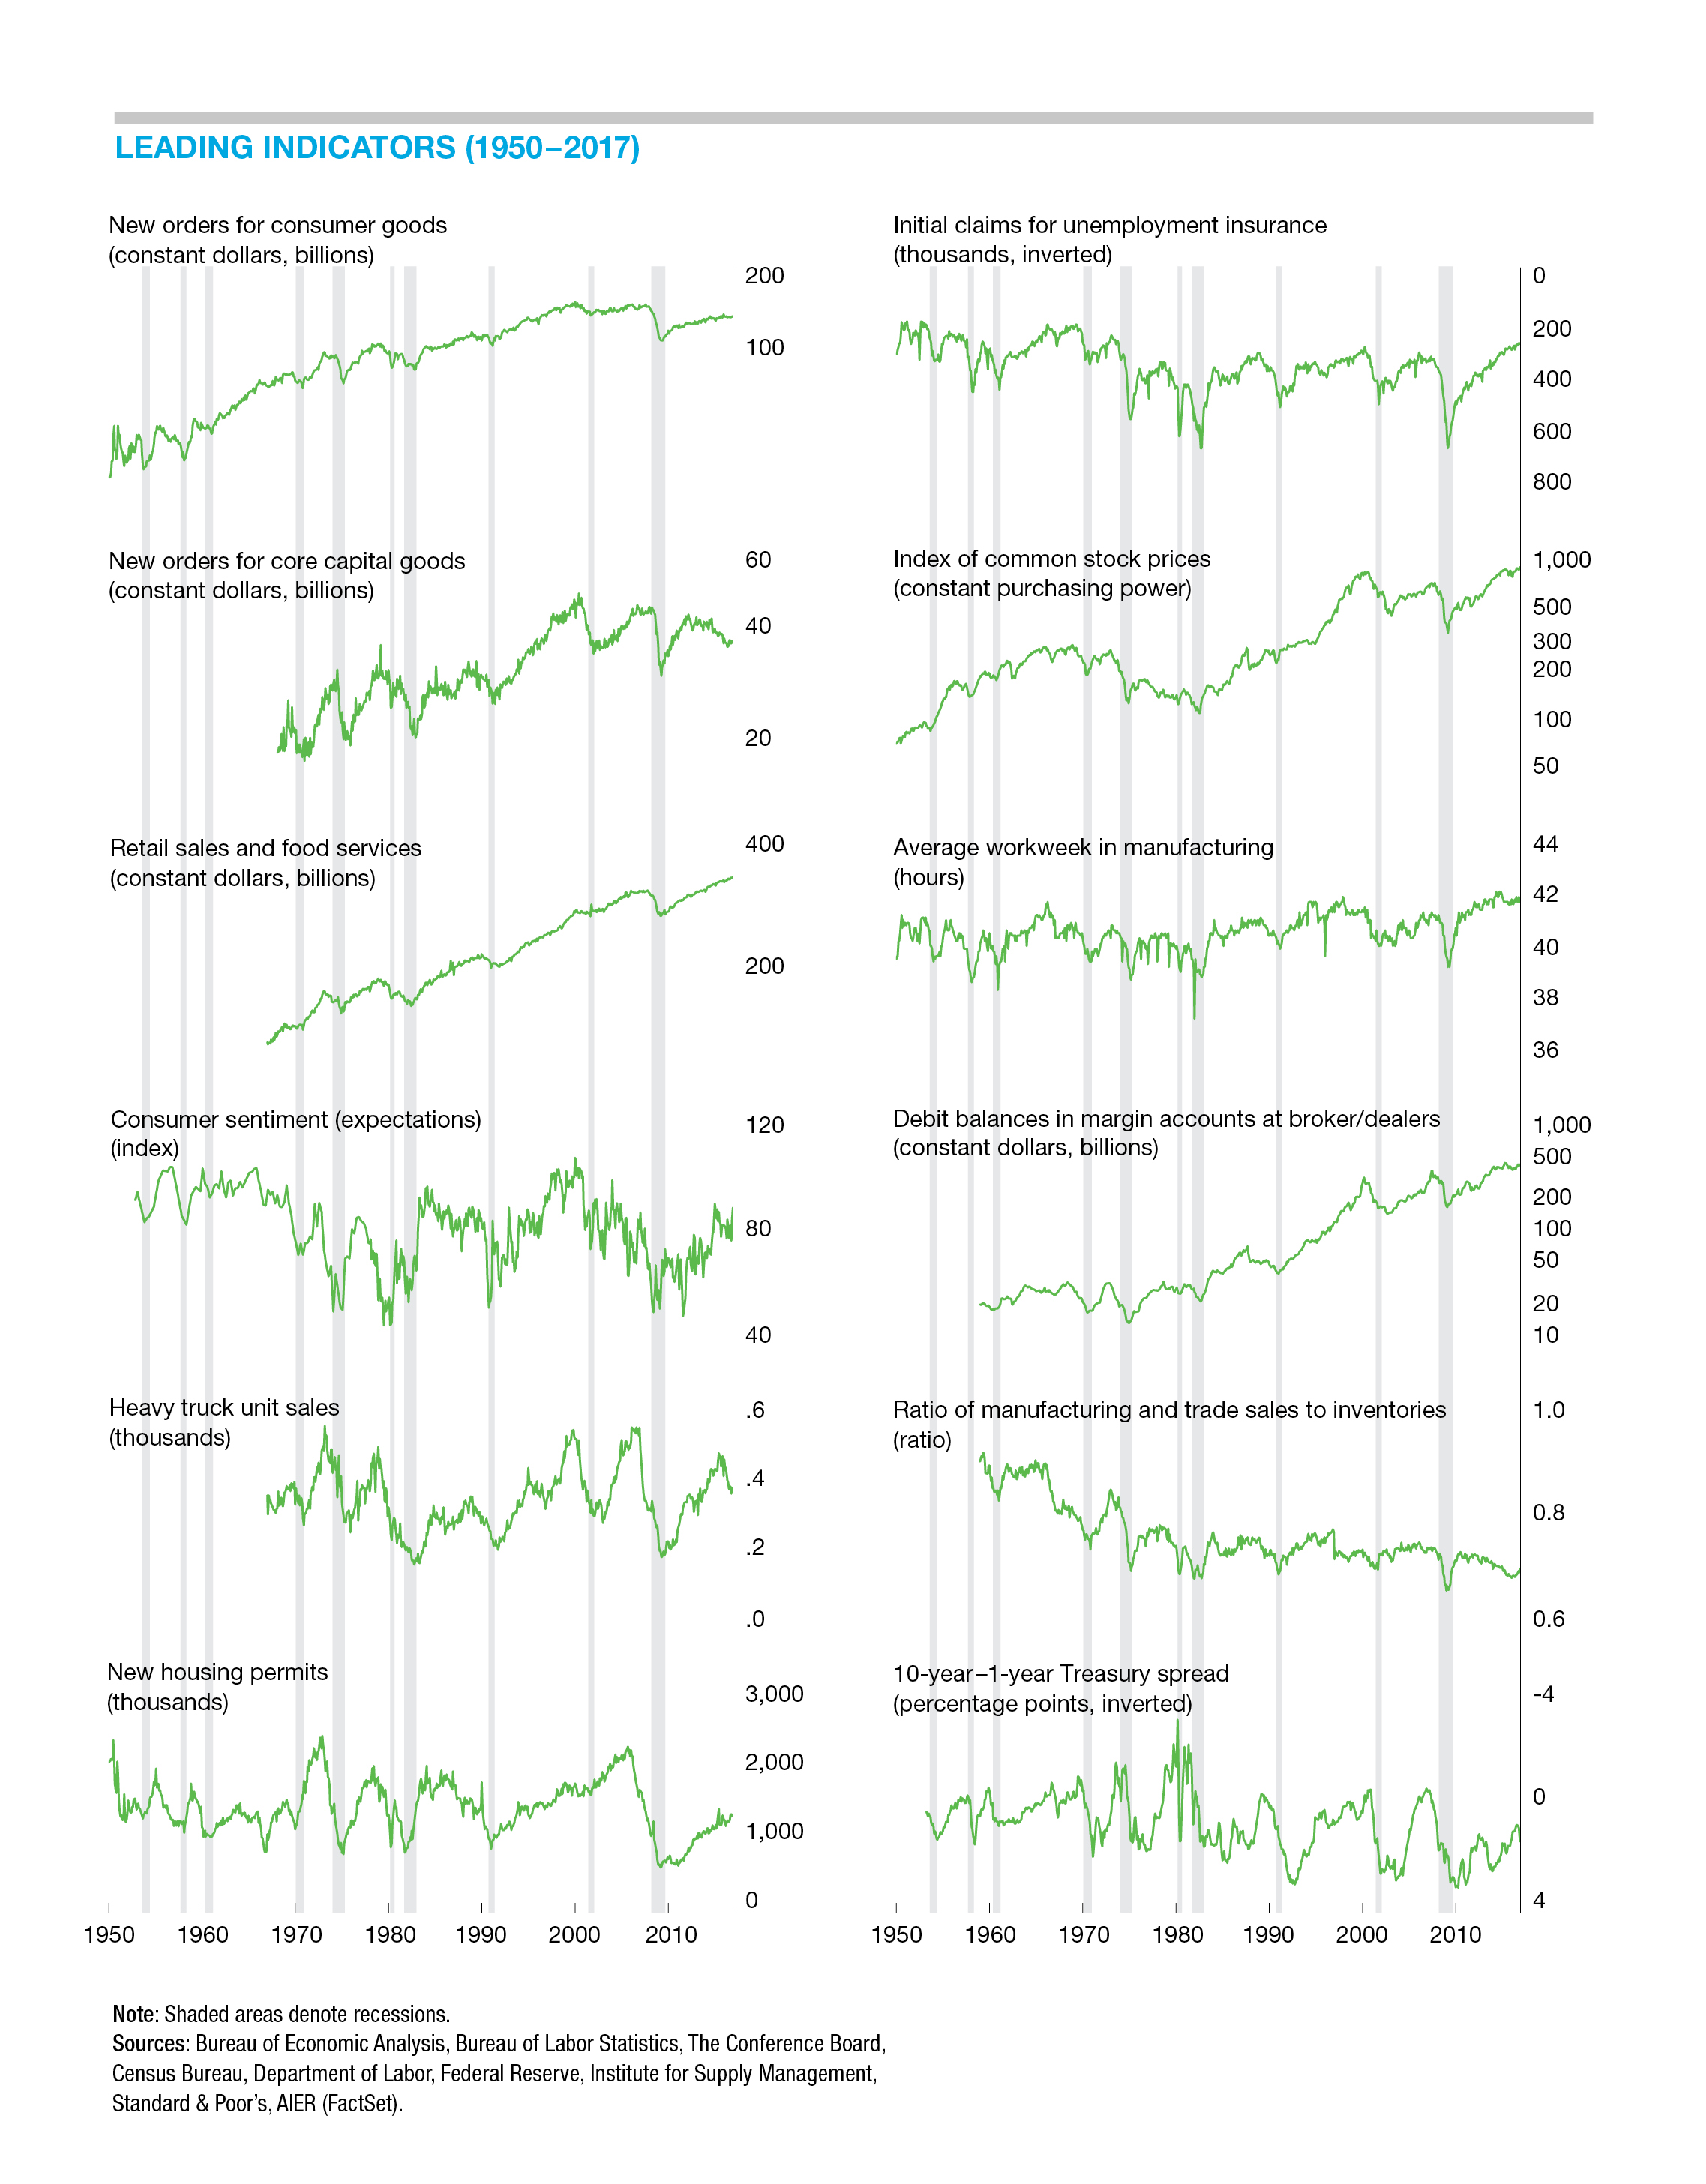
Leading indicators suggest continued expansion
Eight indicators were expanding in October while three were neutral and one was declining. That compares to seven expanding, one declining, and four neutral in September. Three indicators changed direction in October, as consumer expectations and real retail sales increased while the average workweek in manufacturing shortened. Initial claims, one of the first data series to reflect the impact of Hurricanes Harvey and Irma, remained a negative contributor to the overall index in October. However, weekly data have already started to improve, suggesting that this indicator will return to a favorable trend over the next month or two.
The Leading Indicators Index has posted a run of 11 consecutive months at or above 75 (where 50 is neutral), the best run since a 12-month run from February 2013 through January 2014. A lengthy string of readings above 75 suggests the risk of recession in coming months remains low.
The Coincident Indicators Index fell to 92 in October following seven consecutive readings of 100. The seven-month run of perfect readings is the first such run since November 2014 to April 2015. Five of six of the coincident indicators continue to show strong expansion trends, with industrial production being the one exception. Industrial production has slowed to a neutral trend following about a year of favorable results. The Federal Reserve, which compiles the industrial-production data, has stated that the latest results continue to be impacted by disruptions from past hurricanes.
AIER’s Lagging Indicators Index fell back to a neutral 50 reading in the latest month following a rise to 58 in September. Overall, three indicators are trending higher and three are trending lower.
Third-quarter GDP grew 3.0 percent, but the details were weaker than the headline
Real gross domestic product posted a 3.0 percent growth rate in the third quarter, according to the advance estimate from the Bureau of Economic Analysis. But that headline number masks a notable slowdown in private domestic demand. Private domestic demand, also known as real final sales to private domestic purchasers, is the sum of personal consumption expenditures, business fixed investment and residential investment (housing). The difference between the two growth rates in the third quarter was primarily due to inventory accumulation, which added 0.73 percentage points to third-quarter real GDP growth.
Private domestic demand posted a modest 2.2 percent growth rate in the third quarter versus 3.3 percent in the second quarter. Since 2015, PDD growth has beaten GDP growth in 9 of 11 quarters, registering an annualized growth rate of 2.7 percent versus 2.1 percent for GDP. Over the last four quarters, PDD is up 2.8 percent versus 2.3 percent for GDP.
Within PDD, at 2.4 percent, personal consumption expenditures grew at a slower annual rate in the third quarter than the 3.3 percent in the second quarter. Business fixed-investment spending decelerated to a 3.9 percent pace compared to 6.7 percent growth in the second quarter.
Outside of PDD, inventory accumulation added 0.73 percentage points to overall GDP growth while net exports added 0.41 percentage points and government spending deducted 0.02 percentage points.
Labor-market indicators remain robust
U.S. nonfarm payrolls added 261,000 jobs in October, a strong rebound from the hurricane-restrained increase of just 18,000 new jobs in September. The modest September gain was revised up by 51,000 from an initial estimate of a loss of 33,000 jobs. Combined with a 39,000 upward revision to August, the three-month average gain in payrolls, even with the distortions from hurricanes, came in at 162,000 in October, just below the 183,000 average since 2010.
The unemployment rate fell again in October, dropping to 4.1 percent, the lowest since 2000. However, the labor force participation rate also fell in October, declining to 62.7 percent from 63.1 percent in the prior month. The participation rate had been slowly drifting higher since hitting a cycle low of 62.4 percent in September 2015, and remains well below the 66.0 percent rate that prevailed for the 2004 through mid-2008 period.
Despite the low unemployment rate of 4.1 percent, average hourly earnings were unchanged in October, resulting in a 12-month gain of just 2.4 percent. For production and nonsupervisory workers, the gain is just 2.3 percent.
The Conference Board Employment Trends Index surged to a record 135.6 in October, a gain of 2.0 percent for the month and 5.4 percent from a year ago. The ETI tends to lead private payroll employment by about five months, suggesting further gains in payrolls in coming months.
The ETI is a composite index consisting of the percentage of respondents who say they find “jobs hard to get,” from The Conference Board Consumer Confidence Survey; initial claims for unemployment insurance, from the Department of Labor; the percentage of firms with positions they cannot fill right now, from the National Federation of Independent Business Research Foundation; the number of employees hired by the temporary-help industry, from the Bureau of Labor Statistics; the ratio of involuntarily part-time to all part-time workers, from the BLS; job openings, from the BLS; industrial production, from the Federal Reserve Board; and real manufacturing and trade sales, from the Bureau of Economic Analysis.
A separate report from the BLS confirms the continued strength in the labor market. Total job openings in the United States ticked down just slightly to 6.093 million, just 0.7 percent below the record high of 6.14 million in July. Jobs openings in the private sector totaled 5.563 million in September, or 1.1 percent below their all-time record. The jobs-openings rate, openings divided by the sum of jobs plus openings, held at record highs for both the total labor market and the private sector, coming in at 4.0 percent and 4.3 percent respectively. The highest openings rates were in professional and business services (5.4 percent) and health care (5.2 percent), while the lowest openings rates were in education (2.6 percent) and construction (2.8 percent).
Further signs of labor-market strength may be seen in the layoffs rate, which held at 1.3 percent for private employers, well below the 2.2 percent peak rate in 2009, and the quits rate, which remained at 2.4 percent in September, well above the 1.4 percent rate in 2009.
Labor-market strength is boosting consumer confidence
The latest results from The Conference Board show overall consumer confidence rose in October to the highest level in almost 17 years. The consumer-confidence index came in at 125.9 versus 120.6 in September. The present-situation index rose to 151.1, supported by a favorable view of the job market, while the expectations index rose to 109.1 from 103.0.
According to the report, “Consumers’ assessment of current conditions improved, boosted by the job market which had not received such favorable ratings since the summer of 2001. Consumers were also considerably more upbeat about the short-term outlook, with the prospect of improving business conditions as the primary driver. Confidence remains high among consumers, and their expectations suggest the economy will continue expanding at a solid pace for the remainder of the year.”
Price increases remain moderate
Energy commodity prices in the CPI rose 12.6 percent in September and 17.8 percent for the latest three months following a 30 percent decline in the prior three months. Over the past year, energy commodities are up 10.1 percent, but over the past five years, they are down an annualized 3.5 percent. That sort of volatility is why economists often look at the core CPI to better understand the underlying trends.
The core CPI is up 1.7 percent over the past year, 1.9 percent annually over the past five years and 2.0 percent annualized over the last two decades. That is as close to price stability as the United States has ever seen.
Within the core, price increases are concentrated in private services, primarily housing, hospital services, transportation services (which often reflect energy commodity prices), motor vehicle insurance and, until recently, education.
In stark contrast, core commodities (goods excluding food and energy goods) are down 1.6 percent over the past three months, down 1.0 percent over the past year and down 0.5 percent annualized over the past five years. Over the past two decades, core commodities are flat.
The tightening labor market has the potential to drive labor costs up at an accelerating pace, which may drive consumer prices higher, but as of now labor costs remain moderate as well.
Fed policy remains on a path of slow normalization in the short term, though personnel changes are a major risk over the medium term
All indications from the current members of the Federal Reserve’s Federal Open Market Committee are that policy remains on a slow path of normalization. That normalization includes a likely third increase for the current year in the fed-funds target in December and adherence to the newly initiated process of balance sheet reduction through slowly declining levels of reinvestment of maturing securities.
The more pressing issue for monetary policy is the potential for major changes at the FOMC. Current Fed Governor Jerome Powell has been nominated to become chairman in February 2018. At that time, current Chair Janet Yellen will have the option to serve out the remainder of her term as board governor through January 31, 2024, or resign from the board altogether. It is anticipated that she will leave the board. There are already multiple openings on the board and one for regional Fed bank president open. A possible major shift in policy implementation due to a changing composition of the Fed board is a significant area of uncertainty and a major risk for markets and the economy over the medium term.
[pdf-embedder url=”https://www.aier.org/wp-content/uploads/2017/11/BCM_November2017.pdf“]Robert Hughes

Robert Hughes joined AIER in 2013 following more than 25 years in economic and financial markets research on Wall Street. Bob was formerly the head of Global Equity Strategy for Brown Brothers Harriman, where he developed equity investment strategy combining top-down macro analysis with bottom-up fundamentals. Prior to BBH, Bob was a Senior Equity Strategist for State Street Global Markets, Senior Economic Strategist with Prudential Equity Group and Senior Economist and Financial Markets Analyst for Citicorp Investment Services. Bob has a MA in economics from Fordham University and a BS in business from Lehigh University.


