New EPI: Gasoline Drives Index Lower
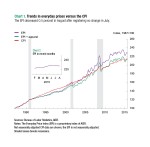
AIER’s Everyday Price Index (EPI) decreased 0.5 percent in August after registering no change in July. Including apparel, the EPI decreased 0.3 percent. In some households, apparel may be purchased at least once a month but in others less frequently. The EPI, an index of prices that people encounter in monthly budgeting, reflects both measures.
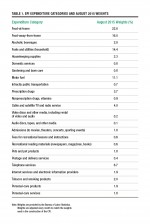
This month introduces a revised version of the index, adding new components and deleting some previous ones. To learn more about the changes, read “Capturing shifts in everyday prices,” an AIER Issue Brief.
In comparison to the EPI for August, the Consumer Price Index (CPI) reported by the Bureau of Labor Statistics decreased 0.1 percent on a not-seasonally-adjusted basis after showing no change in July. AIER’s EPI is not seasonally adjusted.
Over the past 12 months the EPI has fallen 2.8 percent while the CPI has increased 0.2 percent. The difference between the two is due to a drop in energy prices. The EPI assigns a greater weight to energy.
A decline in energy prices provided some relief for households. Gasoline prices fell 5.4 percent in August with regular-grade dropping 5.7 percent, mid-grade falling 4.3 percent, and premium declining 4.4 percent. Over the past 12 months gasoline prices have decreased 23.3 percent. In August, home fuel oil prices dropped 8.1 percent and electricity prices decreased 0.3 percent. On the other hand, natural gas prices inched up 0.1 percent in August.
Internet services decreased 1.2 percent in August and have dropped 3 percent over the past 12 months. Cable TV prices decreased 0.5 percent in August but have increased 1.5 percent over the past 12 months. Prices for other household goods and services were mixed in August. Telephone service prices increased 0.6 percent and domestic services, such as cleaning, were up 0.1 percent. Housekeeping supplies decreased 0.2 percent and pet supply prices were unchanged.
Offsetting lower energy prices were higher food prices. Food-at-home increased 0.3 percent and food-away-from-home increased 0.2 percent. Food-at-home prices were led higher by meats, eggs, and fresh fruits and vegetables. Within the meat category, seafood increased 2.2 percent and pork was up 0.6 percent. Egg prices jumped 9.2 percent in August and have risen 35.3 percent over the past 12 months. Fresh fruits and vegetables prices registered a 1.2 percent increase in August. Food prices that declined in August include bakery products and dairy products, which decreased 0.2 percent and 0.3 percent respectively.
To learn more about the methodology of the Everyday Price Index, go to, “What is the EPI?”


