Momentum in Manufacturing
With the economy back on a growth path and equity markets trending higher, the timeline for potential interest-rate increases is top of mind for many as they anticipate the conclusion to the Fed’s asset purchases and listen to its members debate the measurement of slack in the labor market. Meanwhile, the U.S. manufacturing sector has been humming with activity, benefitting from the rebound in U.S. economic growth.
For Digital or Print Copies of AIER Research, Click Here.
New orders at the nation’s manufacturers are at an all-time high, as are backlogs of unfilled orders (Chart 1). Furthermore, the ratio of unfilled orders to shipments is relatively high, the ratio of inventories to shipments is moderate, and capacity utilization rates are at or near pre-recession levels. Taken together, these indicators suggest a positive outlook for the U.S. manufacturing sector.
Economic Outlook
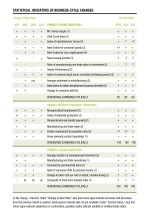
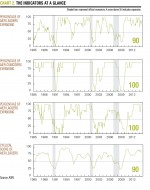
Our Business-Cycle Conditions (BCC) indicators were mostly stronger in the latest month. The share of leading indicators that expanded in August rose to 90 percent, a gain of 10 percentage points from a reading of 80 percent in July.
Our cyclical score for the leading indicators, derived from a separate mathematical analysis, also rose to 90 in August, following two consecutive months at 88. With gains in both measures during the latest month, and both now at 90, our indicators suggest that the economic outlook remains positive, with a very low probability of recession in the coming quarters.
Key takeaways from the latest readings of AIER’s BCC indicators include:
Leading: Among the 12 leading indicators, eight were judged as “clearly expanding” in August, one was deemed “probably expanding,” two were considered “indeterminate”—i.e., having no discernable trend—and one was “clearly contracting.” Among those indicators that were clearly expanding, seven hit new cycle highs: M1 money supply, yield curve index, new orders for consumer goods, new orders for core capital goods, index of common stock prices, average workweek in manufacturing, and initial claims for state unemployment insurance (inverted).
The ratio of manufacturing and trade sales to inventories and new housing permits were the two indicators that had no discernable trend, while vendor performance was judged as “clearly contracting.”
Coincident: All six of our coincident indicators continued to expand in July, resulting in a perfect 100 reading for the 32nd consecutive month. Deemed “clearly expanding” were: nonagricultural employment, index of industrial production, manufacturing and trade sales, civilian employment to population ratio, and Gross Domestic Product. Of these six indicators, only Real Personal Income excluding Transfers did not hit a new cycle high.
Lagging: AIER’s index of lagging indicators registered a perfect 100 percent reading again last month as all five indicators with a trend were clearly expanding: average duration of unemployment (inverted), manufacturing and trade inventories, commercial and industrial loans, the ratio of consumer debt to income, and change in labor costs per unit of output in manufacturing. Only one lagging indicator, the composite of short-term interest rates, was indeterminate last month. Moreover, of the six lagging indicators, only change in labor costs per unit of output in manufacturing and composite of short-term interest rates did not hit a new cycle high.
In aggregate: Twenty of our 24 indicators were judged to be clearly expanding or probably expanding last month, with 16 hitting new cycle highs. Three indicators were considered to have no discernable trend, while Vendor Performance was the single indicator that was contracting. Overall, our three composite indexes remained well above 50 percent, pointing to continued economic growth in the months ahead (Chart 2).
BCC New Orders
Among our 12 leading indicators, two are tallies of new orders at U.S. manufacturers: new orders for nondefense capital goods excluding aircraft, also called “core capital goods,” and new orders for consumer goods, both adjusted for inflation. These two indicators were judged to be expanding in the latest month, contributing positively to the leaders diffusion index. In fact, both are at expansion highs, reflecting the improving level of economic activity, though both do remain below their 2007 peaks (Chart 3).
As leading indicators of the U.S. business cycle, inflation-adjusted new orders for consumer goods and for core capital goods are valuable metrics because they represent two key components of real GDP, consumer spending and business investment, respectively. However, if we are considering the state of U.S. manufacturing from a business person’s or investor’s perspective, it makes sense to analyze data on an industry-by-industry basis as well as on a nominal-dollar basis, since businesses don’t actually conduct transactions in inflation-adjusted dollars. We look at both in the sections below.
Durable Goods
Our analysis of durable goods manufacturers’ activity focuses on five key metrics: new orders, unfilled orders (or backlog of orders), the ratio of inventories to shipments, the ratio of unfilled orders to shipments, and capacity utilization. Orders and shipments are measured using nominal dollar data. Each of these five metrics gives us an important part of the overall picture.
In general, high levels of new and unfilled orders are desirable. Both indicate strong demand and suggest a favorable outlook for future production.
The ratio of unfilled orders to shipments helps put the backlogs in better context, measuring the number of months that orders are backlogged given the current shipment rate. Once again, from the producers’ point of a view, a higher number is better.
Similarly, the inventories to shipments ratio measures the number of months it would take to exhaust current inventories given the current shipment rate; typically, low or moderate inventories to shipments ratios are more favorable.
Finally, capacity utilization, or operating rates, measures the portion of productive capacity that is being used for current production. Manufacturers generally prefer higher utilization.
Among durable goods producers, new orders totaled $300.1 billion in July, a sharp increase over the June level of $244.8 billion. A large portion of the jump was due to a surge in aircraft orders following the international air show in Farnborough, U.K. in July. That surge helped push the backlog of unfilled orders to $1,158.5 billion, the highest on record (Chart 4).
The record level of unfilled orders will likely push up the ratio of unfilled orders to shipments—which measures how quickly a backlog of orders may be filled—to 6.65 months in July from the most recently reported level of 6.52 for June. At the same time, the inventory to shipments ratio for durable goods fell to 1.61 months in July from 1.66 months in June (Chart 5). Overall, these ratios suggest that durable goods manufacturers are operating in the sweet spot of a favorable balance between demand, future production, and current inventory levels.
Given the strong rebound in new orders, the growing backlog of orders, and the current moderate inventory levels, it’s not surprising that utilization rates have rebounded sharply from the lows of the recession. Utilization for all durable goods producers averaged 78.3 percent for all of 2007. During the recession, utilization fell to a low of 58.3 percent. As of July 2014, utilization had reached 78.6 percent, more than 20 percentage points above the trough and slightly ahead of the 2007 average (Table 1).
Durables Industries
In Table 1, we provide a summary of the key metrics for all manufacturers, durable goods manufacturers in aggregate, and specific durable goods industries. In the table, we show new orders, unfilled orders, the unfilled orders to shipments ratio, and the inventory to shipments ratio, all as a percentile of their range since January 2007. For example, a reading of 100 means the latest data point is at the top of the seven-year-plus range. We also show capacity utilization and the average utilization rate for 2007.
Keeping in mind that higher numbers are preferable for most of the metrics (new orders, unfilled orders, the unfilled orders to shipments ratio, and capacity utilization) while lower readings are desirable for inventory to shipments, it’s clear that most industries have a generally favorable mix of metrics (though none shows the perfect combination). The bottom line: Our analysis suggests a positive outlook for durable goods producers overall.
Nondurable Goods
The analysis for nondurable goods producers is slightly different. Because most nondurable goods have shorter production lead times, there are no order backlogs for nondurable goods. Therefore, we don’t have total backlog or ratio of backlog to shipments metrics. Also, because of the short lead time, the data collection process assumes that shipments of nondurable goods generally occur over the same time period as the new orders—so, by definition, shipments equal new orders.
Among the nondurable goods producers, shipments (new orders) totaled $258.0 billion in July, just 2.5 percent below the all-time high of $262.6 billion in February 2013, and well above the recession low of $186.1 billion for March 2009 (Chart 6). One point of concern for nondurable goods manufacturers: Even with shipments at record high levels, the growth rate has slowed to an annual rate of about one percent over the past three years.
Inventories for nondurable goods manufacturers appear to be well managed as of July. The latest data show an inventory to shipments ratio of 0.97, slightly below the average of 0.99 that has occurred since 2006 (Chart 7). This suggests that inventory levels for nondurable goods industries in aggregate are at a reasonable level, not too high but not too low.
Nondurables Industries
Table 2 provides details for major nondurable goods industries. Food product manufacturers show very good readings across all three metrics—with shipments (new orders) at the 99th percentile, inventory to shipments at the 9th percentile, and capacity utilization at 82.3 percent, two percentage points above the average utilization rate for 2007. On the other end of the spectrum, printing goods has an unfavorable mix, with shipments very low at the 7th percentile, inventory to shipments at the 94th percentile and utilization of just 72.2 percent, almost four percentage points below the 2007 average. The other industries are all somewhat mixed, but on balance, tilt towards favorable fundamentals.
Strong Second-Half 2014
The outlook for the economy remains favorable, according to our Business Cycle Conditions indicators. Our Diffusion Index of Leaders strengthened over the latest month and continues to suggest a low probability of recession in coming quarters.
Our analysis of the current flow of orders, the current state of backlogs, inventories, and utilization rates suggests strength in the manufacturing sector overall, though some industries are faring better than others. This leads us to expect a solid second half of the year for the manufacturing sector, and it supports our positive view of the economy overall during the final two quarters of 2014.
A Glossary of the Business-Cycle Conditions Indicators can be found here.
[pdf-embedder url=”https://www.aier.org/wp-content/uploads/2014/09/BCC20140909.pdf“]


