Measuring the Middle Class
These are questions that economists have considered for years. Unfortunately, there is currently no one definition that social scientists and policy makers accept and no single number that gets calculated and reported regularly, in the U.S. or elsewhere. Most attempts to define the middle class do so in terms of an income range. Others ignore income entirely and focus on education levels. And still others just ask people whether they are middle class or ask them to classify themselves as lower, middle, or upper class.
Each approach has limitations. If we focus on income, the hard question becomes what income range to use. Some suggested ranges for the middle class start so low that they encroach on the U.S. poverty line of $21,200 a year for a family of four (as of 2010). Surveys that ask people if they are in the middle class encounter another problem: Almost everyone in the U.S. regards themselves as middle class. And defining middle class by educational attainment can include people who would otherwise be considered at the poverty level or very wealthy. Bill Gates, one of the richest people in the world, attended but never graduated from Harvard University. By some definitions, he would be counted as middle class.
Our definition of the middle class draws on the methodology used to develop the U.S. poverty rate, which was done in the early 1960s by an economist at the Social Security Administration, Mollie Orshansky, and has been used ever since. For data on household incomes by country, we rely on the Luxembourg Income Study, a database started in 1983 by U.S. researchers that now covers 48 countries.
Using these and other resources we developed a definition and measure of who is in the middle class—those households with a disposable income within the range of two-thirds to twice the median income for their household size. We then compared the size of the U.S. middle class with its counterparts in other countries.
We found:
- The U.S. has the smallest middle class among nine developed countries we examined.
- Since the 1980s the U.S. middle class has been slowly shrinking, from nearly 60 percent of households in the late 1970s to a bit more than 51 percent by 2013.
- The fate of the middle class over the past several decades has been very different in many of the developed nations we examined. In France, for example, the middle class grew continuously from the 1970s, reaching nearly 70 percent by 2000, and now accounts for over 65 percent of households. Finland had one of the largest middle classes in the world in 1995 (over 70 percent of households), but a housing bubble and economic challenges had reduced its size to 62 percent as of 2010.
- While some have blamed globalization or technical change as likely reasons for a shrinking middle class in the U.S., the varying patterns of growth and decline by country suggest another explanation—one that is more national than global, such as differences in social or economic policies or demographics.
- The middle class does particularly poorly during recessions. It declined throughout the developed world during the Great Recession, when median household incomes dropped.
What we mean by middle class
Part of the reason that the middle class has not been clearly defined is historical. As French economist Thomas Piketty reminds us, until the second half of the 20th century, the middle class was virtually nonexistent in the developed world. Furthermore, only during the past decade has the shrinking middle class become a major concern. This has led to numerous attempts to define and measure the middle class.
If we focus on income range, as most attempts to identify the middle class have done, we find that most ranges fail to take into consideration household size or recognize that the standard of living one can enjoy with a certain income depends on how many people that income needs to support. With that in mind, we began with a case study in pragmatic problem solving—Mollie Orshansky’s work in the early 1960s to define the U.S. poverty level.
President John F. Kennedy, concerned about poverty, asked Walter Heller, chairman of the president’s Council of Economic Advisers, to get him some statistics. Heller then asked the Social Security Administration to come up with a measure of poverty. It turned to Orshansky, a specialist in family living standards and income adequacy who had been studying household budgets for a number of years.
As we find currently with the middle class, there was no official measure or agreed-upon method for defining and measuring poverty. Orshansky calculated a poverty threshold based on the minimum income needed by families of different sizes to survive the year, starting with a food budget based on U.S. Department of Agriculture data on minimum needs. The poverty rate measures the fraction of U.S. households that fail to meet the poverty threshold, which is adjusted annually for inflation. Orshansky’s definition of poverty was adopted in the 1960s by federal agencies to determine eligibility for various federal assistance programs.
With Orshansky’s work in mind, we began to measure the middle class by looking at median household income. We drew on a 2010 Pew Research Center study that asked people how much income was necessary for a typical four-person family to live in their neighborhood. While responses varied by location in the country and by neighborhood, the median response was $70,000. This was also close to the figure in a separate estimate by Wider Opportunities for Women, which looked at the 2010 budget needs of households with two working parents and two children. Further support came from U.S. Census Bureau figures, which showed that the median income for a family of four in the U.S. in 2010 was $68,274.
In its 2010 research Pew also found that a large percentage of responses for what was needed to be middle class fell between two-thirds and twice the median income, or $46,900 to $140,000 in 2010 for a family of four. This seems to be a reasonable range—substantially above the Orshansky poverty threshold and not so high that we would consider the family wealthy.
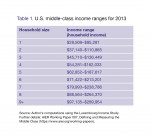
A focus on disposable income rather than household income seems appropriate because people care about what they can spend, and disposable income is what is used to purchase the necessities and luxuries that make up a middle-class standard of living. Assuming that survey responses of $70,000 came from rounding up median income, we used actual median household income as a starting point. We adjusted median income for a family of four, using the Orshansky thresholds to get equivalent living standards for families of different sizes. Table 1 shows our middle-class income ranges for 2013, including $54,281 to $162,033 for a household of four.
We made one other minor adjustment to account for what happens when median household income declines, as it did during the Great Recession. When real median income falls, we use the highest real median income before that and recalculate the size of the middle class using the higher median income. We continue in this vein until real median income recovers to its previous level. This adjustment lets us look at long-term trends rather than cyclical downturns.
What we learned
Using the Luxembourg Income Study, an international database whose U.S. data originally came from the annual household surveys by the U.S. Census Bureau, and our median income calculations, we found that the middle class in the U.S. has declined fairly continuously since the 1980s, from around 59 percent of all households to 51 percent in 2013 (Chart 1). The only major exception was the economic boom of the late 1990s when the size of the middle class held steady. We see that for 2004, there was a slightly smaller middle class due to the recession of the 2000s (March–November 2001). Things got much worse during the Great Recession, from December 2007 to June 2009 and after. As late as 2013, jobs and income levels had not recovered to pre-recession levels. In 2010, the real median income for a family of four was $4,800 below the level for 2007. This reduced the size of the middle class by 1.2 percentage points. In 2013, real median household income for a family of four was more than $5,100 below the level for 2007. Using the recession adjustment for median income in 2007 would have reduced the size of the U.S. middle class to just 50 percent in 2013 rather than 51 percent.
Comparing the middle class by country
The fate of the middle class over the past several decades has been very different in many of the developed nations we examined. This casts doubt on the two major economic explanations for rising inequality in the world economy starting in the late 20th century. If the phenomenon of rising inequality, and by implication a declining middle class, is due to globalization or technical change, we should see similar patterns in all developed nations, since they have substantial economic relationships with each other.
But this is not the case. We looked at nine nations that are trade partners with each other and are part of a world economy in which technology transfers around the globe rapidly. These countries can be divided into three groups—Anglo-Saxon nations, Nordic countries, and Continental Europe. Charts 2, 3, and 4 show the size of the middle class over time for these three groups.
The middle class is smallest in the three Anglo-Saxon countries (the U.S., the U.K., and Canada, Chart 2), at around 55 percent to 60 percent of all households in the early 2000s. The major exception here is the U.S., where the middle class shrank to nearly 50 percent in the early part of the 21st century. In addition, the pattern of change varies by country. The U.S. has had a nearly continuously declining middle class (with a short breather in the 1990s). In the U.K., the size of the middle class fell sharply during the 1970s and 1980s, as government benefits were cut substantially. In the 2000s, when the Labour party held power and some of these cuts were reversed, the British middle class regenerated. In Canada, on the other hand, the middle class grew in the 1970s and 1980s before declining in the 1990s and 2000s. These periods include times when the Liberal party ruled (1970s and 1980s) and when the Conservative party was in power (1990s and 2000s).
Nordic countries (Sweden, Norway, and Finland, Chart 3) tend to have the largest middle class, at around 65 to 70 percent of all households. Norway and Sweden continue to do better than the other developed European nations. In Norway the middle class has remained relatively stable, somewhere between 65 and 70 percent. In Sweden, the middle class exceeded 70 percent in the 1980s and 1990s but fell to a bit under 70 percent in the early 2000s. At present there are no data for Sweden in the late 2000s, so we don’t yet know the impact of the Great Recession on its middle class. Finland’s situation is unusual. Its middle class dropped to 62 percent in 2004 from more than 70 percent in the early 1990s. This decline stemmed from a housing bubble that burst in the early 1990s following by the economic collapse of its neighbor and key trading partner, the Soviet Union. Today Finland runs a trade deficit with Europe but cannot devalue its currency because it adopted the euro in 1999, unlike Sweden and Norway, which have not adopted the euro. As a result, Finland cannot sell enough goods to other euro nations to create more jobs and income for its workers.
The nations of Continental Europe (France, Germany, and Italy, Chart 4) are between the Anglo-Saxon and Nordic nations in terms of the size of their middle classes, averaging 60 to 65 percent of households. The German middle class was about 65 percent of households in the 1980s. It has since slowly fallen to around 60 percent, with a clear decline during the 2000s. One needs to be somewhat cautious when examining the data for Germany since prior to reunification in 1990 they included only what was then West Germany. France runs contrary to the German trend and that of most of the other nine countries examined here. France’s middle class increased from around 60 percent in the late 1970s and early 1980s to 65 percent in the 1990s and nearly 70 percent in the 2000s. There is no sign of any middle-class squeeze or decline in France over several decades or during bad economic times. Italy, too, runs counter to most other countries. Its middle class remained fairly constant at around 60 percent from the 1980s to 2000s. It fluctuated some in the 1980 and 1990s but was stable in the 2000s, even after the start of the Great Recession.
From our cross-national results it appears that institutional factors matter. Some countries do better than others in both good times and bad. These differences may be the result of demographic factors, such as the age distribution of the population, life expectancy, and immigration policy. They also may result from different types of economic and social policy.
We can also see that the middle class does particularly poorly during recessions despite these institutional differences. Most nations experienced a drop in the size of their middle class as a result of the Great Recession. Given the actual experience of several countries, it seems that national policies can make a difference when it comes to the impact of economic recession and high unemployment on the size of the middle class.
Much work remains to be done to make cross-national comparisons. We need poverty thresholds by geographic area to take into account different costs of living. Second, we need to expand the international dataset shown here to include more countries (and more years for existing countries). Last but not least, we need to begin studying what factors affect the size of the middle class within nations from one time to another.
[pdf-embedder url=”https://www.aier.org/wp-content/uploads/2016/10/RB_October_2016_Pressman.pdf“]
