May Business Conditions Monthly


AIER’s Business Cycle Conditions Leading Indicators index posted its second straight 100 in April as all 12 individual indicators continue to expand. The Roughly Coincident Indicators index also registered its second consecutive perfect 100 and its 11th 100 in the past 14 months. The Lagging Indicators index improved to 92, the highest level since February 2017 (see chart below). Together, the AIER business cycle indicators signal economic strength and suggest a positive outlook with a low probability of recession.
Tempering the favorable results from the business cycle indicators are a few softer economic reports, somewhat faster consumer price increases, ongoing uncertainty in D.C., heightened volatility in equity markets, and rising interest rates. While these are not enough to overwhelm the strong business cycle indicator results, they are sufficient to warrant adding a note of caution in assessing current economic conditions.
Leading Indicators Point to Continued Expansion
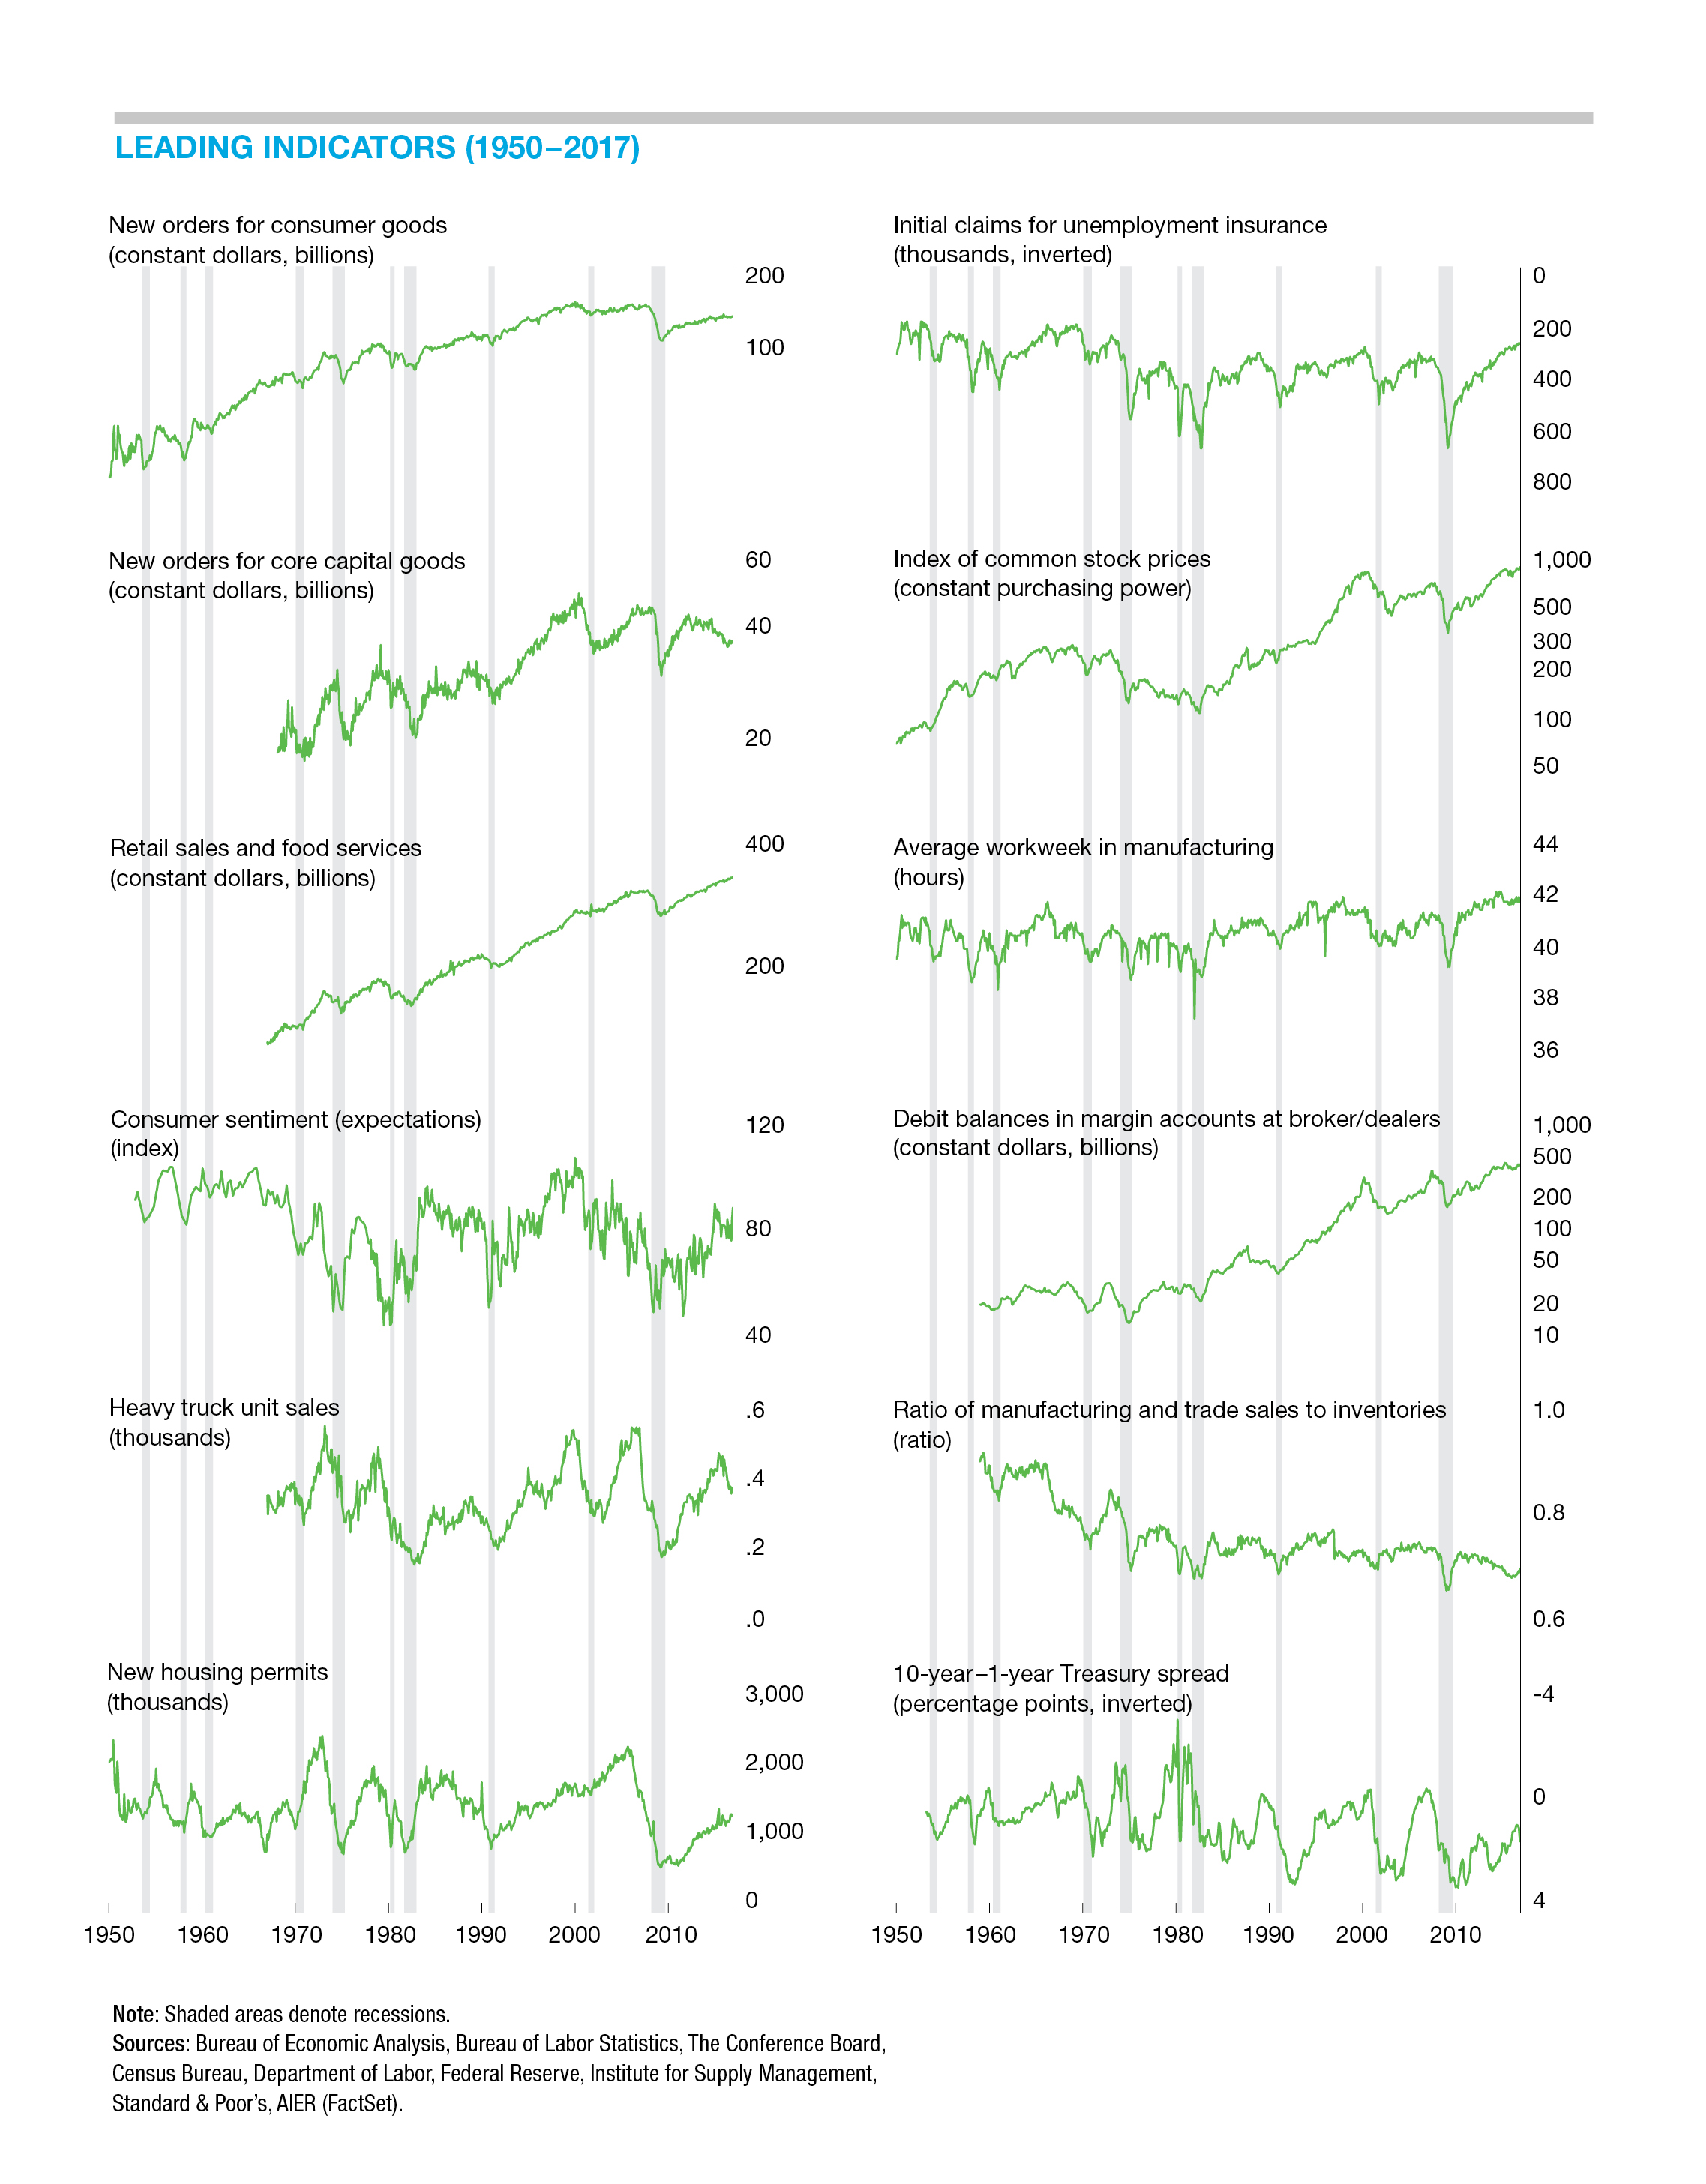
The Leading Indicators index maintained a perfect 100 reading in April, marking the first back-to-back 100s since December 2013–January 2014. All 12 indicators are expanding. Since 1987, the Leading Indicators index has reached 100 on 16 separate occasions, holding that level an average of 4 months. The longest run of perfect scores was nine months. That record occurred twice, once in 1980–81 and again in 1983. History suggests the Leading Indicators index will be unable to hold the perfect score for very long. However, the strong reading remains a favorable sign for broad-based economic expansion in the months ahead.
The Roughly Coincident Indicators index has shown more persistence historically. Since 1987, the index has hit 100 on 22 occasions. The average duration of runs at 100 is 12.5 months, more than three times the duration of perfect runs in the Leading Indicators index. The longest stretch of perfect scores by the Roughly Coincident Indicators index was 57 months, from August 1996 through April 2001.
AIER’s Lagging Indicators index increased to 92 in the latest month from 83 in the prior month. April was the fourth consecutive increase in the index, rising from a low of 42 in December. One indicator changed its signal in April: real private nonresidential construction expenditures went from a neutral reading last month to an expanding trend in the current period. Overall, five indicators are trending higher, none are trending lower, and one is neutral.
The three AIER business cycle indicator indexes showed strong results in April, suggesting a favorable economic outlook with a low probability of recession in the coming months.
First-Quarter GDP Was Below Expectations
Initial estimates show real GDP grew at a 2.3 percent pace in the first quarter compared to a 2.9 percent pace in the final quarter of 2017. For all of 2017, real GDP grew 2.3 percent compared to a 1.5 percent rise in 2016.
Real personal-consumption expenditures rose at a feeble 1.1 percent pace, well below the 4.0 percent gain in the prior quarter. Growth in spending on durable goods turned negative in the quarter while spending on nondurable goods managed just a 0.1 percent pace of growth and consumer services rose 2.1 percent, down from 2.3 percent in the prior quarter.
Fixed investment posted a 4.6 percent pace in the latest quarter, below the 8.2 percent gain in the fourth quarter of 2017. Business (nonresidential) fixed investment was a relative bright spot, posting a 6.1 percent gain, led by a 12.3 percent jump in structures. Equipment spending increased at a 4.7 percent pace while intellectual property products investment rose 3.6 percent. Residential investment (housing) was unchanged for the period after a 12.8 percent surge previously. The combination of consumer spending, business fixed investment, and housing investment is a key measure of private demand. This measure posted a 1.7 percent rise in the quarter, the slowest since the first quarter of 2016. However, it follows a very strong 4.8 percent rise in the prior quarter. Averaging the two growth rates produces a more typical pace of 3.3 percent, in line with the four-quarter growth rate and five-year annualized growth rate of 3.0 percent.
Outside of private domestic demand, exports slowed to a 4.8 percent growth rate from 7.0 percent last quarter while imports growth decelerated sharply to 2.6 percent from 14.1 percent in the prior quarter. Those decelerations resulted in a net contribution to overall real GDP growth of 0.2 percentage points. The government sector had a 1.2 percent increase in consumption and investment.
Labor-Market Indicators Soften but Remain Favorable
The labor market remains generally healthy, but payroll growth has slowed in the last two reports. The economy added 164,000 jobs in April following gains of 135,000 in March and 324,000 in February. That gain puts the average increase in jobs for the past three months at 208,000, in line with the average over the past five years of 209,000. The cumulative effect has been to push the unemployment rate down to 3.9 percent as of April. The unemployment rate has been lower than 3.9 percent in only one month since 1970 (3.8 percent in April 2000). Broader measures of underemployment also fell in April.
Furthermore, the continuing low level of initial claims for unemployment insurance and the near-record 6 million open jobs across the economy, results supported by several surveys that suggest businesses are still looking to hire, both point to continued strength in the labor market. That strength is likely to support consumer confidence and support further gains in consumer spending.
Despite the robust labor-market dynamics, wage growth as measured by average hourly earnings remains modest. AHE rose 0.1 percent in April, bringing the 12-month gain to 2.6 percent, in line with the trend over the last two years. However, alternative measures such as the median wage-growth tracker from the Federal Reserve Bank of Atlanta suggest wage growth may be in the 3.2 to 3.5 percent range.
Overall, consumers remain confident about the jobs market. The consumer-confidence survey from The Conference Board shows the percentage of consumers that believe jobs are easy to get was 38.1 in April, up substantially from the low of 3.1 percent in December 2009. At the same time, the percentage of survey respondents that believe jobs are hard to get was 15.2 percent, down from 49.4 percent in September 2011. The spread between these two percentages stands at 22.9 percent, down slightly from 24.0 percent in February but still a very high level historically.
Prices, Money, and Credit
Prices of personal consumption expenditures, the measure preferred by the Fed, rose 2.7 percent in the first quarter, the same pace as the fourth quarter of 2017. Both quarters saw sizable gains in the prices of nondurables (primarily energy) and services (primarily rents). Nondurable-goods prices rose at a 3.8 percent pace in the fourth quarter and 3.9 percent in the first quarter of 2018. Consumer-services prices rose 3.2 percent and 3.1 percent respectively. Consumer-durables prices saw some firming as well, rising at a 1.8 and 2.0 percent pace, respectively.
Over the last four quarters, the PCE price index is up 2.6 percent. If volatile food and energy prices are excluded, as in the core PCE price index, prices are up a more mild 1.7 percent over the last year. The core PCE price index has been rising at less than 2 percent annually for most of the past 20 years. That stretch of sub-2 percent increases is about as close to price stability as the United States has ever experienced. An alternative measure published by the Bureau of Economic Analysis calculates the PCE price index and core PCE price index using only observable prices (most implicit prices, such as financial services furnished without payment, are excluded). Using this methodology, the PCE price index is up 1.5 percent over the past year while the core PCE price index is up 1.3 percent—both well below the Fed target.
Money supply, as measured by the M2 aggregate, is growing at a 2.7 percent annualized rate over the three months through April 16. The growth rate over the past year has slowed to 4.0 percent, down from 7.5 percent at the end of 2016. Over the last 20 years—the period during which price increases have been relatively low and stable—M2 has grown at an average rate of 6.3 percent.
Bank lending is up 3.9 percent over the past year, below the 6.2 percent growth in bank lending over the past two decades but up from a 2.6 percent annual rate in September 2017. Though the pace of growth remains below the longer-run average pace, the modest acceleration over the past six months is noteworthy. The credit cycle is a critical driver of the business cycle and warrants close monitoring.
Special Topic: Foreign Holdings of U.S. Treasury Debt
As of March 30, 2018, the total amount of U.S. Treasury debt outstanding was $21,089,642,954,195.85. That is 105.6 percent of nominal first-quarter GDP. Within that $21.1 trillion, $5.7 trillion is intragovernmental debt and $15.4 trillion (or about 73 percent of the total) is held by the public.
As of the end of February 2018, the latest data available, foreign entities held $6.3 trillion of Treasury debt, or about 41.6 percent of total public debt outstanding, at the end of February. Within that $6.3 trillion, the two largest holders by far are China, with $1.2 trillion, or 7.8 percent, of public debt, and Japan, with $1.1 trillion, or 6.9 percent, of public debt. Coming in a distant third on the list of foreign holders is Ireland, with $0.3 trillion, or 2 percent of the total.
According to data from the Treasury, third-quarter funding is expected to include $618 billion of Treasury notes (securities with a maturity between 2 and 10 years), with $343.7 billion used for refinancing maturing debt and $273 billion of net new funds. The Treasury will also roll over some $1,808 billion of maturing bills (securities with a maturity of one year or less).
Some analysts estimate funding needs will be even greater in the fourth quarter and in 2019. These heavy issuance requirements come just as interest rates
are moving higher (the Fed is expected to continue to raise the fed-funds target by 25 basis points each quarter, and the yield on the 10-year note breached 3 percent for the first time since 2014), raising concerns over rising interest rates and the economy.
Given this burden, the U.S. federal government is likely to remain dependent on foreign buying, especially China and Japan, to fund the ongoing budget deficits and refunding needs.
[pdf-embedder url=”https://www.aier.org/wp-content/uploads/2018/05/BCM_May_2018.pdf“]Robert Hughes

Robert Hughes joined AIER in 2013 following more than 25 years in economic and financial markets research on Wall Street. Bob was formerly the head of Global Equity Strategy for Brown Brothers Harriman, where he developed equity investment strategy combining top-down macro analysis with bottom-up fundamentals. Prior to BBH, Bob was a Senior Equity Strategist for State Street Global Markets, Senior Economic Strategist with Prudential Equity Group and Senior Economist and Financial Markets Analyst for Citicorp Investment Services. Bob has a MA in economics from Fordham University and a BS in business from Lehigh University.


