Marginal Gains
Recent studies from the Bureau of Labor Statistics (BLS) and Chicago Fed, however, suggest that the relationship between commodity prices and inflation is tenuous. Prices tend to exhibit “stickiness,” not immediately adjusting to changes in underlying costs.
Apple sells iPads, for which it requires material inputs: the battery, the memory, the screen. Each of the inputs is manufactured from raw materials, either by Apple or a supplier. The battery is comprised of metals such as copper and lithium. Transporting the finished product from manufacturer to consumer requires oil and gas. Even the plastic encasing the phone is made from petroleum. When copper, oil, and petroleum prices drop, Apple might be able to reduce the price of iPads, so long as labor costs are stable.
As many commodities prices have trended down in the last two years, companies have faced a business decision: drop prices in an effort to capture market share or maintain prices and effectively increase margins. At the aggregate level, it seems companies have largely decided to choose the latter and bolster profit margins.
Businesses and executives have short-term incentives to drive profit margins higher. When raw material prices increase, the prices may be passed along the value chain to the end consumer. But when raw materials decrease in cost, as has been the recent case, companies are not likely to pass along the savings unless competitive forces command it. Increasing margins have encouraged stock prices upward, lining the pockets of stockholders and executives. When a business increases margins without increasing prices, it means “ker-ching” for Mr. and Ms. CEO.
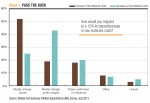
A July 2013 Business Inflation Expectations Survey from the Atlanta Fed asked businesses how they would respond to a 10 percent increase or decrease in raw materials costs. The survey found that a decrease in costs would be met with decreased consumer prices for about 25 percent of businesses. On the other hand, an increase in costs would be met with increased prices for about 52 percent of businesses. In other words, businesses openly admit that increased costs are passed along to the consumer, but savings are not (Chart 1).
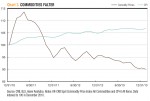
At the aggregate, corporate profits are up, commodity prices are down and inflation is stagnant (Charts 2 and 3). If commodity prices turn upward, it seems unlikely that businesses will continue to ignore the price changes.
Obligatory Weather Commentary
It seems that every major data release over the last two months has come with a mandatory comment on how the weather caused an abnormal reading. Retail sales, industrial production, housing, labor conditions…all have shown disappointing data.
Bloomberg reports: “Sales at U.S. retailers declined in January by the most since June 2012 amid bad weather.”
CNBC states that “U.S. manufacturing output unexpectedly fell in January and recorded its biggest drop since 2009 as cold weather disrupted production.”
The Wall Street Journal reports: “Construction of new homes tumbled in January, the latest sign of cooling in the housing market as much of the U.S. shivered through a cold and snowy winter.”
Economists are already predicting a letdown in GDP figures for Q1. There is no arguing that much of the country has been abnormally cold this winter. Limited data on extreme weather patterns in the U.S. suggest that extreme weather corresponds with reduced GDP growth (See Chart 4). The data that follow should all come with that caveat.
However, if extreme weather patterns continue to intensify in the future, it may become more difficult to “explain away” poor results with the excuse of weather.
Monthly Inflation Measures
Retail and Wholesale
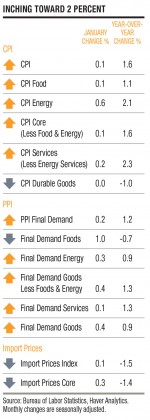
The broad-based Consumer Price Index (CPI) and the CPI Core were each up 0.1 percent for January, bringing both year-over-year increases to 1.6 percent. Energy prices continued to climb in January, increasing by 0.6 percent during the month, driven by increases in natural gas, fuel oil and electricity. Given the abnormally cold weather through much of the country, this certainly impacted finances of the average American. Heating degree (HDD) data suggest that heating our homes in the northeast and Midwest has cost 15 to 30 percent more this year as compared with the last two.
Durable goods prices were flat for January and remained negative on a year-over-year basis, while services prices continued to increase. This discrepancy indicates that there is room for future inflation to grow in durables prices.
Import prices inched upward for January, but remained negative on a year-over-year basis. The deflation in import prices has continued to put downward pressure on domestic prices. Businesses seem to be accepting flat prices since raw material costs have trended down in the last two years.
As of January, the Bureau of Labor Statistics has re-calibrated and improved the Producer Price Index (PPI). The PPI now “measures price changes for goods, services, and construction sold to final demand: personal consumption, capital investment, government purchases, and exports.” This allows users to look at producer prices for goods as well as services and covers a wider swath of the economy.
The PPI for final demand (the most broad-based metric) increased 0.2 percent for January and was up 1.2 percent on a year-over-year basis. Over the last 12 months, the PPI measure was up 3.1 percent for construction, whereas the PPI for foods was down (deflated) 0.7 percent. Services outpaced goods on a year-over-year basis, up 1.3 percent compared with 0.9 percent. This difference is not as large as we have seen in the CPI, but the pattern is similar.
Demand and Supply
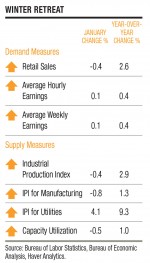
Retail sales figures for January were weak, down 0.4 percent on a monthly basis (seasonally adjusted) and up only 2.6 percent on a year-over-year basis. This is the weakest year-over-year reading since December 2009.
Likewise, consumer discretionary spending has slowed from its previous pace. The year-over-year reading as of December was 3.5 percent after residing in the 4-plus percent range for most of the last three years.
Growth rates have slowed. Our Business-Cycle Conditions report will offer a glimpse of whether this is a temporary hiccup as a result of weather patterns or if these data are indicative of a genuine economic slowdown. Although the direction of change (the first derivative for those who remember calculus) may be headed in the wrong direction, positive readings still represent economic growth.
Real earnings growth continues to be alarmingly low. Although unemployment has trickled lower, earnings growth was minimal in January and was up just 0.4 percent on a year-over-year basis. Real earnings growth has been stagnant during the last four years. Real hourly earnings are the same today as they were in January 2010.
The supply of goods, as measured by the industrial production index (IPI), unexpectedly dropped during January by 0.4 percent, reducing the year-over-year increase to 2.9 percent. The IPI was buoyed by large increases in utilities in response to a massive increase in heating demand as a result of cold weather. The IPI for manufacturing showed weakness, dropping 0.8 percent in January and up only 1.3 percent on a year-over-year basis. The fourth quarter manufacturing increase was also revised downward to an annual rate of 4.6 percent.
Reduced IPI measures were coupled with reduced capacity utilization, the first monthly decrease since July.
Although these factors highlight some recent weakness, supply and demand factors are trending in the same general direction and do not point to any immediate inflationary pressure.
Interpreting Inflation
Commodity prices are a potential source of future inflation. Inflation is not all created equally though. Financial circumstances and generational difference have a huge impact on how inflation is interpreted.
It is well-known that for retired people living on a fixed income, inflation can be detrimental to personal finances. When you have a fixed level of annual income and costs suddenly rise by 10 percent, you feel the pinch. However, that kind of inflation has the potential to be associated with broader economic gains. If bond yields increase, annuity rates and retirement drawdown percentages might increase, allowing for increased spending and additional investment opportunities for those with the resources.
A younger generation might also be very happy with some price inflation. Take the circumstances of a younger generation holding large mortgages. When price inflation increases, the value of homes (the largest financial asset for most Americans) should increase in tandem, while the monthly payment stays constant.
Inflation affects different people in different ways. When future inflation increases are considered, they cannot strictly be interpreted as a doomsday scenario. A little move into plus territory may actually be welcome by some, at least for a while.
[pdf-embedder url=”https://www.aier.org/wp-content/uploads/2014/02/AIER_InflationReport_March2014.pdf“]


