June Business Conditions Monthly


The AIER Business-Cycle Conditions Leaders index fell slightly to 79 in May, the first decline since July 2016. The Coinciders index remained at a perfect 100 for a third month, while the Laggers index held at 75 for the second month. All three indexes remain well above the neutral 50 level (chart 1). The solid performance of our Leaders combined with mostly favorable results from other economic data suggests continuing economic expansion in the months ahead with the outlook tilted toward potential upside surprises for growth.
With economic activity growing at a decent rate, the key risks are both in the policy arena: government/fiscal policy and monetary policy. Evidence so far suggests the high level of dysfunction and animosity in Congress and the uncertainty emanating from the White House may get worse. On the monetary-policy side, the Fed is moving toward normalization at a very slow pace, balancing the dual mandates.
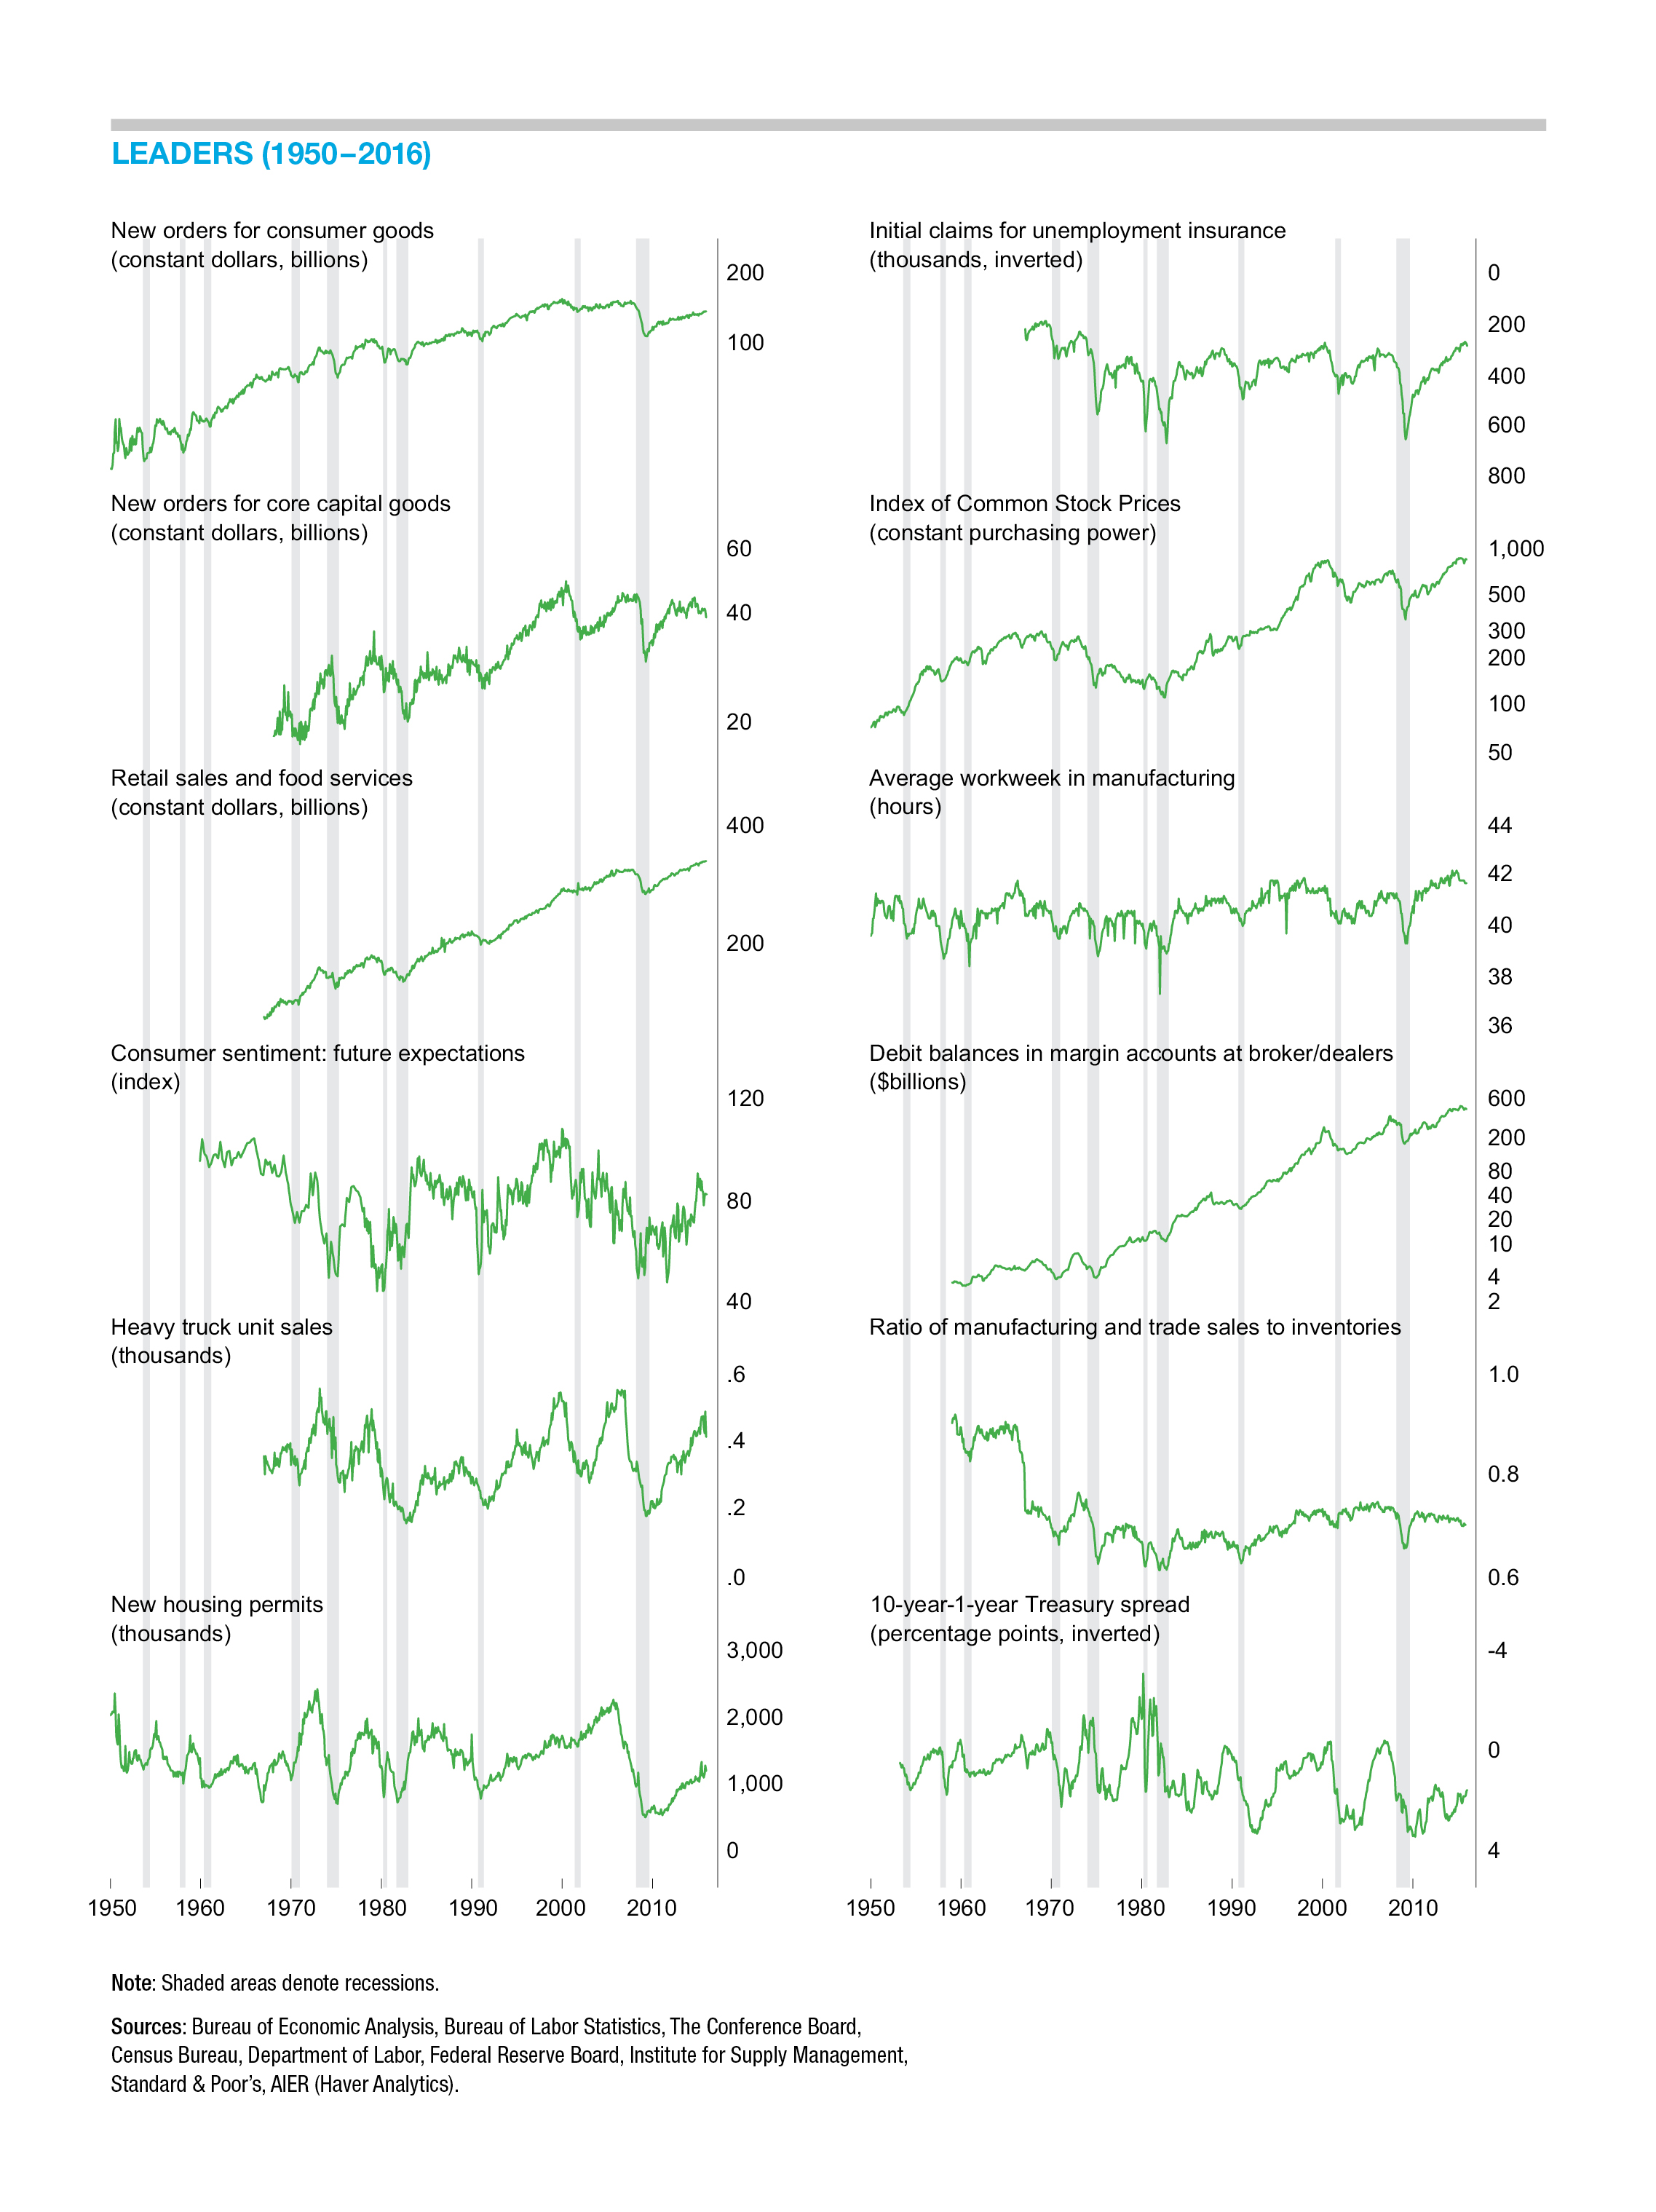
A substantial majority of our Leaders are expanding, though the Leaders index dropped slightly in the latest month. Eight indicators were expanding in May, while one was declining and three were neutral. That compares to nine expanding, one declining, and two neutral in April. While the net change was just one indicator moving from expanding to neutral, five indicators changed direction in the latest update.
Three indicators moved lower in May. The average workweek in manufacturing turned from neutral to negative. As discussed last month, the average-workweek indicator does have a natural limit on its performance. The average workweek in manufacturing can only increase so far before plateauing: workers can only work so many hours in a week. Now that the indicator has turned negative, careful attention will be necessary to monitor for signs of spreading weakness.
Real new orders for consumer goods just switched from a flat trend to an expanding trend last month but now has returned to neutral. Other consumer-related Leaders, real retail sales and consumer expectations, remain positive, as do most signs for the labor market. Evidence suggests that consumer spending remains well-supported. Therefore the new-orders indicator may yet return to an expanding trend, but as with the average-workweek indicator, careful monitoring is warranted.
Housing permits was the third indicator to move lower in May, switching from an expanding trend to a flat or neutral trend. From a supply-and-demand perspective, the housing market in aggregate is tight by historical measures. The months’ supplies of new and existing homes are at the lower end of their historical ranges, and rising home prices reflect the tight balance. However, housing activities such as the level of new-home construction and new-home sales are only near the middle of their historical ranges.
A tight labor market and slowing income growth should support home sales and home construction, but some of that support may be eroded by rising interest rates. The Federal Reserve is expected to raise rates two more times in 2017 with the next hike likely in June. That will put upward pressure on short-term rates and adjustable-rate mortgages. Benchmark 10-year Treasury yields have risen along with Fed rate increases, but not by as much as might be expected. Long-term Treasury yields may be somewhat restrained by safe-haven buying and still-low inflation expectations despite the improving economic outlook. That has helped keep the increases in fixed-rate mortgages modest.
Heavy-truck unit sales and the spread of 10-year over 1-year Treasuries are the two indicators that improved in May. The yield spread went from a negative trend to a neutral trend, while heavy-truck unit sales went from a neutral trend to an expanding trend. The improvement in heavy-truck unit sales brings that indicator in line with the expanding trend in the indicator of real new orders for core capital goods. The rising cost of labor, solid growth in economic activity, and generally healthy corporate finances all support a positive outlook for capital spending.
The Coinciders index registered a perfect 100 for the third month as all six of the indicators continue expanding. The three-month run of perfect readings is the first since February–April 2015. All six of the Coinciders are now showing strong expansion trends.
Our Laggers held steady in May, posting a 75 for the second month in a row. As with last month, four indicators are trending higher, while one—real commercial and industrial loans—is flat. Core CPI moved to a downward trend in April and continued the negative direction in May.
The Fed and its dual mandate
The unemployment rate fell to 4.3 percent in May, below the 4.5 to 5.0 percent range expected by Fed members over the long run, according to the March Summary Economic Projections. Along with record-low initial claims for unemployment insurance (measured as a percentage of employment) and a record number of open positions, a convincing argument can be made that the U.S. economy is close to full employment.
However, there are still some aspects of the labor market that could use improvement. Wage growth is modest by historical measures, and a large number of people are still underemployed (working part-time for economic reasons) or discouraged (wanting a job but not having looked in the past month and so not officially unemployed), but even on these metrics, conditions have improved dramatically over the course of the current expansion.
The dilemma for the Fed is supporting economic growth enough to keep the labor market robust, thereby providing jobs to people who want one, while maintaining price stability. The current Fed has indicated a willingness to let the economy “run hot” for a while, supporting the labor market while carefully monitoring prices and price pressures.
Consumer price increases have been moderating since 1980. Over the past 20 years, the CPI has risen at a 2.1 percent annualized rate. Over the past five years, the pace has been a mild 1.3 percent. While even 2.1 percent or 1.3 percent inflation can be burdensome on savers and devalue a currency, the reality is that the United States has never been as close to price stability as it has been over the past two decades.
Despite the great moderation in price increases, there have been sharply different price patterns among the components of the CPI. Food and energy are often looked at separately because energy prices can be heavily influenced by non-economic forces or events such as oil embargos (1970s), changes in policy by a cartel (2014), or changes in technology (horizontal drilling) and food prices may be affected by droughts, livestock epidemics, or pest infestations. Regardless of the causes, food and energy prices tend to be volatile and not as heavily influenced by monetary policy.
Core consumer prices, which exclude food and energy, are up at a 2.0 percent annualized pace over the past 20 years, nearly identical to the 1.9 percent pace over the past 5 years. But here too, the aggregate masks dramatically different performances. Core-goods prices, goods excluding food and energy goods, have been essentially flat for the past two decades, rising at a scant 0.1 percent annually. Core services however have been rising at a 2.8 percent pace over that period. Goods prices benefit from two major restraining factors: productivity growth is faster compared to services, and goods are more easily traded than services.
Among core services, the most significant sources of price increases in recent years have been housing, education, and medical care, rising 2.9 percent, 3.3 percent, and 3.0 percent, respectively, over the past five years. Surprisingly, two of those, education and medical care, have had significant slowdowns in recent months. The important questions are whether the slowdowns will persist and if they do, whether a slowing CPI might make the Fed even more cautious and result in slower rate increases.
Equities benefiting from solid economy
Gross domestic product growth may have been tepid in the first quarter, rising just 1.2 percent, but sales and profits for the Standard and Poor’s 1500 were robust. Rebounding from several weak quarters between late 2014 and early 2016, sales among the S&P 1500 rose 7.5 percent from the first quarter of 2016. Topping the sales-growth list were energy companies, with a 32.4 percent gain from a year ago. Five other sectors—consumer discretionary, financials, information technology, materials, and utilities—all had sales growth in the 7 to 9 percent range. The weakest sales were in telecommunication services, where sales fell 3.3 percent over the year, and consumer staples, which had a gain of just 1.9 percent.
While top-line growth is critical, investors tend to focus on bottom-line earnings per share (EPS). For the S&P 1500 in total, EPS rose 13.4 percent from a year ago. Leading the way on EPS growth was a 23.5 percent jump at materials companies, followed by an 18.5 percent gain at financial companies and a 17.9 percent boost for information technology firms. The weakest sectors were telecommunications, with EPS falling 6.4 percent from a year ago, consumer staples, up 1.5 percent, and industrials, where EPS rose 2.3 percent.
Looking ahead, second-quarter 2017 sales for the S&P 1500 are expected to rise a more-modest but still-respectable 4.7 percent from the second quarter of 2016. Energy companies are forecast to post sales gains of 15.6 percent, followed by increases in the 7 to 8 percent range for tech, materials, and utilities. Sales at telecom companies are thought to be down 2.5 percent in the second quarter of 2017, while the remaining sectors should show sales growth in the 2 to 4 percent range.
The outlook for bottom-line EPS growth is quite mixed for the current quarter. Overall, S&P 1500 EPS is expected to rise 6.3 percent, though much of that is coming from a 420 percent surge in energy-company EPS, contributing about 2.6 percentage points to the 6.3 percent gain. Still, healthy gains are expected for tech (up 8.9 percent), financials (up 8.5 percent), and materials (up 7.0 percent). The weakest EPS expectations are in consumer discretionary, health care, and utilities, where EPS are expected to be down from a year ago.
As always, numerous stories lie under the surface, but in general, the solid gains in the economy are helping boost corporate sales and earnings, thereby supporting equity prices. And as always, risks to the outlook remain: global political tensions, uncertainty from the White House and Congress, and upcoming Fed rate increases top the list, but often it’s events not on people’s radar that have the greatest effects.
[pdf-embedder url=”https://www.aier.org/wp-content/uploads/2017/06/BCM_June2017_0.pdf“]Robert Hughes

Robert Hughes joined AIER in 2013 following more than 25 years in economic and financial markets research on Wall Street. Bob was formerly the head of Global Equity Strategy for Brown Brothers Harriman, where he developed equity investment strategy combining top-down macro analysis with bottom-up fundamentals. Prior to BBH, Bob was a Senior Equity Strategist for State Street Global Markets, Senior Economic Strategist with Prudential Equity Group and Senior Economist and Financial Markets Analyst for Citicorp Investment Services. Bob has a MA in economics from Fordham University and a BS in business from Lehigh University.


