July Business Conditions Monthly


The AIER Business Cycle Conditions Leaders index fell again in June, to a reading of 75, the second monthly decline in a row. The Coinciders index remained at 100 for a fourth month, while the Laggers index dropped to 58 from 75 in May. All three indexes remain above the neutral 50 level (chart 1). Recent declines in our Leaders combined with mixed results from other economic data suggest the economy may be entering yet another soft patch. However, with the Leaders index well above neutral, it is too early to consider the possibility of a recession.
The labor market continues to be strong, though wage gains remain moderate. Consumer spending, business investment, and housing have been the main sources of growth in recent years while exports and government spending have trailed. Recent signs of weakness in housing, auto sales, and consumer sentiment are a concern, though better economic growth globally and a somewhat weaker dollar may add support to export growth.
The majority of our Leaders continued expanding in June, though the Leaders index dropped slightly for the second month in a row. Eight indicators were expanding in June, while two were declining and two were neutral. That compares to eight expanding, one declining, and three neutral in May.
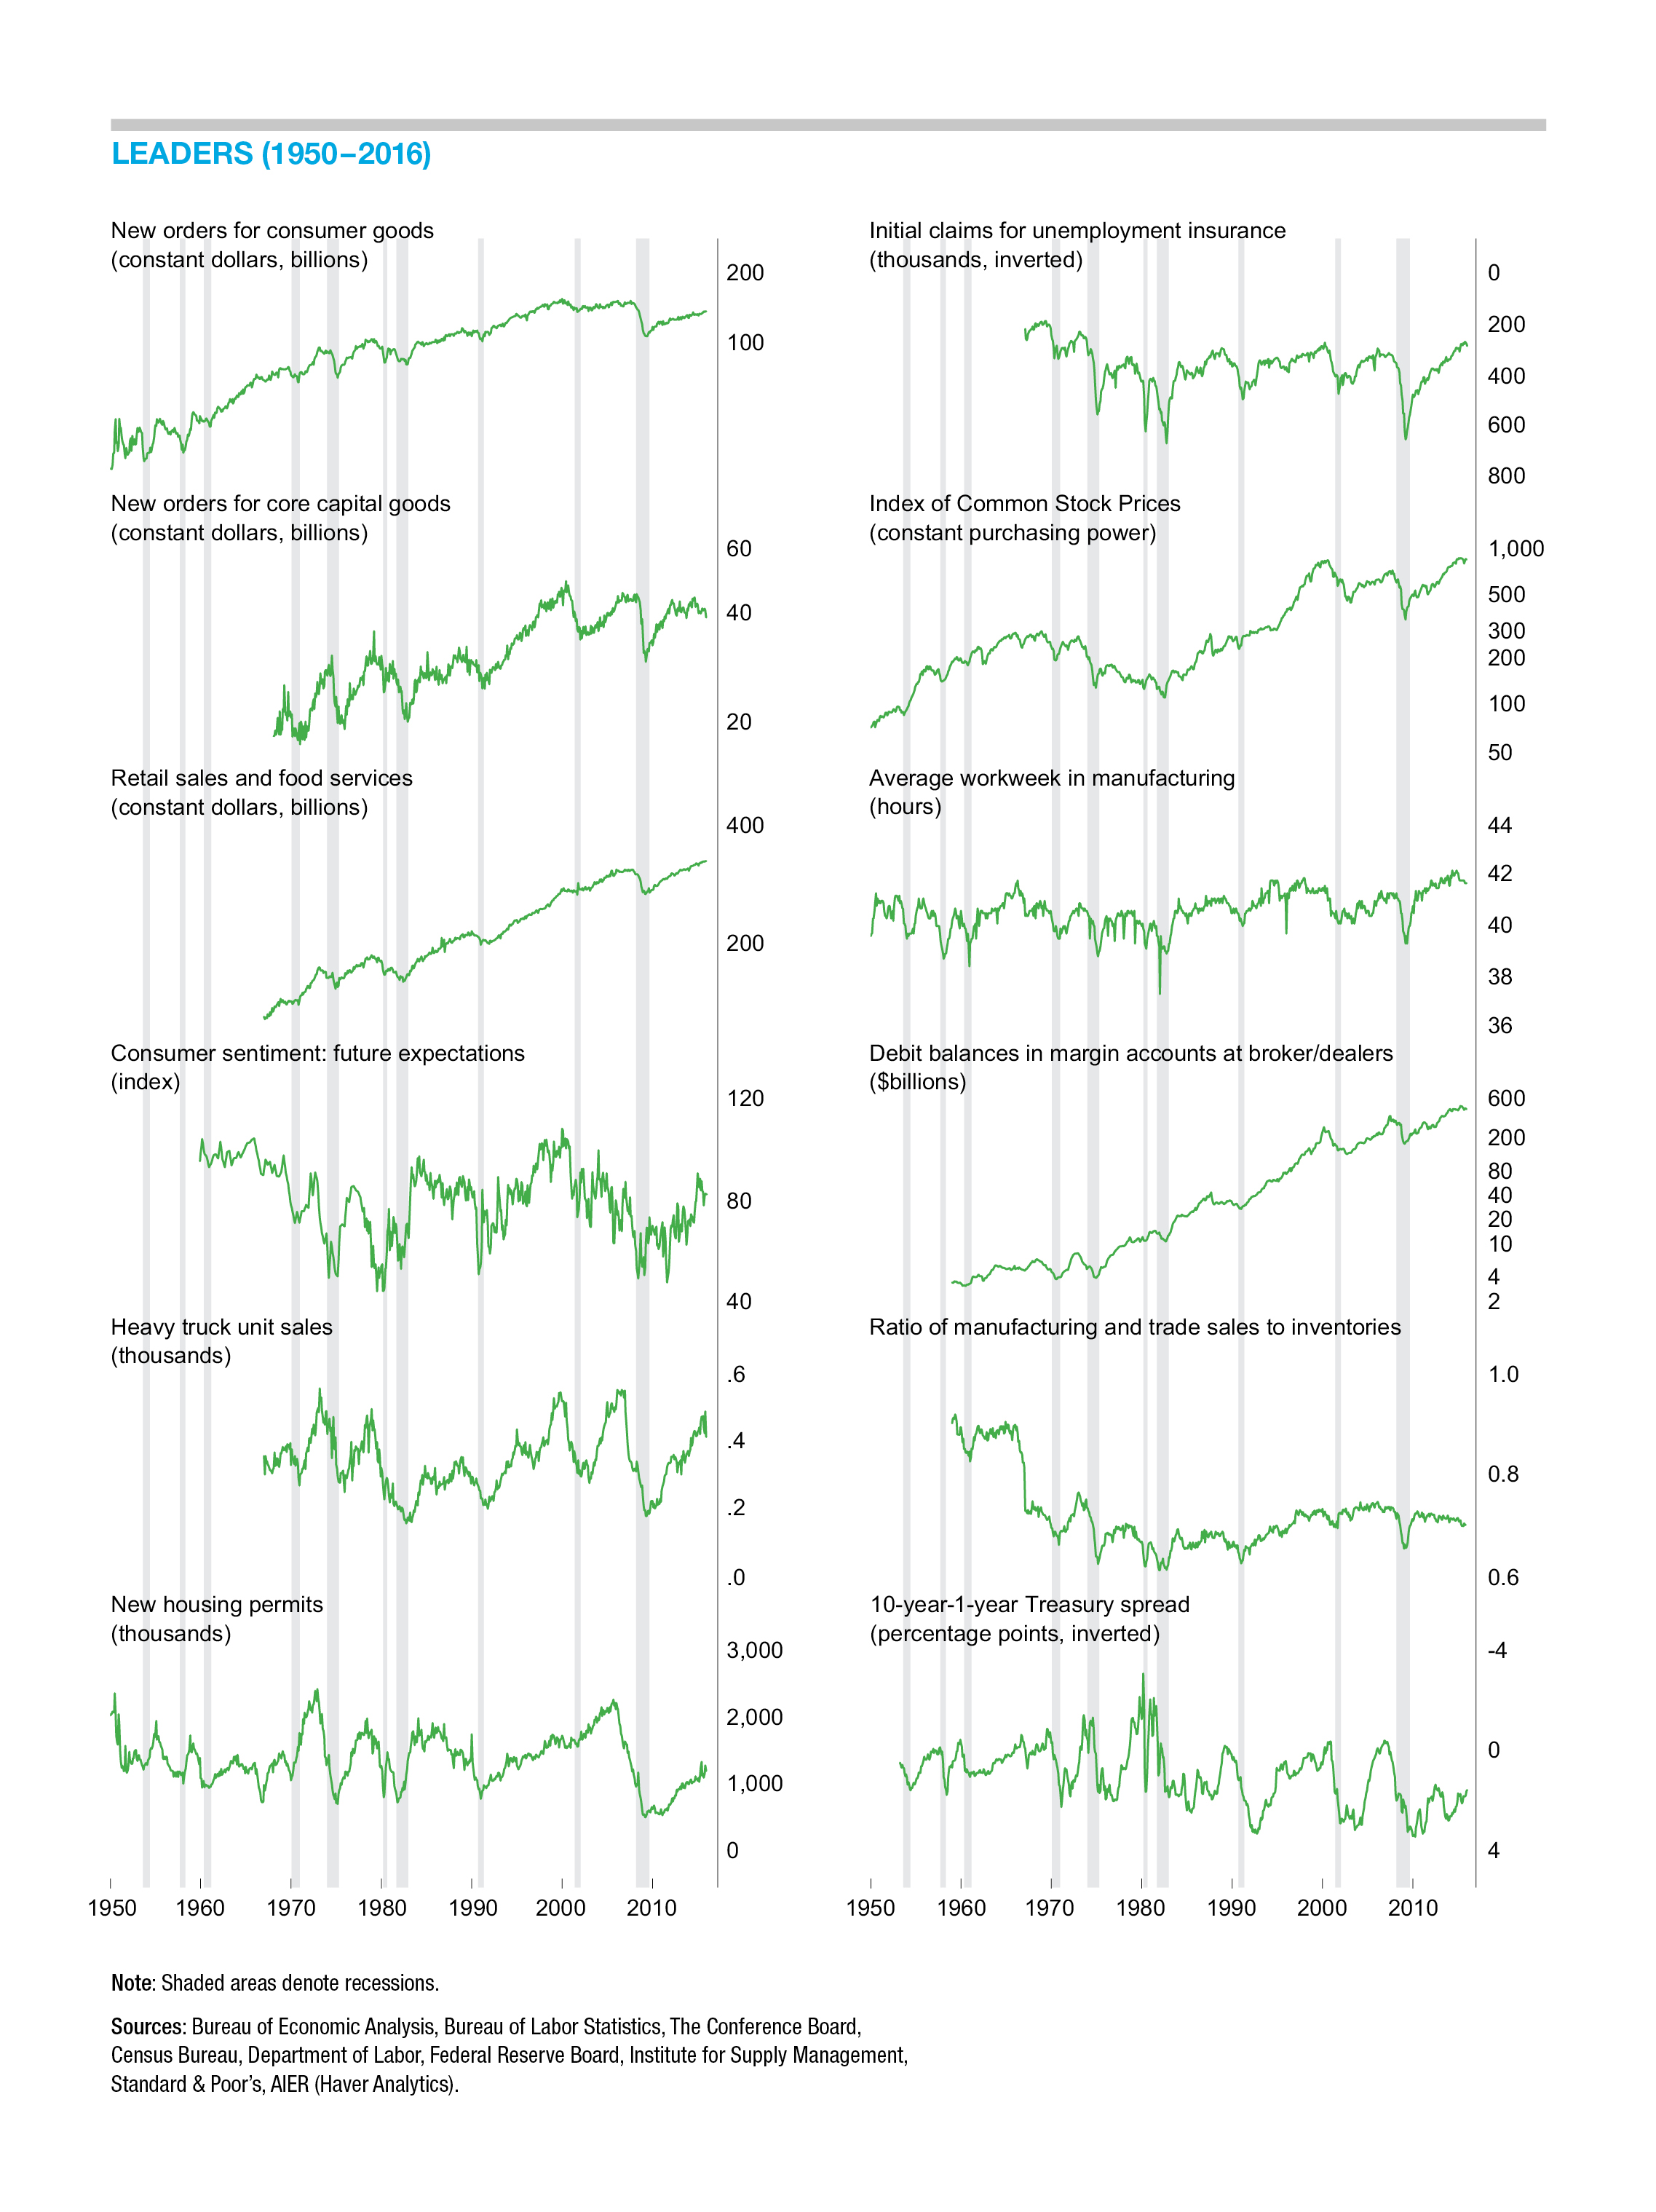
Housing permits was the one indicator to change direction in June, dropping from a neutral trend to a declining trend (read more on housing in the next section). Among the other Leaders, labor-market indicators are mixed. The initial-claims indicator remains in a favorable trend, while the average workweek in manufacturing is in a downtrend. Improved results since the average-workweek indicator was calculated indicate that this metric may flip back to a neutral trend in the next update. Both indicators are near extreme levels and have natural limits on their performance. It would not be surprising to see both eventually settle into a flat trend as they approach their limits. When this happens, the result will prevent the Leaders composite from reaching a perfect 100 reading. However, serious concern should be withheld until these indicators turn to a negative trend.
Other consumer-related indicators in our Leaders composite index are also mixed. Real retail sales are in a very solid uptrend, as is the sales-to-inventories indicator. The University of Michigan Index of Consumer Expectations is in an uptrend, though the latest monthly reading was sharply lower than the previous month’s. Optimism about the future seems to have been tempered recently by the steady stream of negative headlines out of Washington. This indicator may be at risk of decline and should be watched over the next few months. Real new orders for consumer goods has been in a flat trend for some time now, and that seems likely to continue.
The two business-investment indicators, real new orders for core capital goods and unit heavy-truck sales, are both in solid uptrends. Finally, two of the three financial indicators, real stock prices and debit balances in margin accounts, appear to be solidly favorable, while the yield-curve indicator trend is flat. All three of these indicators tend to be more-active signal generators.
The Coinciders index registered a perfect 100 for the fourth month, as all six of the indicators continue expanding. The four-month run of perfect readings is the first such run since February–May 2015. All six of the Coinciders are now showing strong expansion trends.
Our Laggers index fell 17 points in June, posting a 58 compared to 75 in the prior month. Two of the individual indicators—real manufacturing and trade inventories as well as real private nonresidential construction—fell in June, both switching from a positive trend to a flat trend. Overall, two indicators are trending higher, three are now trending flat, and one—core CPI—remained in a downward trend in June.
Big-Ticket Items Show Some Weakness
In January 2017, new-housing permits hit 1.3 million at a seasonally adjusted annual rate, the second-highest level since 2007 (exceeded only by a 1.36 million pace in June 2015). That is more than 2.5 times the 513,000 pace that marked the low point in housing in 2009, but still more than 40 percent below the peak pace of 2.263 million in September 2005. Since the January achievement, housing permits have fallen in three of the past four months, to a 1.168 million pace in May, about 10 percent below the January level.
The drop in permits may reflect softening demand resulting from a sharp rise in mortgage rates between mid-2016 and year-end 2016. As demand softens, builders cut back on new projects in order to maintain the tight supply of housing available. From a supply-and-demand perspective, the housing market in aggregate is tight by historical measures. The months’ supplies of new and existing homes are at the lower end of their historical ranges, providing support for rising home prices.
In December 2016, unit-vehicle sales hit an 18.32 million SAAR, the highest since July 2005. The December monthly-sales surge was part of a record-setting year for unit-vehicle sales in the United States. Unit-vehicle sales have been on a tear over the past few years, setting a new all-time sales record of 17.55 million in 2016 following a near-record 17.48 million in 2015. Since the December surge, unit sales have fallen in five of the past six months, to a 16.4 million pace in June, slightly more than 10 percent below the December pace. Given the high level of sales over the past couple of years, it is possible that the slowdown is simply consumer fatigue.
However, coinciding with the drops in housing permits and unit-vehicle sales is a fall-off in consumer expectations. When all three recent trends are considered, it suggests that consumers may be cutting back on big-ticket, long-commitment, interest-rate-sensitive purchases out of economic concerns. If that is the case, it could represent a more significant threat to the economy. While a tight labor market and rising income growth should support home and auto demand, demand may be eroded by the combination of rising interest rates and weakening confidence in the outlook for the economy.
Fed to Start Shrinking Balance Sheet Soon
After the June FOMC meeting, the Fed provided additional details about the process for shrinking its balance sheet. Key points include:
- The Fed will reduce securities holdings by decreasing its reinvestment of the principal payments. Payments will be reinvested only to the extent that they exceed gradually rising caps.
- Principal payments from maturing Treasury securities will have an initial cap $6 billion per month and will increase in steps of $6 billion at three-month intervals over 12 months until it reaches $30 billion per month.
- Principal payments from agency debt and mortgage-backed securities will have an initial cap of $4 billion per month and will increase in steps of $4 billion at three-month intervals over 12 months until it reaches $20 billion per month.
- The caps will remain in place once they reach their respective maximums so that holdings will continue to decline in a gradual and predictable manner until the balance sheet reaches an as-yet undetermined size.
- Reducing the balance sheet will result in a declining supply of reserve balances. The Fed anticipates reducing the quantity of reserve balances to a level significantly below recent years, but larger than before the financial crisis.
- The Fed affirmed that changes in the federal funds target rate will remain the primary tool.
Chair Yellen has said the process will likely begin in 2017 if economic developments continue along the current path. The process of unwinding the balance sheet is unprecedented. However, the Fed is making significant efforts to communicate its strategy and prepare markets. Given the early communication, the small initial size of the cuts in reinvestment, and the slow and predictable increases in the cutbacks, there is a reasonable likelihood that the change in policy will not significantly disrupt fixed-income markets. Nevertheless, long-term interest rates are likely to drift higher over the coming months and quarters.
Global Growth Picking Up. . . Somewhat
Monthly data on industrial production, exports, and retail sales have shown improving trends recently for many countries around the world, boosting prospects for stronger real GDP growth in the second quarter. Improved domestic demand, particularly for capital investment, should provide a boost to U.S. exports.
Exports have been one of the weaker areas of growth for the U.S. economy since the current expansion began in 2009. The combination of a strong dollar and weak growth in many countries dampened opportunities for U.S. exporters and restrained growth. Now, with signs of stronger growth globally and some pullback in the dollar, U.S. exports should finally get a bit of a tailwind.
Dollar Weakness May Continue
As growth around the world appears to be picking up slightly, talk of less stimulative central bank policies has already begun to impact the dollar. The aggressive policy responses from the U.S. federal government and the Federal Reserve pushed the United States into the lead in terms of recovering from the Great Recession. That lead was one of the contributing factors to dollar strength. Now, as growth firms up and as other central banks start moving toward less stimulative policy, some of the dollar strength may reverse.
A softer dollar should have several effects. As already mentioned, a weaker dollar makes exports more competitive in global markets and should provide a boost to demand. A weaker dollar will also boost the value of foreign sales and earnings when translated back into U.S. dollars for accounting purposes. On the negative side, a weaker dollar means higher imports prices and some upward pressure on prices overall. With consumer price increases still quite mild, the economy should be able to absorb those pressures.
[pdf-embedder url=”https://www.aier.org/wp-content/uploads/2017/07/BCM_July2017.pdf“]Robert Hughes

Robert Hughes joined AIER in 2013 following more than 25 years in economic and financial markets research on Wall Street. Bob was formerly the head of Global Equity Strategy for Brown Brothers Harriman, where he developed equity investment strategy combining top-down macro analysis with bottom-up fundamentals. Prior to BBH, Bob was a Senior Equity Strategist for State Street Global Markets, Senior Economic Strategist with Prudential Equity Group and Senior Economist and Financial Markets Analyst for Citicorp Investment Services. Bob has a MA in economics from Fordham University and a BS in business from Lehigh University.


