Inflation
Scorecard
The outlook for inflation remained neutral in May, according to the AIER’s Inflationary Pressures Scorecard. Slightly more than half, or 13 out of 23 indicators tracked in the Scorecard, support upward pressure on inflation, up from 10 in the previous month. The remaining 10 indicators point to downward inflationary pressure.
The added inflationary pressure in May came mainly from faster growth of average hourly earnings and personal income, which could potentially drive up consumer demand. Significantly faster retail sales growth in recent months reinforces this possibility.
Supply forces somewhat offset inflationary pressure from demand. Capacity utilization in manufacturing fell, and the ratio of inventories to sales rose, suggesting that increased demand may be met without much risk of a rise in prices.
On the money and banking front, even with rising interest rates, the money supply and revolving consumer credit grew at a faster pace. With more money created in the economy, higher consumer prices are likely.
Inflationary pressure from costs and productivity is nearly balanced. There are no signs that inflation will either significantly rise or fall in the near future.
Consumer Price Index Analysis
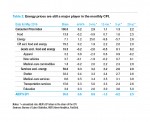
The Consumer Price Index, or CPI, advanced 0.2 percent in May from April, slower than the 0.4 percent growth in the prior month. The slowdown was due to falling food prices and a smaller increase in energy prices.
After climbing 0.2 percent in April, food prices dropped 0.2 percent in May. Over the past 12 months, food prices only grew 0.7 percent, much below their five-year average annual growth rate of 1.8 percent.
Energy prices are the most volatile component of the CPI basket. They rose 1.2 percent over the previous month and 25 percent from three months earlier but remained 9.8 percent lower compared with 12 months ago.
Core CPI, which excludes volatile food and energy prices, has exhibited a much more stable trend over time. It grew 0.2 percent in May, the same pace as April, driven mostly by strong service price growth, which was also the case the previous month.
Core goods, excluding food and energy, fell 0.2 percent from April and were down 2 percent from three months ago. A number of household goods, from new vehicles and household furnishings to recreation commodities, posted declines. But one product stood out with a significant price increase. In May apparel prices jumped 0.8 percent from April after sharply falling for the previous two months.
Core services, excluding energy, continued to grow at a steady pace. Their prices rose 0.3 percent in May, within their normal growth range of 0.2 percent to 0.3 percent each month. However, over the past 12 months, core services have grown 3.2 percent, faster than the 2.6 percent growth seen for the past five years or 2.8 percent over the past 20 years.
Among all services, medical care and shelter grew at the fastest pace over the past 12 months. But in the longer run (over the past five to 20 years) the fastest-growing service appears to be education, followed by medical care.
Everyday Price Index
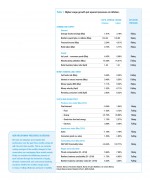
AIER’s Everyday Price Index rose 0.6 percent in May from April, led by a 6.6 percent jump in gasoline prices, which were partially offset by a 0.5 percent drop in grocery prices. The EPI measures changes in prices that people see in everyday purchases such as groceries, gasoline, and admissions.
The more widely known price gauge, the Consumer Price Index reported by the Bureau of Labor Statistics, increased 0.4 percent for the month on a seasonally unadjusted basis and 1.1 percent over the past 12 months. The EPI is not seasonally adjusted, so we compare it with the unadjusted CPI.
The EPI’s increase was driven by a 6.6 percent jump in gasoline prices. A downturn in U.S. crude-oil production has helped push gas prices higher in recent months. The possibility of renewed production has the potential to dampen further gasoline price hikes.
Grocery prices fell 0.5 percent, declining across all major food categories. On the other hand, restaurant prices increased 0.2 percent in May. Grocery prices have tended to grow more slowly than restaurant prices since the end of the Great Recession in 2009.
https://www.aier.org/epi
Next/Previous Section:
1.Overview
2. Economy
3. Inflation
4. Policy
5. Investing
6. Pulling It All Together/Appendix


