Inflation
Scorecard
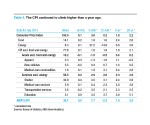
Measured by the year-over-year change in the Consumer Price Index (CPI), prices increased for the second consecutive month for the first back-to-back gains since the start of 2015. But the latest AIER Inflationary Pressures Scorecard suggests that inflationary pressures are easing for the months ahead. Out of 23 indicators tracked in the scorecard, 12 point to rising pressure, down from 17 last month. Eight suggest falling pressure and three indicate no change (Table 1).
Strong consumer demand, reflected by steadily growing retail sales, continued to help push up inflation. The average hourly earnings growth dropped in the past three months. Personal income growth, however, trended up. On balance, there appeared to be rising inflationary pressure on the consumer side. On the producer side, industrial production grew at a fast pace, somewhat offsetting this.
Money velocity and consumer credit have picked up, indicating that money changed hands faster and consumers borrowed more. Both point to upward inflationary pressure.
The major contributions to easing inflationary pressure in July came from the import price index, commodity prices, and productivity. Lower import prices were explained by the stronger U.S. dollar. Productivity gains mainly resulted from lower labor costs.
Consumer Price Index Analysis
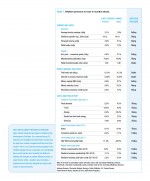
The CPI advanced a not-seasonally adjusted 0.2 percent from a year ago in July after rising 0.1 percent in June over the previous year. On a month-to-month basis, the adjusted index rose 0.1 percent in July for the sixth consecutive month. Over the past five years on an annualized basis, the CPI has risen 1.8 percent, below the Fed’s 2 percent inflation target (Table 2).
Food and energy prices continued to climb in July, but at slower paces compared with June. Households paid 0.2 percent more for food and 0.1 percent more for energy. Food and energy are considered volatile in the short term but relatively stable in the long run. But since last summer, energy prices have posted large swings, rising 27.2 percent in July from three months earlier and falling 14.8 percent from 12 months ago.
Excluding food and energy prices, the core CPI rose 0.1 percent in July from June, the same rate as the overall index. Breaking down the core CPI, core goods prices declined 0.1 percent while core services rose 0.2 percent.
Among all the core goods listed in Table 2, the “new vehicles” segment was the only contributor to the decline in core goods prices, slipping 0.2 percent from a month ago. This is the first decrease for new vehicles since January. Apparel, on the other hand, posted a 0.3 percent increase in July after falling for three straight months.
Services excluding energy advanced 0.2 percent from last month, outpacing core goods. This continues the long-term trend of core services growing at a faster pace than core goods. For example, core service prices rose 2.6 percent from a year earlier and climbed 2.8 percent, on an annualized basis, over the past 20 years, compared with increases of 1.8 percent and 2.1 percent for core goods. While most services tracked in Table 2 show rising prices, transportation turned out to be cheaper in July, falling 0.2 percent from June. This is the first time since December 2014 that consumers experienced falling transportation costs.
Everyday Price Index
AIER’s Everyday Price Index (EPI), which is not seasonally adjusted, was unchanged in July after increasing 0.8 percent in June over the month before.
The CPI was also unchanged in July from June on a not-seasonally- adjusted basis after rising 0.4 percent in June compared with May.
Over the past 12 months the EPI has dropped 2.3 percent, compared with the CPI’s 0.2 percent gain. The difference stems from the drop in energy prices. The EPI gives more weight to energy.
Unadjusted energy prices slid 0.5 percent in July from the previous month after jumping 3 percent in June. Gasoline prices declined 0.2 percent in July, with a 0.4 percent drop in regular offset by a 1 percent increase in premium blends. Gasoline prices have fallen 22.3 percent over the past 12 months.
Personal-care prices were mixed in July, with personal-care products slipping 0.1 percent and services rising 0.1 percent. Prescription drugs increased 0.1 percent in July and have risen 4.4 percent over the past year.
Food prices edged up 0.1 percent in July with a 0.2 percent rise in food-at-home and no change in food-away-from-home. Food-at-home prices were led higher by meats, dairy, and bakery products.
On Sept. 16, AIER will post the latest EPI data and a newly revised Everyday Price Index. Find it at https://www.aier.org/epi. Read more about the changes to the EPI in the October edition of our Issue Brief, “Capturing shifts in everyday prices,” at https://www.aier.org/issue-briefs


