Improving the Everyday Price Index


What is EPI?
The EPI aims to reflect the price uncertainty (i.e., unexpected and unavoidable price changes) people face in connection with purchases they cannot easily adjust from one month to the next. The EPI tracks a subset of prices out of the broader Consumer Price Index (CPI), reported by the Bureau of Labor Statistics (BLS). The CPI includes prices of all goods and services purchased by a typical urban consumer. The EPI, in contrast, includes only the goods and services purchased on a day-to-day basis. Such purchases cannot be easily postponed or forgone, forcing consumer budgets to absorb the fluctuations in prices as they happen.
The EPI includes prices of such everyday items as food, utilities, fuel, prescription drugs, telephone services, etc. These products have to be purchased on a regular basis, essentially requiring that people pay whatever the current price is. This can result in a sticker shock at the pump or the checkout register. The EPI aims to reflect this experience.
The EPI excludes infrequently purchased items, such as cars, appliances, furniture, or apparel. Purchases of such products can be planned for or postponed, eliminating the unexpected shock an increase in price can deliver to household budgets. The EPI also excludes the cost of housing. Housing cost, be it rent or mortgage payment, is contractually fixed for at least some length of time. Even a dramatic change in home prices does not translate into an immediate jump in rents or mortgage payments the way, say, an increase in oil price translates into higher gasoline prices at the pump.
Methodology: Constructing the EPI
The EPI is constructed using the same data BLS uses in constructing the more widely known CPI. A change in the EPI is a weighted average of the changes in prices of its components. Each component is weighted by the expenditure share devoted to it. These weights are identical to the ones BLS uses in constructing the CPI. They are derived from the Consumer Expenditure Survey conducted by BLS. This means that the EPI assumes the same consumer expenditure patterns the CPI does. The two methodologies are consistent.
The expenditure patterns, however, evolve over time. Changing preferences and introduction of new products affects people’s spending decisions. To account for this, BLS updates the Consumer Expenditure Survey every other year, and introduces new weights for the CPI. By incorporating these weights, the EPI takes into account the change in spending patterns.
There is another source of the change in relative weights of the EPI components. Even if there is no change in people’s preferences and they buy, for example, exactly the same amount of gasoline every month, a sharp increase in the price of gasoline would cause it to eat up a larger portion of consumer budget. This increases the so-called relative importance of gasoline among all products included in the EPI.
As originally constructed, the EPI did not take into account such changes every month. Instead, it adjusted the relative weights of components only once a year, in January.
The newly available monthly data allow us to adjust the relative importance of components every month. This makes the month-to-month changes in the EPI more representative of actual changes in the expenditure patterns, instead of lumping them all into the month of January. We were also able to make these adjustments retroactively to the past value so the EPI, making the entire EPI series fully comparable.
The full technical description of the exact steps involved in computing the EPI is provided in the Technical Note below.
Small Cumulative Difference, Notable Monthly Differences
Although the long-term EPI trend remains similar with the new weighting methodology, there can be considerable changes in certain months. The new methodology produces the most noticeable difference in the EPI during months when prices are especially volatile, and every January, where the old methodology used to lump monthly adjustments together.
Chart 1 offers the EPI as calculated by the old and new methodologies and compares it to the CPI. The long-term trend is not significantly affected by the change in methodology. The EPI, whether computed by the original or the new methodology, tracks the CPI closely until about 2002, after which growth in the EPI accelerates beyond that of the CPI and the EPI becomes much more volatile.
Technical Note
The EPI is constructed using re-weighted CPI data provided by the BLS.
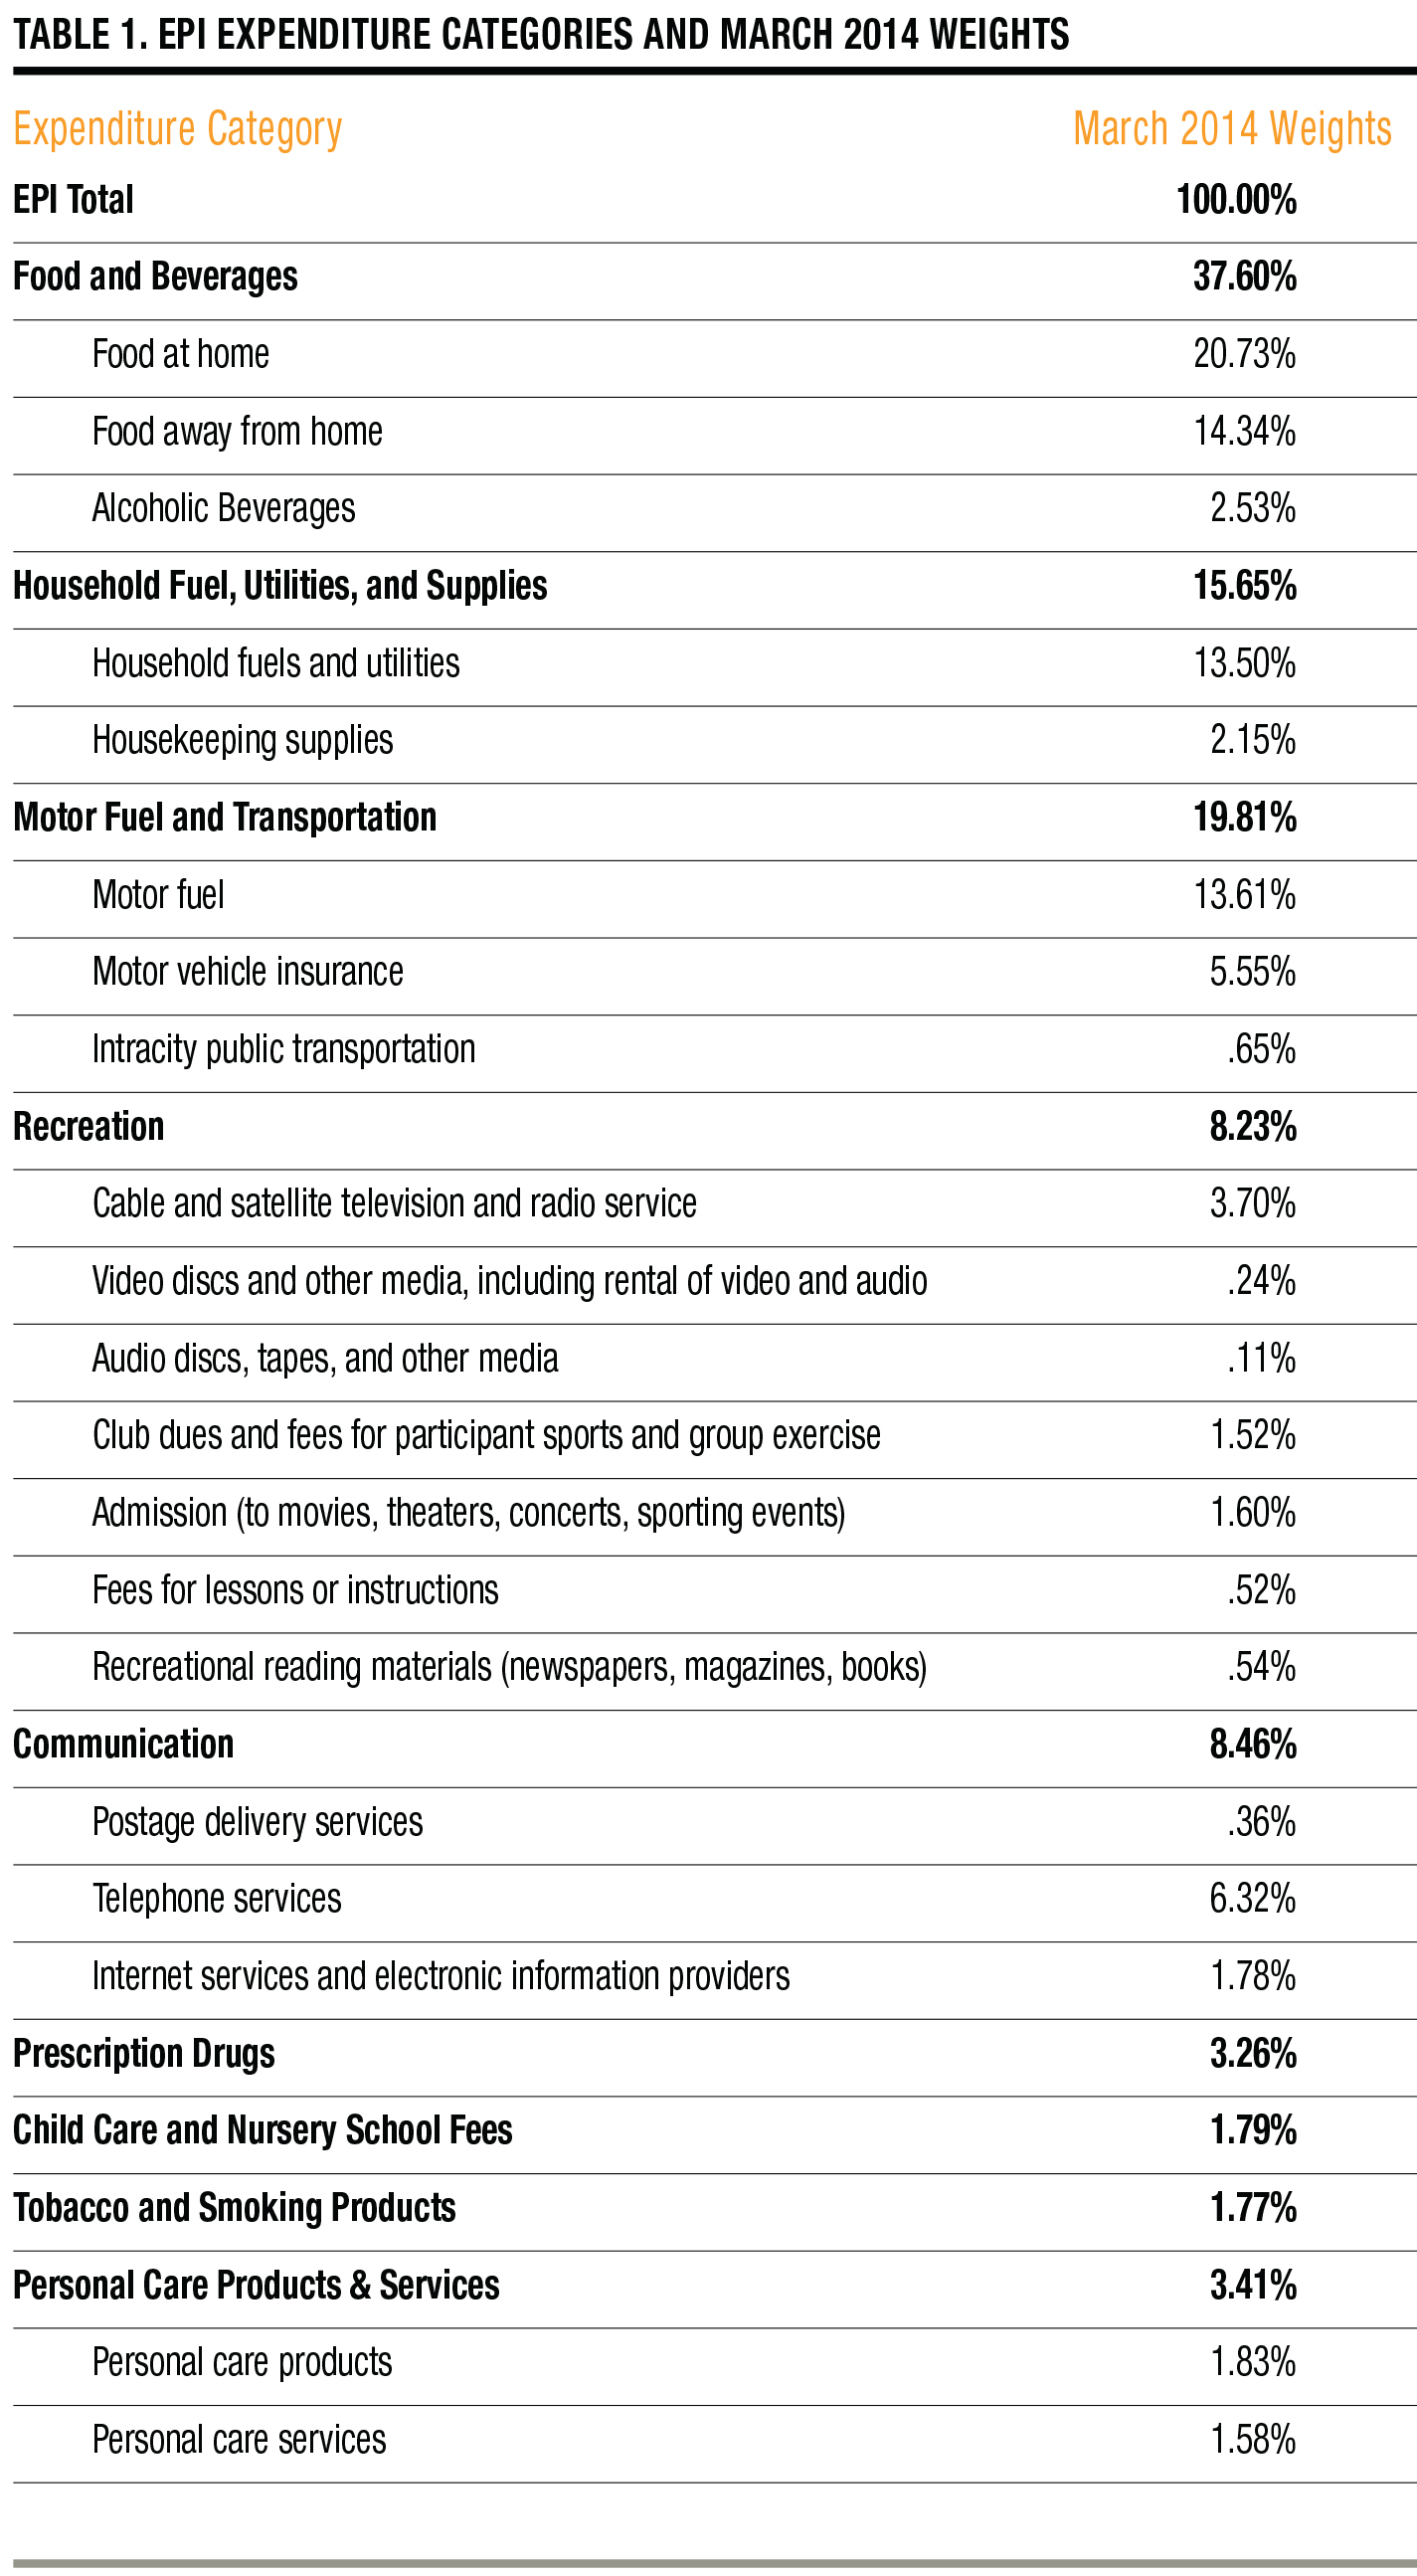
In the first step, appropriate categories of goods and services are selected to be included in the EPI. Table 1 lists these categories and their relative weights in the EPI as of March 2014. The share of the EPI components in the total CPI basket of goods and services has fluctuated slightly over the years, but remained around 40 percent.
The next step is to derive the appropriate weights for each component of the EPI. The relative importance values of the CPI components are used to calculate weights of the EPI components. For example, in March 2014 the relative importance of “Food at Home” in the CPI was 8.184. This means that Food at Home accounts for about 8.18 percent of total expenditures of a typical consumer. In the same month, all everyday purchases, as reflected by the EPI components taken together, accounted for about 39.48 percent of total expenditures. Therefore, Food at Home accounts for about 20.7 percent of all everyday purchases (8.184 / 39.48 = 0.207). This is the weight that price changes in the Food at Home category receive when computing the overall EPI change.
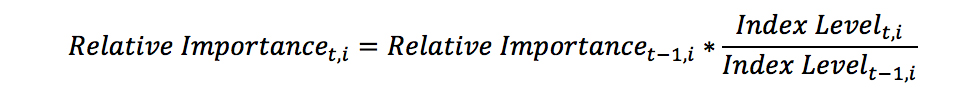
As originally constructed, the EPI used annual category weights, released by the BLS in December of each year. Only during January would relative weights be re-calibrated based on the change in relative importance. The BLS now provides monthly relative importance adjustments. According to the BLS, the monthly relative importance for each category i can be estimated by the formula:
The updated EPI methodology uses these monthly relative importance values in calculating the weights for the EPI each month.
It should be noted that this does not make the EPI a chain-weighted index. A chain-weighted index, such as a chained CPI, uses contemporaneous monthly expenditure estimates to create weights for each category included in the index. The goal is to capture the effect of people reacting to rising prices by possibly switching to cheaper substitute products. To do so, monthly expenditure data are requited. Our EPI methodology does not rely on monthly expenditure estimates. Instead, we update the weights each month based only on the change in prices, implicitly assuming that no substitution between products takes place.
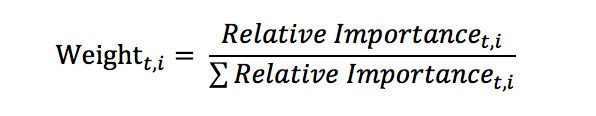
Weights for each components of the EPI, notated as i for time period t, are calculated as follows:
Price series for each component of the EPI are taken from the data provided by the BLS without seasonal adjustments. By using not seasonally adjusted price data, the index reflects prices actually paid by consumers every month.
The monthly composite EPI percentage change is calculated as follows:
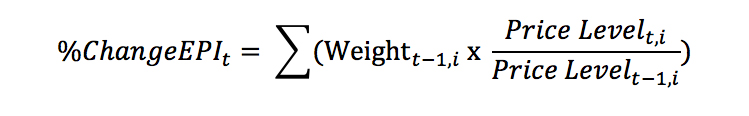
The percentage change is applied to the previous month’s EPI level to derive the new monthly level of the index.
Luke F. Delorme

Luke F. Delorme is Director of Financial Planning for American Investment Services. Articles do not constitute personal investment advice. Please seek the advice of a professional before implementing any financial decision. Luke can be reached at LukeD@americaninvestment.com.


