Housing Outlook Restrained
The recovery in the single-family housing market has lagged the pace of the smaller multi-family portion—as measured by home sales, new construction, and permits for new construction. Our analysis of the single-family housing market suggests that, despite the prospect of better jobs and income growth as the economy picks up, rising mortgage rates and restrictive credit conditions are likely to restrain what would otherwise be a more robust growth path.
For digital or print copies of AIER research, click here.
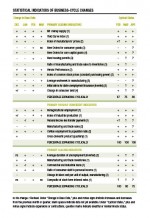
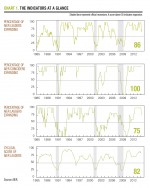
Our Business-Cycle Conditions indicators improved, continuing the recovery from the sharp February drop. The share of leading indicators that expanded in April rose to 86 percent, up 11 percentage points from the prior month. A reading of more than 50 percent of leaders suggests continued economic growth. An unusually high number of indicators, nine out of 24, were judged to have a neutral trend—reflecting the continuing effects of temporary weather distortions earlier in the year—and only two were deemed negative. As a point of comparison, over the past 30 years, our model has averaged about four neutral readings per month. Our cyclical score for the leading indicators, derived from a separate mathematical analysis, fell slightly, to 82 from 86 in the prior month. But the salient fact remains that the cyclical score, too, is above 50. With both the leaders’ diffusion index and cyclical score registering above 50, the economic outlook, while not robust by historical measures, is still positive. Key takeaways from the latest readings of AIER’s BCC indicators include:
Economic Outlook
Leading:
Among the leading indicators, six were judged to have a positive trend in April, with four of those six hitting new cycle highs: M1 money supply, yield curve index, index of common stock prices, and initial claims for state unemployment insurance (inverted). Conversely, just one indicator was judged to have a negative trend: ratio of manufacturing and trade sales to inventories. As mentioned above, five indicators were assessed as neutral, a result consistent with a higher degree of uncertainty in the economic data related to the severe weather patterns earlier in the year.
Coincident: Four out of six of our coincident indicators continue to show positive trends, resulting in a perfect 100 reading for the 28th month in a row. All four of these indicators also hit new cycle highs: nonagricultural employment, index of industrial production, civilian employment to population ratio, and gross domestic product. Personal income excluding transfers as well as manufacturing and trade sales were judged to be neutral last month.
Lagging: AIER’s index of lagging indicators was unchanged last month, with the portion of laggers registering a positive trend again at 75 percent. Among the individual indicators, all six of the laggers maintained their trends from the prior month: change in labor costs per unit of output for manufacturing continued its negative trend, while positive trends and new highs were recorded for commercial and industrial loans, manufacturing and trade inventories, and the ratio of consumer debt to income. The composite of short-term interest rates and average duration of unemployment both were neutral again last month.
In aggregate: Thirteen of our 24 indicators were judged to have positive trends, with 11 hitting new cycle highs last month; nine were considered neutral; and two were in downtrends. Overall, our three composite indexes remained well above 50 percent, which suggests continued economic growth in the months ahead (Chart 1).
Housing Boom-Bust
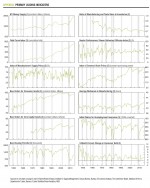
Single-family housing starts and permits hit highs of 1,823,000 and 1,798,000, at annualized rates, in January 2006 and September 2005, respectively. In the recession that followed, declines of more than 80 percent in both measures resulted in all-time lows in activity in 2009 (Chart 2). Not surprisingly, home sales—both new and existing—plunged as well. As economic theory would suggest, a tumble in home values accompanied the collapse in demand. As values fell, many home buyers were left with negative home equity, contributing to a fall in supply, or the number of homes offered for sale.
The lingering effects of the housing boom and bust as well as the impact on the financial system are important factors in the outlook for single-family housing today. The severe recession that followed the housing collapse resulted in more than 8 million lost jobs and a surge in mortgage defaults. These defaults contributed to the problems in the financial markets and banking system. As losses mounted, bank capital began to dwindle, putting many banks and other financial institutions at risk of insolvency.
Housing Headwinds
The inventory of existing single-family homes for sale remains very low—1,740,000 units in March 2014, according to the National Association of Realtors, about on par with levels seen in the 1990s. The low inventory combined with the mild pickup in home sales—existing single-family homes sold at an annual rate of 4.04 million in March—caused the months’ supply (inventory divided by selling rate) to fall back to about five months, close to the levels of the pre-recession bubble (Chart 3).
Housing affordability is measured as an index with a value of 100 when median family income qualifies for an 80% loan-to-value (LTV) mortgage on a median-priced existing single-family home. Affordability is considered high when the index moves above 100.
A high level of affordability, in the range of 120 to 140, was sustained from 1993 through 2004, including the run-up to the housing bubble. The Federal Reserve’s low interest rate policy and purchases of treasury and mortgage-backed securities have held interest rates at extremely low levels. The combination of falling home prices and lower interest rates pushed the affordability index to a record high of 213 in January 2013.
However, between January and August 2013, the affordability index declined sharply, from 213 to 158. That coincided with a sharp rise in long term interest rates; The 10-Year Treasury note yield rose from 1.9 percent to 2.9 percent, a 52 percent increase, while the rate on a 30-year conventional mortgage rose from 3.4 percent to 4.4 percent, a 29 percent increase.
More recently, the index has recovered part of the early 2013 drop, rising to 176 as of February 2014. The fact that interest rates remain low by historical standards and the affordability index remains well above 100 are two reasons for some degree of optimism about the single-family housing market.
However, while the economy has regained most of the jobs lost during the recession, unemployment remains uncomfortably high, and wage gains, while positive, are very modest, keeping a cap on the contribution to affordability from income growth. Furthermore, the slowly strengthening economic recovery and tapering of the Federal Reserve’s large-scale asset purchases are putting upward pressure on mortgage rates and, therefore, downward pressure on housing affordability. The change in the affordability index and the prospect for additional declines suggests a negative outlook for single-family home sales (Chart 4).
The most important factor for housing market activity over the next several quarters, however, may be the flow of credit—the willingness of lenders to make mortgage loans. The latest Senior Loan Officer Opinion Survey conducted by the Federal Reserve indicates that lending standards tightened in the first quarter of 2014 while demand for mortgages fell sharply. Notably, that was the first such tightening following five quarters of easing standards. During that period of easing, the number of loans approved at a high loan-to-value ratio (i.e., above 90 percent, meaning a down payment of less than 10 percent) surged to levels last seen during the housing bubble (Chart 5). It is plausible that the tightening of lending standards was a reaction to the surge in high LTV loans, and that these types of loans will have a harder time gaining approval in coming quarters.
Overall, a better economy should boost employment, income, and consumer confidence, but the effects of those gains on the housing market may largely be offset by rebounding home prices and rising interest rates (Chart 6). Declining affordability combined with the continued reluctance of lending institutions to grant mortgage credit to borrowers may tip the scales against the housing market.


