Gasoline Prices Rebound and Food Prices Stabilize
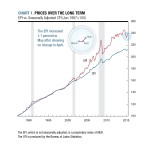
The Everyday Price Index (EPI) increased 1.1 percent in May after showing no change in April. On a not-seasonally-adjusted basis, the CPI increased 0.5 percent in May after rising 0.2 percent in April. AIER’s EPI is not seasonally adjusted.
On a seasonally adjusted basis, the CPI increased 0.4 percent in May.
Over the past 12 months the EPI has decreased 2.7 percent while the CPI has not changed. The difference between the EPI and the CPI has been due to a drop in energy prices. The EPI assigns a greater weight to energy.
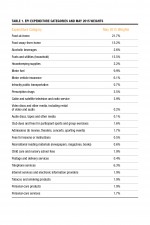
Energy prices increased 5.2 percent in May, leading the EPI higher. After stabilizing in April, gasoline prices rose 10.4 percent, with regular gasoline rising 10.7 percent, mid-grade increasing 9.6 percent, and premium jumping 10 percent. Even though gasoline prices registered a large increase in May, over the past 12 months, gasoline prices have dropped 25 percent. Looking at home energy prices, electricity prices increased 0.7 percent and natural gas prices decreased 1.3 percent.
The other major component of the EPI is food, which had only a .01 increase in May, with a 0.2 percent increase in food-away-from-home offset by a 0.1 percent decrease in food-at-home. Food-at-home prices were led lower by meats, with poultry decreasing 1.7 percent and seafood dropping 0.8 percent. Prices for dairy products registered a 0.7 percent decline. Offsetting the decreases in meats and dairy, fresh fruits and vegetables rose 1.0 percent. Over the past 12 months, food-at-home has increased 0.6 percent and food-away-from-home has increased 3.0 percent.
Personal-care prices were mixed in May, with personal-care products decreasing 0.2 percent and personal-care services increasing 0.2 percent. Prescription drugs edged 0.1 percent higher in May but have increased 5.3 percent over the past 12 months. Rounding out the EPI, there was a notable drop in telephone and internet service prices, which declined 0.4 percent and 1.1 percent respectively. In contrast, entertainment prices increased, with admissions to movies and concerts rising 0.9 percent and alcoholic beverage prices growing by 0.2 percent.
About the EPI
AIER’s Everyday Price Index (EPI) measures the changing prices of frequently purchased items like food and utilities. We do this by selecting the prices of goods and services from the thousands collected monthly by the Bureau of Labor Statistics in computing its Consumer Price Index. The EPI basket contains only prices of goods and services that Americans typically buy at least once a month, excluding contractually fixed purchases such as mortgages. Our staff economists weight each EPI category in proportion to its share of Americans’ average monthly expenditures. In order to better reflect the out-of-pocket prices that consumers experience on a daily basis, the EPI does not seasonally adjust prices.
To learn more about our methodology, view the weights assigned to each component, and browse past EPI updates, visit AIER’s EPI Methodology page.


