Gas Prices Not a Risk to Growth
The recent rise in energy prices—crude oil and gasoline in particular—began in November 2013. That’s the time that normal seasonal demand tends to push prices higher; it’s also around the time that protests and violence in the Ukraine appeared to be headed for significant escalation. Between November and May 2014, average retail gasoline prices in the U.S. jumped about 15 percent, with crude oil posting a similar rise. Just as tensions in the region began to ease, renewed sectarian fighting inside Iraq began pushing prices higher still.
For Digital or Print Copies of AIER Research, Click Here
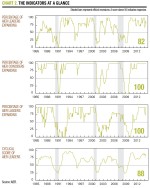
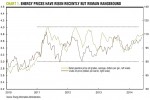
From a slightly longer perspective (the past three and a half years, since the beginning of 2011), however, both crude oil prices and gasoline prices have remained range-bound, with crude moving between $80 and $110 per barrel and gasoline fluctuating between $3.25 and $4.00 per gallon (Chart 1). True, in general rising energy prices are an unwelcome development and viewed as a threat to the health of the economy. However, these increases to date are not great enough to cause consumer spending to retrench significantly, harming the broader economy. Our Business-Cycle Conditions indicators pulled back in the latest month, following three consecutive increases. The share of leading indicators that expanded in June dropped to 82 percent, down 8 percentage points from a reading of 90 percent in May. Our cyclical score for the leading indicators, derived from a separate mathematical analysis, rose just one percentage point to 88 from 87 in the prior month. Despite the decline in the leaders’ diffusion index, both measures still register values well above 50, suggesting that the economic outlook remains positive, with a very low probability of recession in the coming quarters. Key takeaways from the latest readings of AIER’s BCC indicators include:
Economic Outlook
Leading:
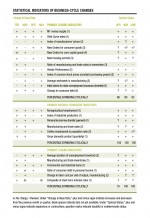
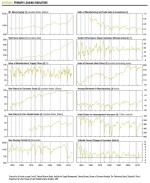
Among the 12 leading indicators, eight were judged as “clearly expanding” in June, one was deemed “probably expanding,” one was considered “indeterminate”—i.e., having no discernable trend—and two were “clearly contracting.” Among those eight indicators that were clearly expanding, six hit new cycle highs: M1 money supply, yield curve index, new orders for core capital goods, index of common stock prices, average workweek in manufacturing, and initial claims for state unemployment insurance (inverted). The ratio of manufacturing and trade sales to inventories and vendor performance were the two indicators that were contracting, while the new housing permits was the one with no discernable trend.
Coincident: All six of our coincident indicators continued to expand in June, resulting in a perfect 100 reading for the 30th month in a row, confirming that the U.S. economy continues to expand. Two of these indicators also hit new cycle highs: nonagricultural employment and index of industrial production.
Lagging: AIER’s index of lagging indicators registered a perfect 100 percent reading again in June as four out of four indicators with a trend were clearly expanding, and all four hit new cycle highs. These four indicators are: average duration of unemployment, manufacturing and trade inventories, commercial and industrial loans, and the ratio of consumer debt to income. The composite of short-term interest rates and change in labor costs per unit of output for manufacturing both were indeterminate last month.
In aggregate: Nineteen of our 24 indicators were judged to be clearly expanding or probably expanding last month, with 12 of the expanding 19 hitting new cycle highs. Three indicators were considered to have no discernable trend, while two indicators were clearly contracting. Overall, our three diffusion indexes remained well above 50 percent, pointing to continued economic growth in the months ahead (Chart 2).
Energy Fundamentals
Stepping back from geopolitical events and normal seasonal patterns, the fundamentals for both crude oil and gasoline indicate prices are likely to remain range-bound. Inventory levels for gasoline are currently 219 million barrels, approximately the 68th percentile of the range since 1990. Inventory of crude petroleum, excluding the strategic petroleum reserve, are even more robust at 1.1 billion barrels, or roughly the 92nd percentile of its range since 1990 (Chart 3).
In addition to the high levels of inventory currently in place, growth of refinery output and crude oil extraction both have accelerated in recent months, to 4.8 percent and 16.1 percent on a year-over-year basis, respectively (Chart 4).
Impact on Economy
Higher energy prices can redirect consumer spending away from other goods and services, and to the extent that money flows outside the domestic economy to foreign suppliers, higher energy prices are bad for the growth outlook. In the current environment where U.S. economic growth is already viewed by most analysts as weak, the potential of rising energy prices should not be ignored. However, once again, it’s important to put the potential impact in perspective.
Since the beginning of 2011, the U.S. economy has added 7.6 million new jobs, or about 190,000 per month. When combined with increases in hours worked and with rising hourly earnings, the total additional wages and salaries added to the economy is about $800 billion, or about $20 billion per month at an annual rate. By contrast, consumer spending on gasoline has increased just $25 billion, or about $0.6 billion per month. So from the perspective of the broader economy, gains in jobs, hours worked, and hourly earnings collectively provide far more impetus to the expansion than the modest gasoline price increases exert drag (Chart 5).
For the consumer, the impact of rising gasoline prices may be more psychological than financial. As consumers benefit from better job creation, longer hours, and rising wages, spending on gasoline as a percentage of total personal income declines. In addition, as consumers replace older cars with more fuel efficient vehicles, the share of fuel in household budgets declines, further protecting the economy from fuel price rises. For much of 2011, spending on gasoline accounted for about 2.8 percent of total personal income. As of April 2014, gasoline expenditures accounted for about 2.5 percent. Likewise, when measured against total consumer spending, gasoline expenditures have fallen from about 3.5 percent of total personal consumption expenditures (PCE) to roughly 3.1 percent as of April.
Retailers are usually the group most concerned by the prospect of rising gasoline prices, which divert consumer spending away from other purchases. While the fear is understandable intuitively, there actually is little statistical evidence to support that fear. Since 1992, retail sales excluding gasoline sales and retail sales of gasoline have been positively correlated—meaning that retail sales excluding gasoline tend to rise along with rising gasoline sales. Only during some sub-periods of extreme gasoline price increases have non-gasoline retail sales appeared to suffer (Chart 6).
Conclusion
Rising gas prices are a concern for anyone who fills a gas tank and particularly for anyone who lived through the 1970s oil embargo, long lines and rationing at gas stations, spiraling inflation, and recession. Economists and policymakers also are rightly concerned about the potential for a repeat of those events. But so far, our business cycle indicators suggest continued economic growth ahead, and energy fundamentals broadly remain supportive of continued range-bound energy prices.
A Glossary of the Business-Cycle Conditions Indicators can be found here.
[pdf-embedder url=”https://www.aier.org/wp-content/uploads/2014/07/BCC20140701_update.pdf“]


